Nerve Data Services
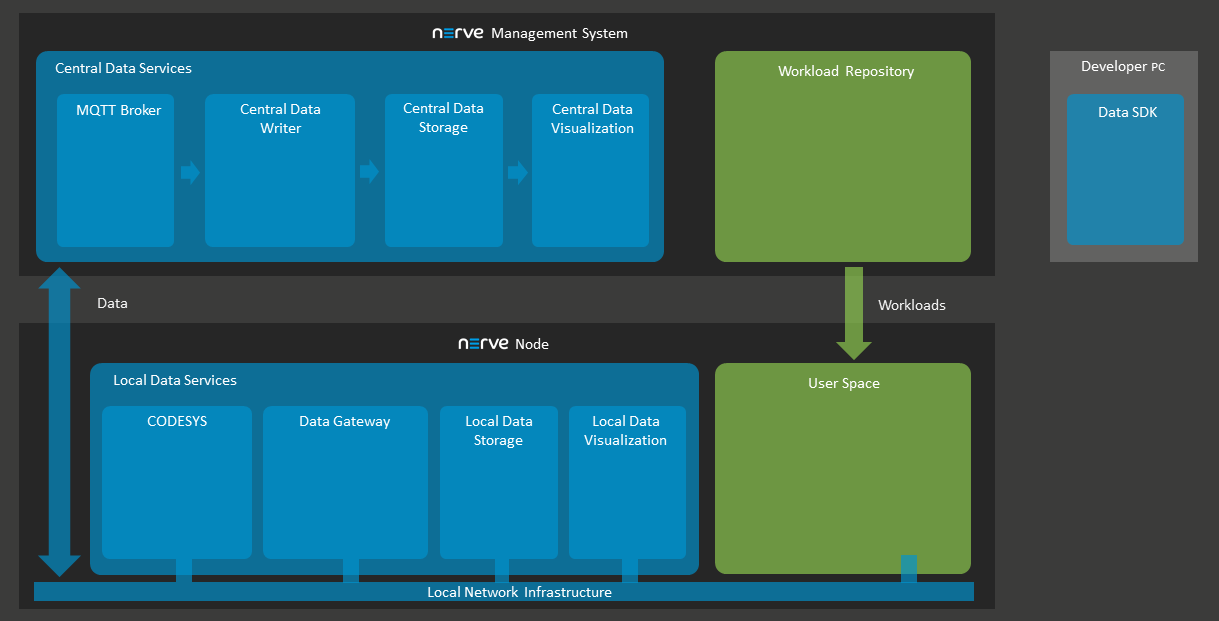
The Nerve Data Services are a collection of services and interfaces that allow to collect, store, analyze, visualize and distribute data. These services and interfaces are available on the Nerve node and in the Management System. Using Nerve Data Services, data can be collected at high speeds on the node and stored or visualized locally at the Node or centrally in the Management System.
Elements of Nerve Data Services
| Nerve Data Services | Description and elements |
|---|---|
| Local Data Services | The Local Data Services are accessible on the node. They include the following elements:
|
| Central Data Services | The Central Data Services are part of the Management System. They include the following elements:
|
| User PC | Data SDK With the Data SDK users can create analytics applications, which can be deployed to a node. |
Most of the above elements are individually configurable. This allows for an application in a large number of scenarios and use cases. However, this also implies deeper knowledge of the elements and their possible interactions. Further explanations of the elements can be found in separate chapters. Find a high-level graphical overview below.
Supported protocols
| Inputs | Outputs |
|---|---|
| MQTT Subscriber | MQTT Publisher |
| OPC UA PubSub Subscriber | OPC UA PubSub Publisher |
| OPC UA Client | OPC UA Server |
| Modbus Server | ZeroMQ Publisher |
| S7 Server | Azure IoT Hub Device |
| ZeroMQ Subscriber | Kafka Producer |
| NerveDB | |
| TimescaleDB | |
| Influx DB |
Model workflow
The following section gives an overview of a typical work flow, presenting what can be done with the Nerve Data Services on a high level:
- Setting up data sources
- Configuring the Gateway to collect data and defining where to distribute it
- Configuring Grafana on the node for local data visualization
- Configuring Grafana in the Management System for central data visualization
- Implementing an analytics app and configuring the Gateway again to send data to the analytics app
- Reconfiguring Grafana to visualize the result of the processing performed by the analytics app
The paragraphs below give short explanations to each step.
Ingesting data on the node
CODESYS can be used to translate fieldbus protocols to OPC UA Server. The local Gateway can then be configured to collect data from CODESYS and distribute it to various destinations. Data sources that support protocols which are also native to the local Gateway can be linked there directly and do not need CODESYS.
Distributing data on the node
Data is distributed by the local Gateway to user defined consumers. Unless the respective protocol of a Gateway output defines a specific data format, all data received by the Gateway is normalized to the Nerve Data Services data format. Typical consumers of data are the local data storage on the node or the central data storage in the Management System, third party MQTT brokers or applications, or providing the data as OPC UA Server. To enable reuse of local Gateway configurations across multiple nodes, keywords can be used to abstract node specific information from the configuration.
Storage on the node
Data is stored in the NerveDB on the node, a dedicated TimescaleDB database. Any application running on the node can access data stored in there. For application development, a Python API is provided in the Data SDK that simplifies reading and writing data. A time window can be configured for how long data shall be kept before deleting it.
Visualization on the node
Visualization is available via Grafana which is pre-configured to allow access to data stored in the local data storage. It is also possible to configure access from Grafana to other user defined data sources without any restrictions, meaning that data in an influxDB that is installed on the node can also be visualized.
Using Data in analytics
A Python SDK is available for creating custom analytics applications. An API is available that simplifies reading data from the local storage or receiving it directly from the Gateway when it arrives there. The API also allows to write back analytics results to the local storage for visualization or send it to an MQTT broker to distribute it to other consumers. It is also possible to use third party applications such as NodeRed or Crosser for analytics together with the Nerve Data Services.
Storing and visualizing in the Management System
Data received on the Node can be forwarded to the Management for visualization. To allow this, the local Gateway and the central visualization must be configured. Keywords are in place to simplify the configuration process. Each node has a separate database in the Central Data Storage.
Data Services UI
The Data Services are present on both the node and on the cloud. However, the instance on the node is the single point of configuration. The instance in the Management System is mainly used for viewing data.
Also, note that by default, the permission to access to Data Services in the Management System is not granted. Users that have the permission to create user roles can enable the Data Services entry in the navigation by adding the UI_NAV_DATA_SERVICES:VIEW permission to a user role. A Data Services user role is also defined in the Management System by default that can be added to a user. Refer to Users for information on how to create new users and to Roles and permissions for information on how to add a new role.
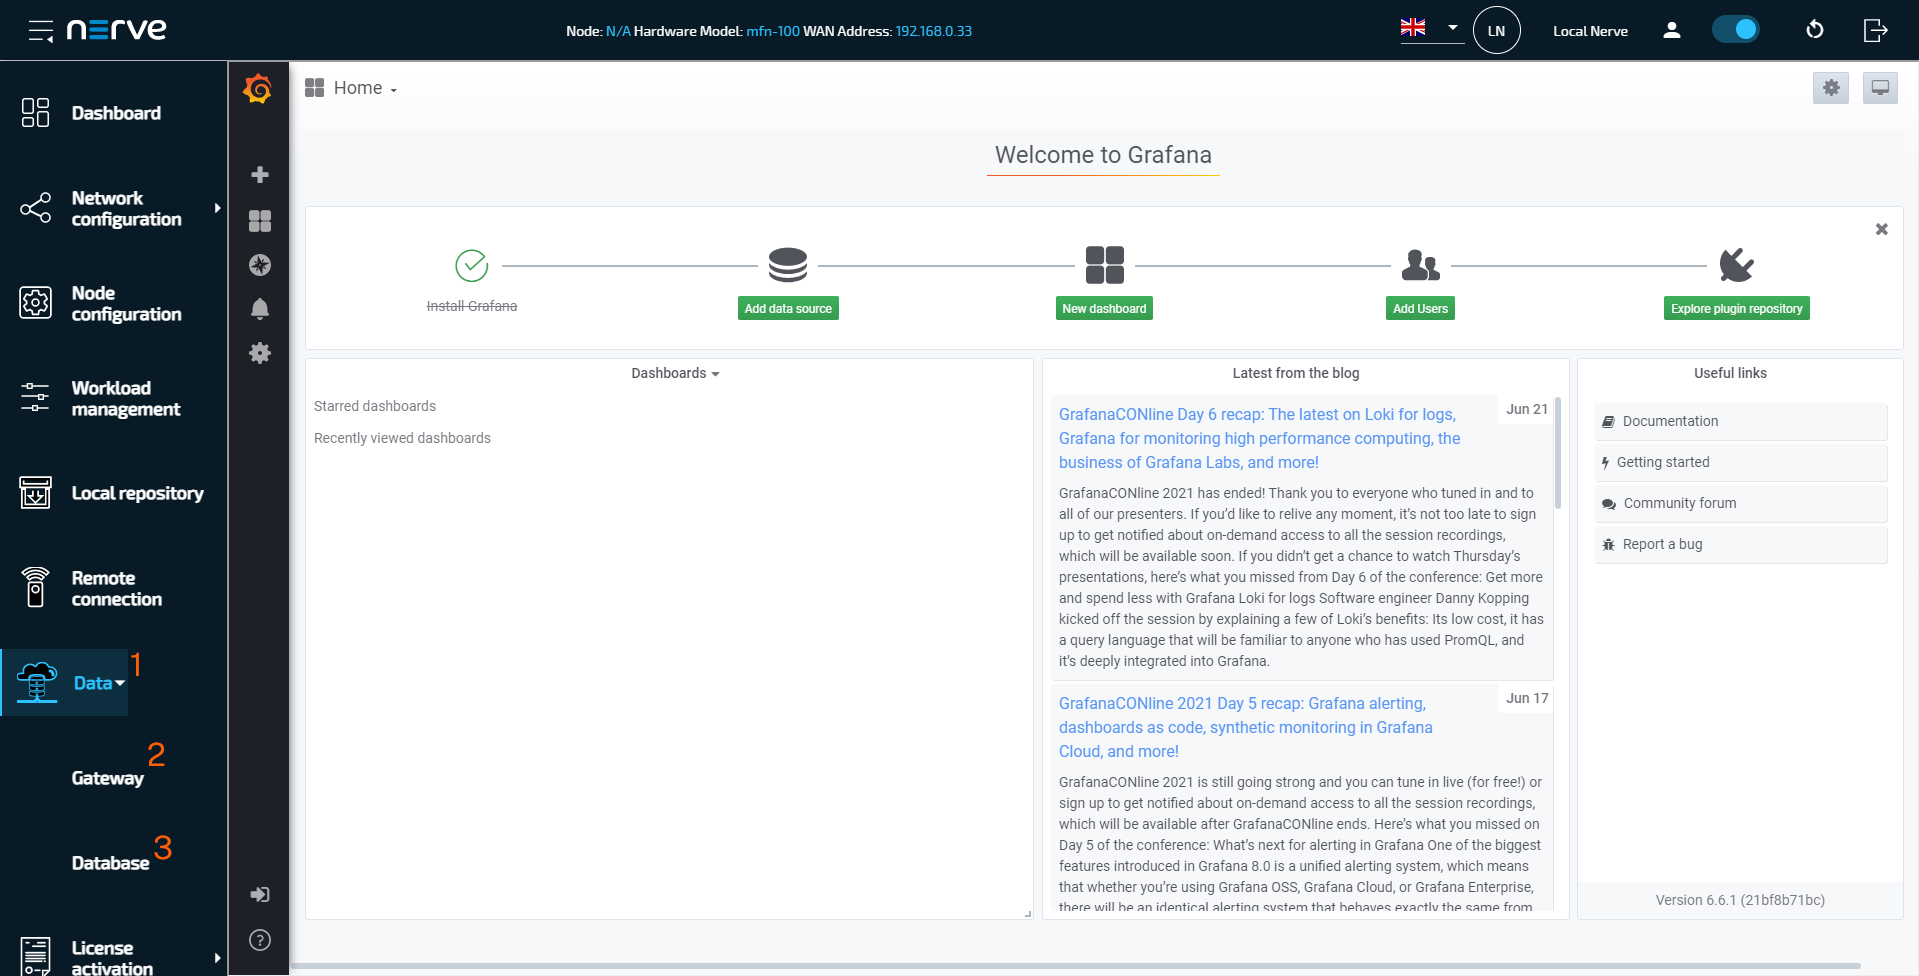
Select the arrow next to Data in the navigation on the left to expand the following items:
Note
Note that the navigation on the left collapses when Data is selected. Select the burger menu in the top-left corner to expand the navigation menu again.
| Item | Description |
|---|---|
| Data (1) | Clicking here opens the visualization component of the Data Services and the Grafana landing page is displayed. For more information on visualization, refer to Data Visualization. |
| Configuration (2) | Select this to reach the Gateway. The Gateway is the single point of configuration for data connectivity in the Nerve Data Services. Configure inputs, outputs and connections here. Refer to Nerve Data Services Gateway for more information. |
| Database (3) | Data from databases can be viewed here. Every node has a local NerveDB database. In the Management System, databases are discerned by the serial numbers of the nodes and can be used to confirm the flow of data. Refer to Database for more information. |