Nodes
The nodes menu has two sub-menus in the navigation on the left and two tabs in the default view.
The node tree tab is the default view of the Management System. It displays all registered nodes in a node tree. It mainly serves an organizational purpose and does not impact the functionality of the nodes. Nodes and workloads can be managed in the node details view, which is reached through the node tree.
Selecting the node list tab displays a list of all available nodes that have been registered in the Management System. Add, remove, and edit nodes here.
Available updates for nodes can be found in the Updates sub-menu. Performed node updates can be viewed in the Update Log. When an update is performed, the update log also shows the current progress of the update.
Node tree
The node tree is the landing page of the Management System. It presents an overview of all nodes that are connected to the Management System, embedded into tree view elements. Being mainly a means of organization, it has no impact on the functionality of the nodes and their workloads. Select Nodes in the navigation on the left. Then select the node tree tab  on the right.
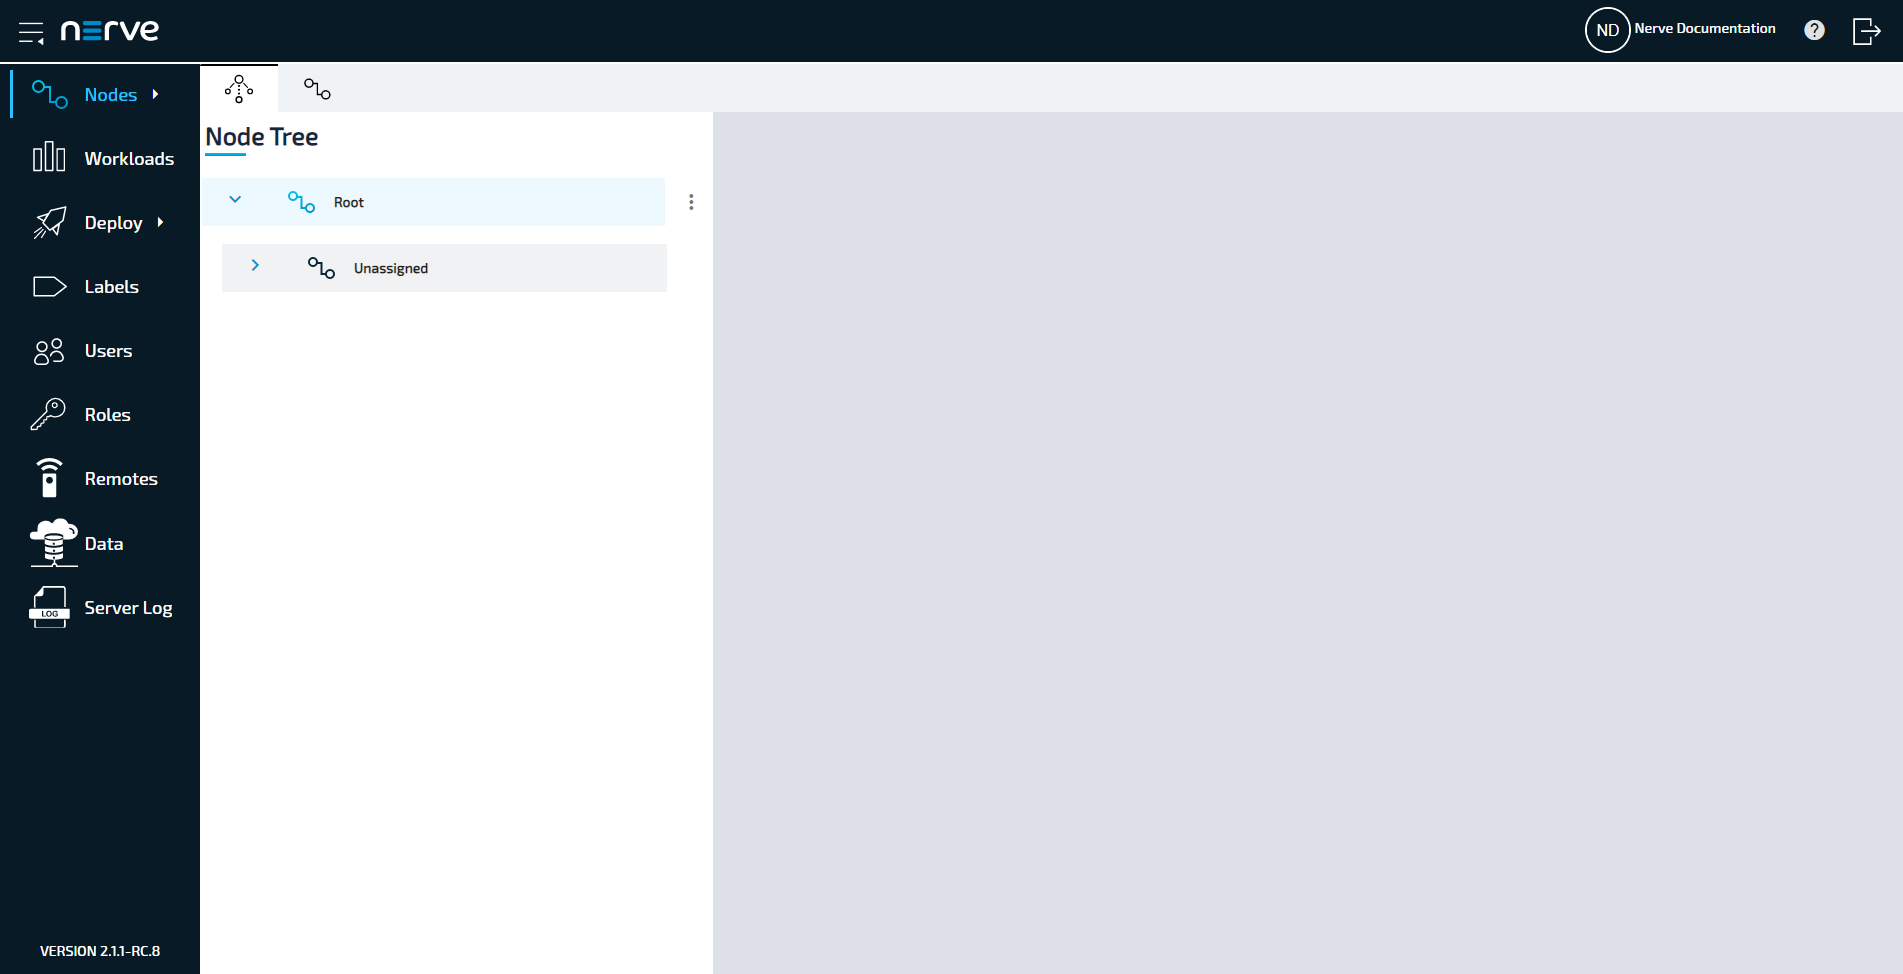
There is only one element under the root after the initial setup: Root > Unassigned. All nodes that are registered in the Management System are placed in the Unassigned element by default. From there they can be moved to new elements that have to be created first.
Creating a new element in the node tree
Before moving a node out of the Unassigned element, create a new element in the node tree. Elements in the node tree exclusively serve an organizational purpose.
- Select Nodes in the navigation on the left.
- Select the node tree tab on the right.
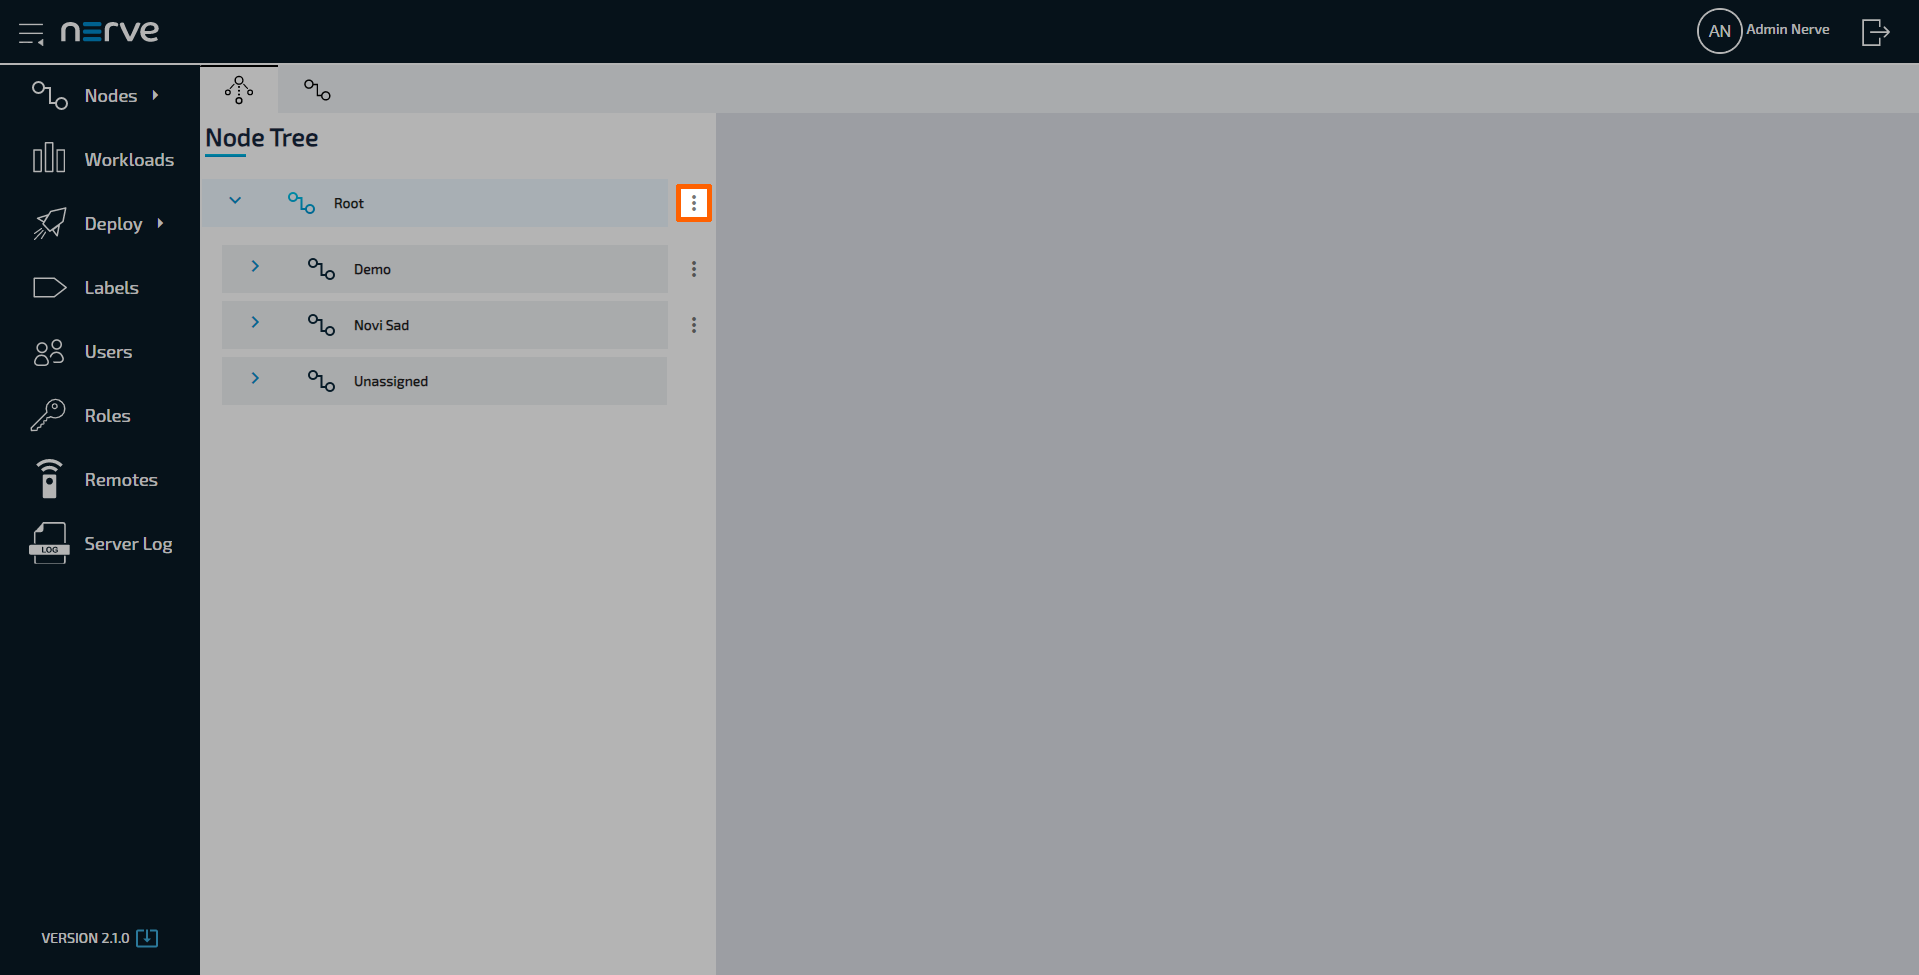
-
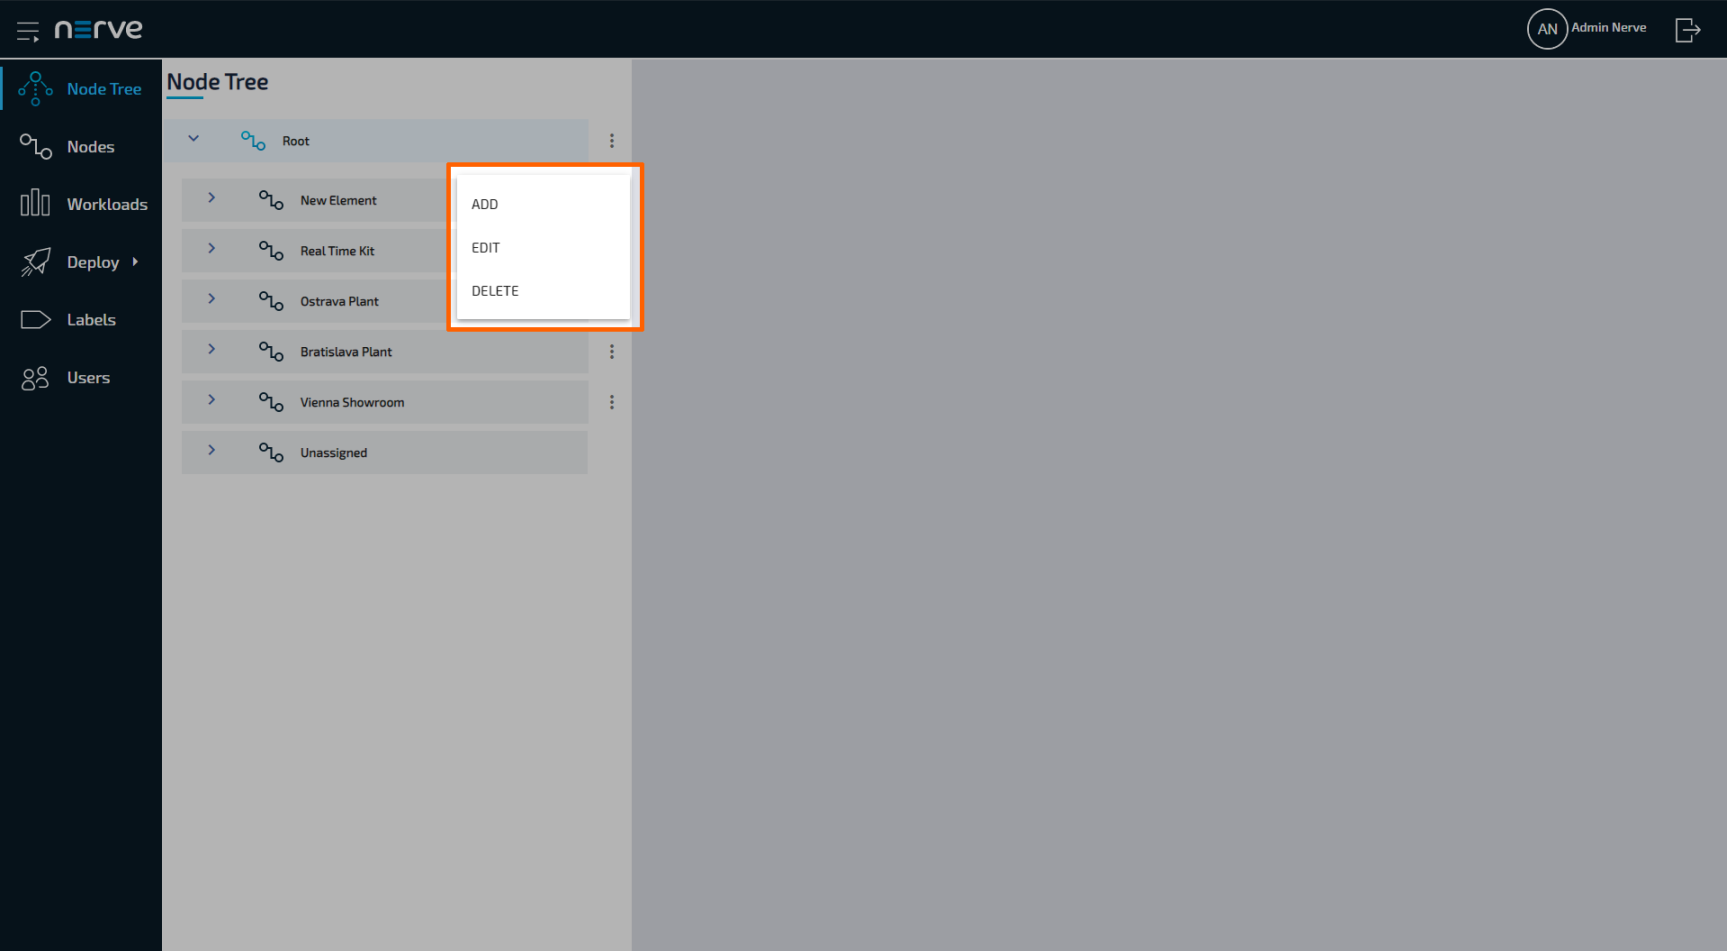
Select the ellipsis menu to the right of Root in the node tree.
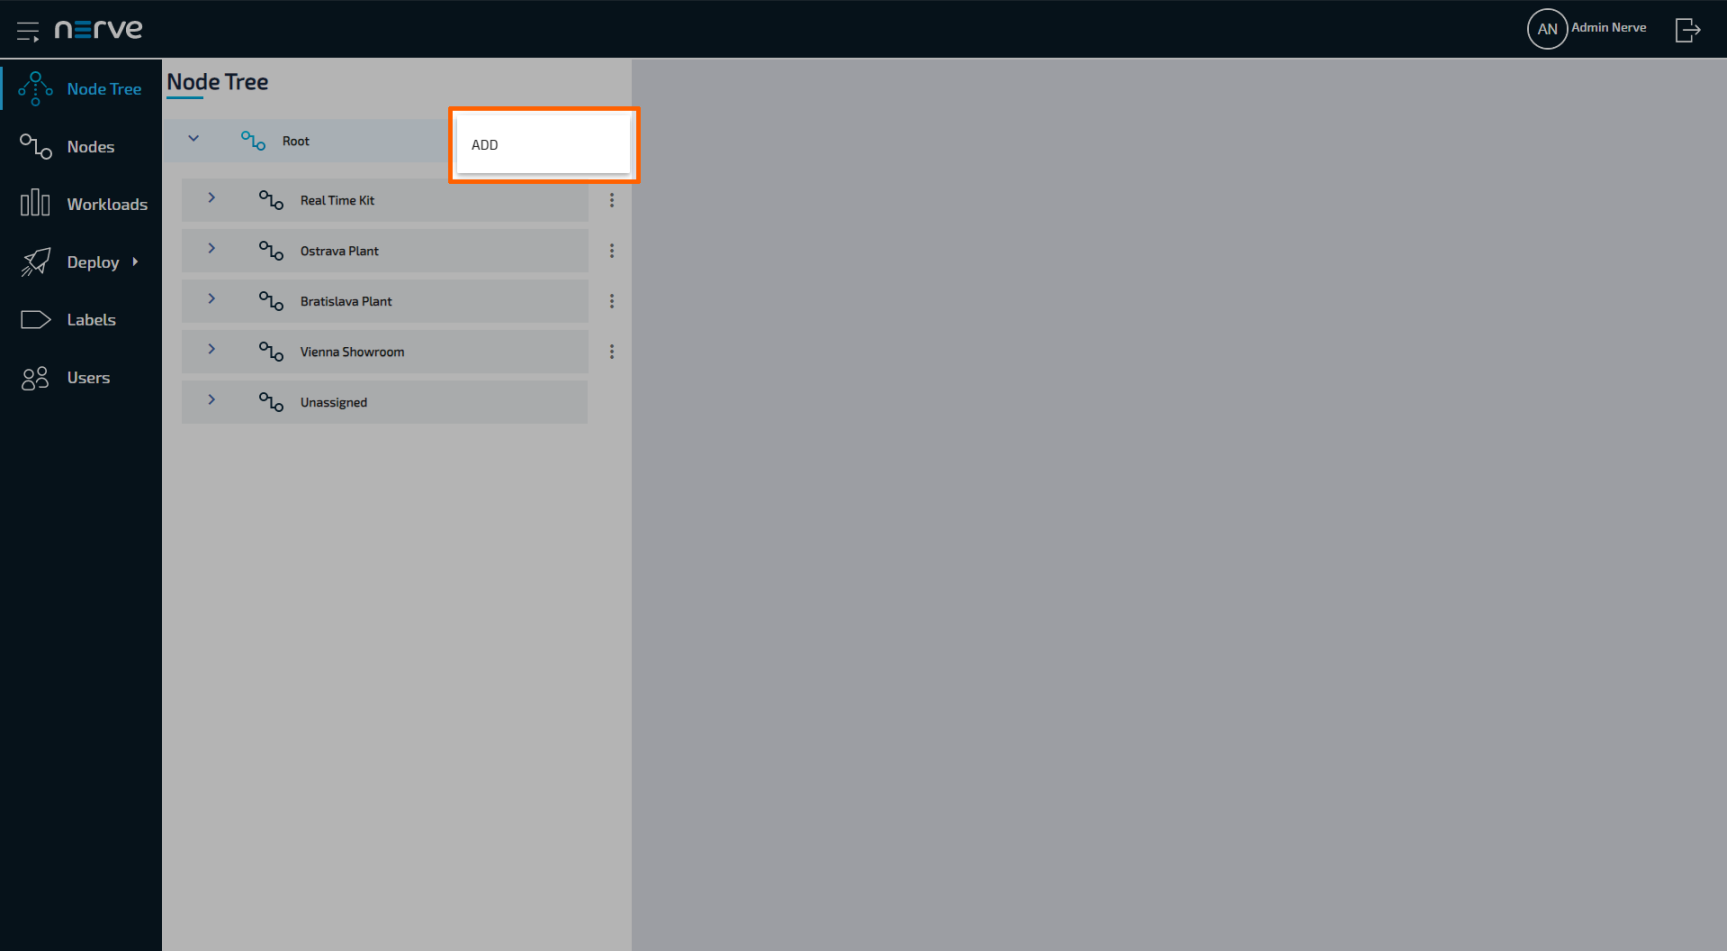
-
Click Add in the overlay that popped up.
-
Enter the name of the new element under Location name.
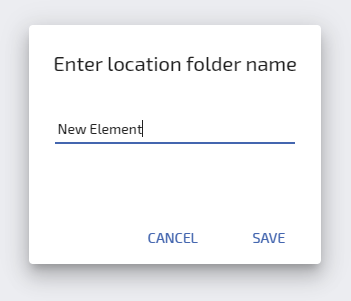
-
Click Save.
-
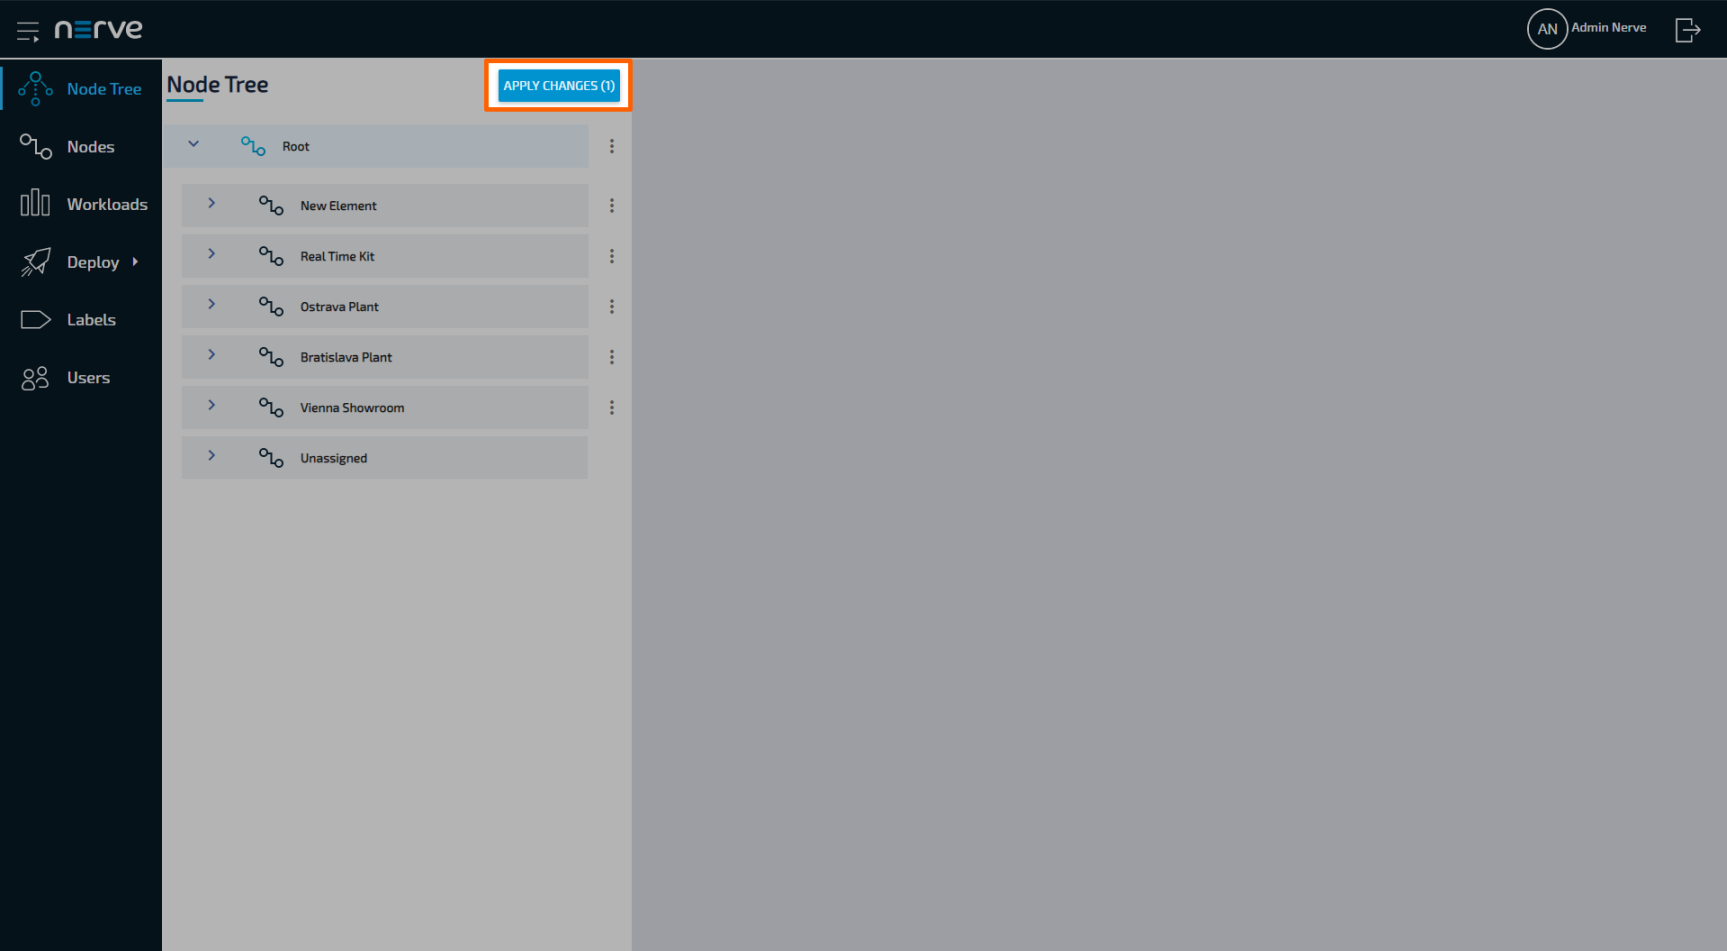
Select APPLY CHANGES (n) in the upper-right corner of the node tree.
Note
(n)is a placeholder for the number of changes made to the node tree. If three changes have been performed,(3)will be displayed in the button above the node tree.
The new element now appears under the Root element.
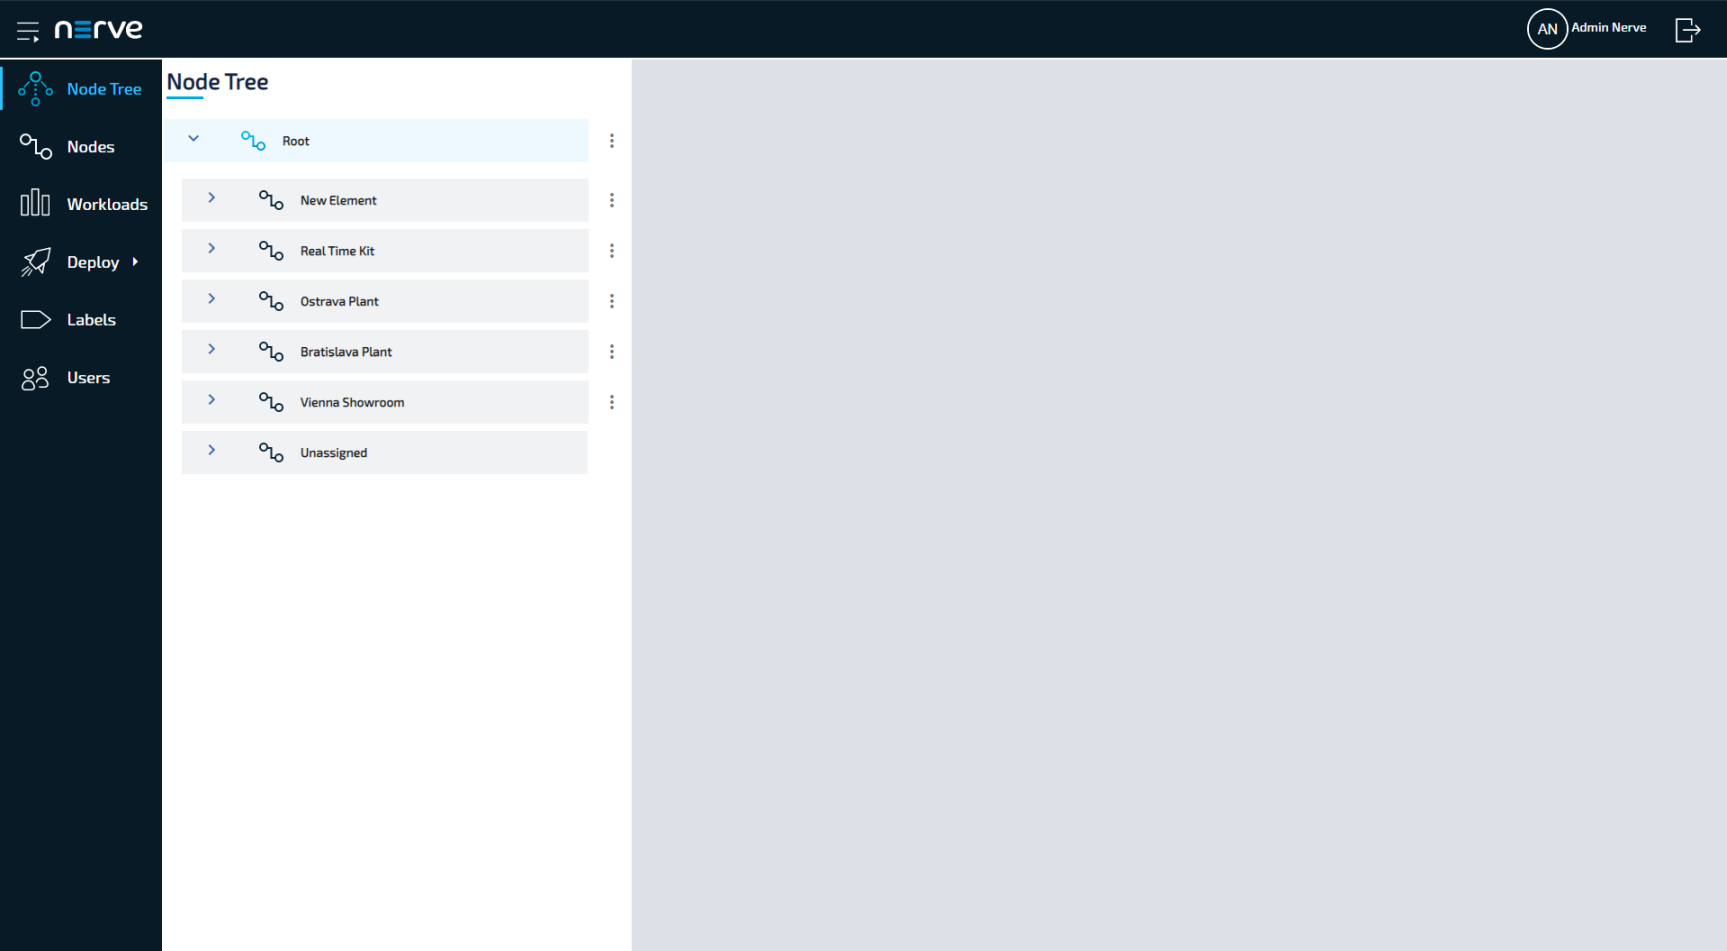
Create more elements and freely modify the node tree. To the right of every created element, there is an ellipsis menu that opens up an overlay. Add additional elements, edit the names of elements or delete the elements here.
Note
- The order of the tree elements can be modified easily. Drag and drop an element to its new position.
- When a tree element is deleted, all of the nodes inside the element will be moved to Unassigned.
Moving a node from one tree element to another
Moving nodes in the node tree is very straightforward and intuitive and possible by drag and drop. Make sure that a new tree element is created before attempting to move a node.
- Select Nodes in the navigation on the left.
- Select the node tree tab on the right.
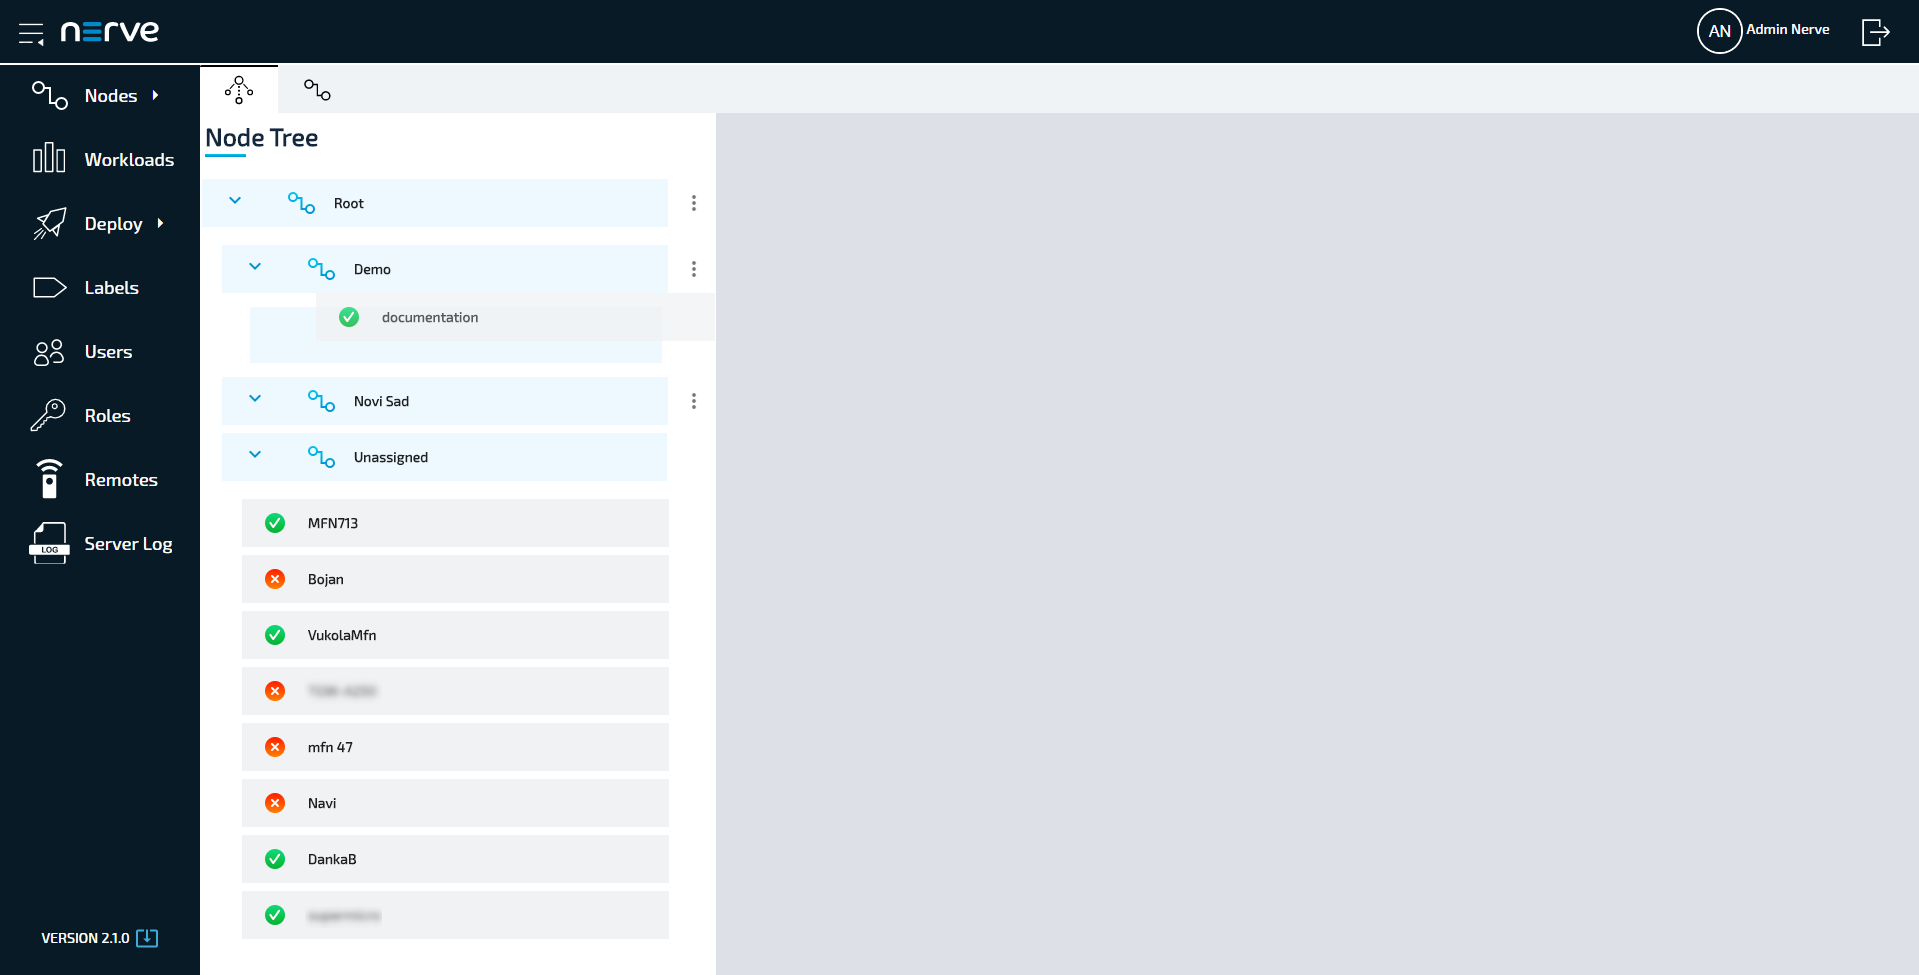
- Expand the tree element of the node that will be moved. The default element is Root > Unassigned.
- Choose the node to move.
-
Drag and drop the node to the newly created element. Elements expand automatically once as they are hovered over.
-
Select APPLY CHANGES (n) in the upper-right corner of the node tree.
Note
(n)is a placeholder for the number of changes made to the node tree. If three changes have been performed,(3)will be displayed in the button above the node tree.
The node has now been moved to the new element.
Note
A node cannot be moved back manually to Unassigned once it has been moved to another element.
Managing nodes in the node tree
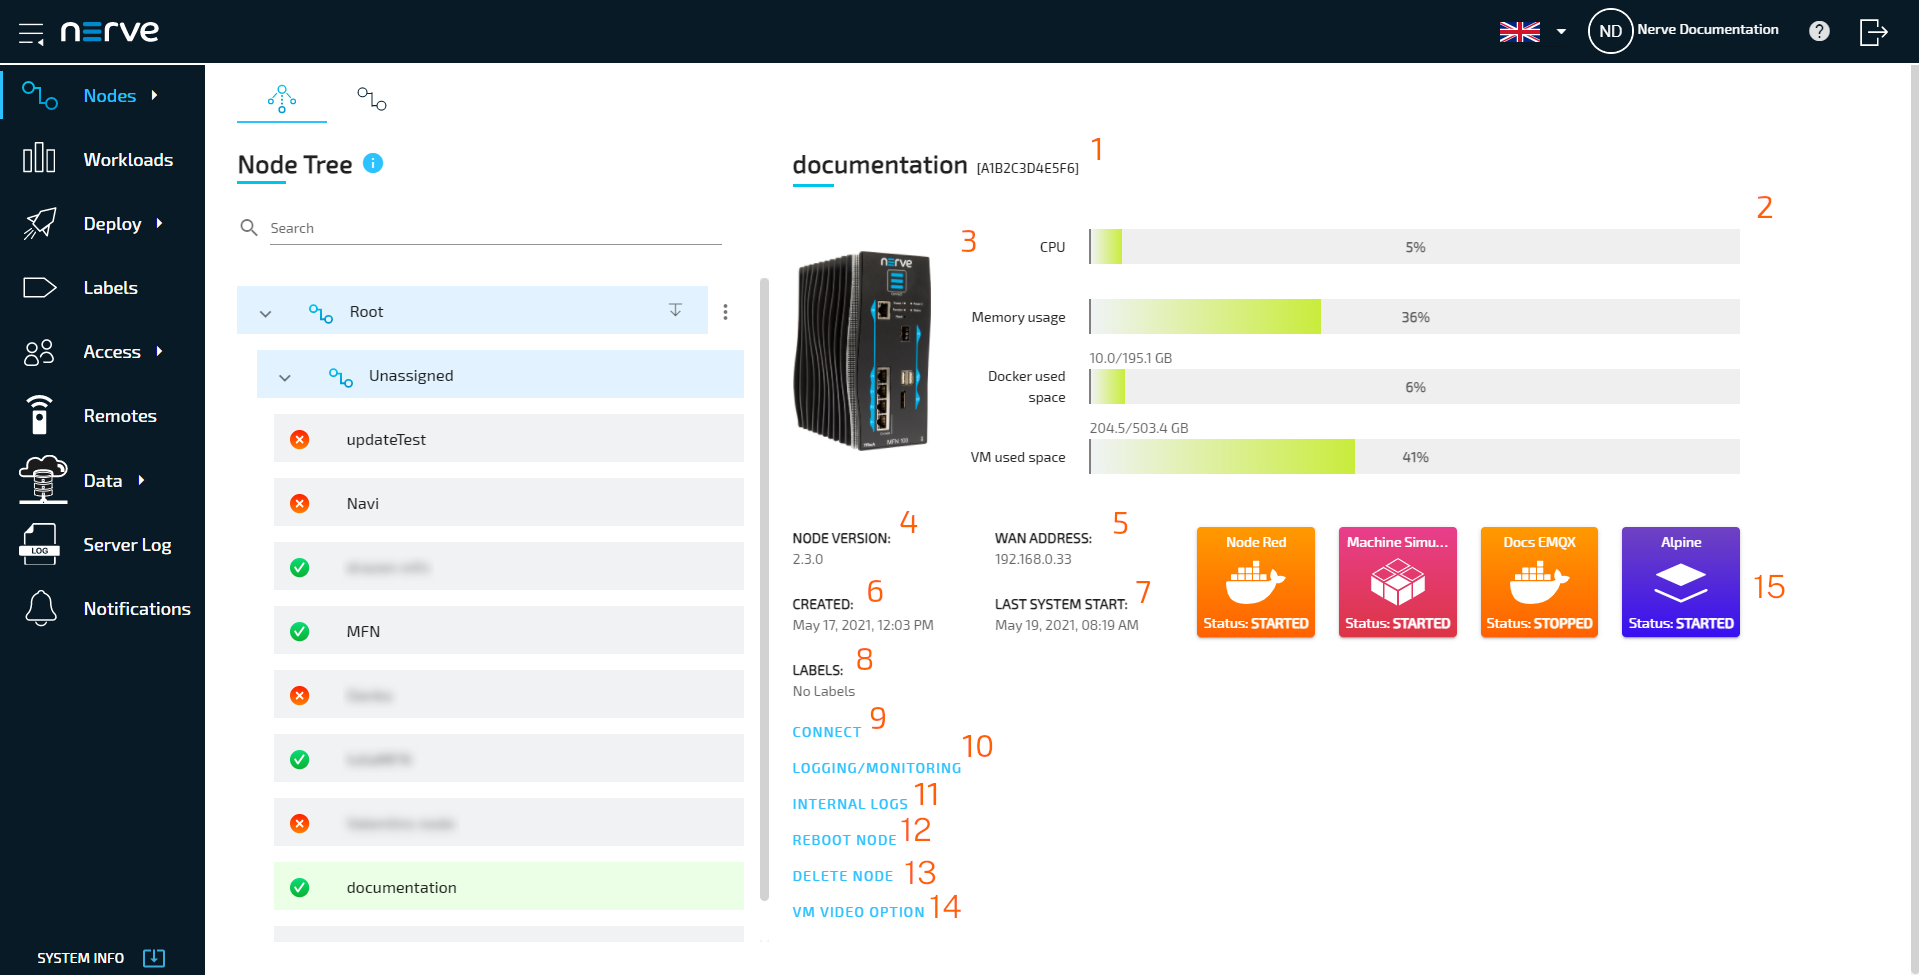
Once nodes are registered in the Management System, view their details next to the node tree. To view the details of a node, select the node name or symbol.
| Item | Description |
|---|---|
| Node name and serial (1) | Here the name and serial number of the node are shown. The serial number is next to the name in brackets. |
| System metrics (2) | The system metrics that are available in the Local UI dashboard are also visible here:
|
| Device image (3) | An image of the hardware model is displayed here according to the device type that was selected when the node was added. |
| NODE VERSION (4) | The version of the node depending on the product version of Nerve. |
| WAN ADDRESS (5) | This is the network address of the node that has been assigned by the DHCP server. |
| CREATED (6) | This is the date when the node was added to the Management System. |
| LAST SYSTEM START (7) | This is the timestamp of the last node restart. |
| LABELS (8) | Labels that are assigned to this node are listed here. Labels can be set in the Management System. Refer to Labels for more information. |
| CONNECT (9) | Clicking here opens an overlay, through which a remote connection to the node can be established. Refer to Remote Connections for more information. |
| LOGGING/MONITORING (10) | Select this to open an overlay that allows enabling of logging and monitoring, as well as viewing dashboards. Enable the following settings by toggling the button for each setting:
|
| INTERNAL LOGS (11) | Clicking here will open a new window and show the system logs of the node. The internal node logs are aimed at Nerve service technicians in case of error and failure. Data is stored with Elasticsearch and the logs are visualized with the Kibana application. The amount of logs can be modified through the log level settings by Nerve service technicians. Contact customer support for more information. |
| REBOOT NODE (12) | Clicking here will reboot the node after a confirmation dialog. Select Yes to initiate the reboot. All running workloads will be stopped. After the reboot, the workloads will return to their previous state. Running workloads will be started. Stopped workloads will stay stopped. |
| DELETE NODE (13) | Clicking here removes the node from the Management System. The node needs to be registered again after it has been removed. |
| VM VIDEO OPTIONS (14) | Note that this feature is only available on request. Configure the video output of Nerve Devices to directly output the interface of deployed virtual machines. Doing so allows operating virtual machines directly at the Nerve Device. Refer to Virtual machine video options below for more information. |
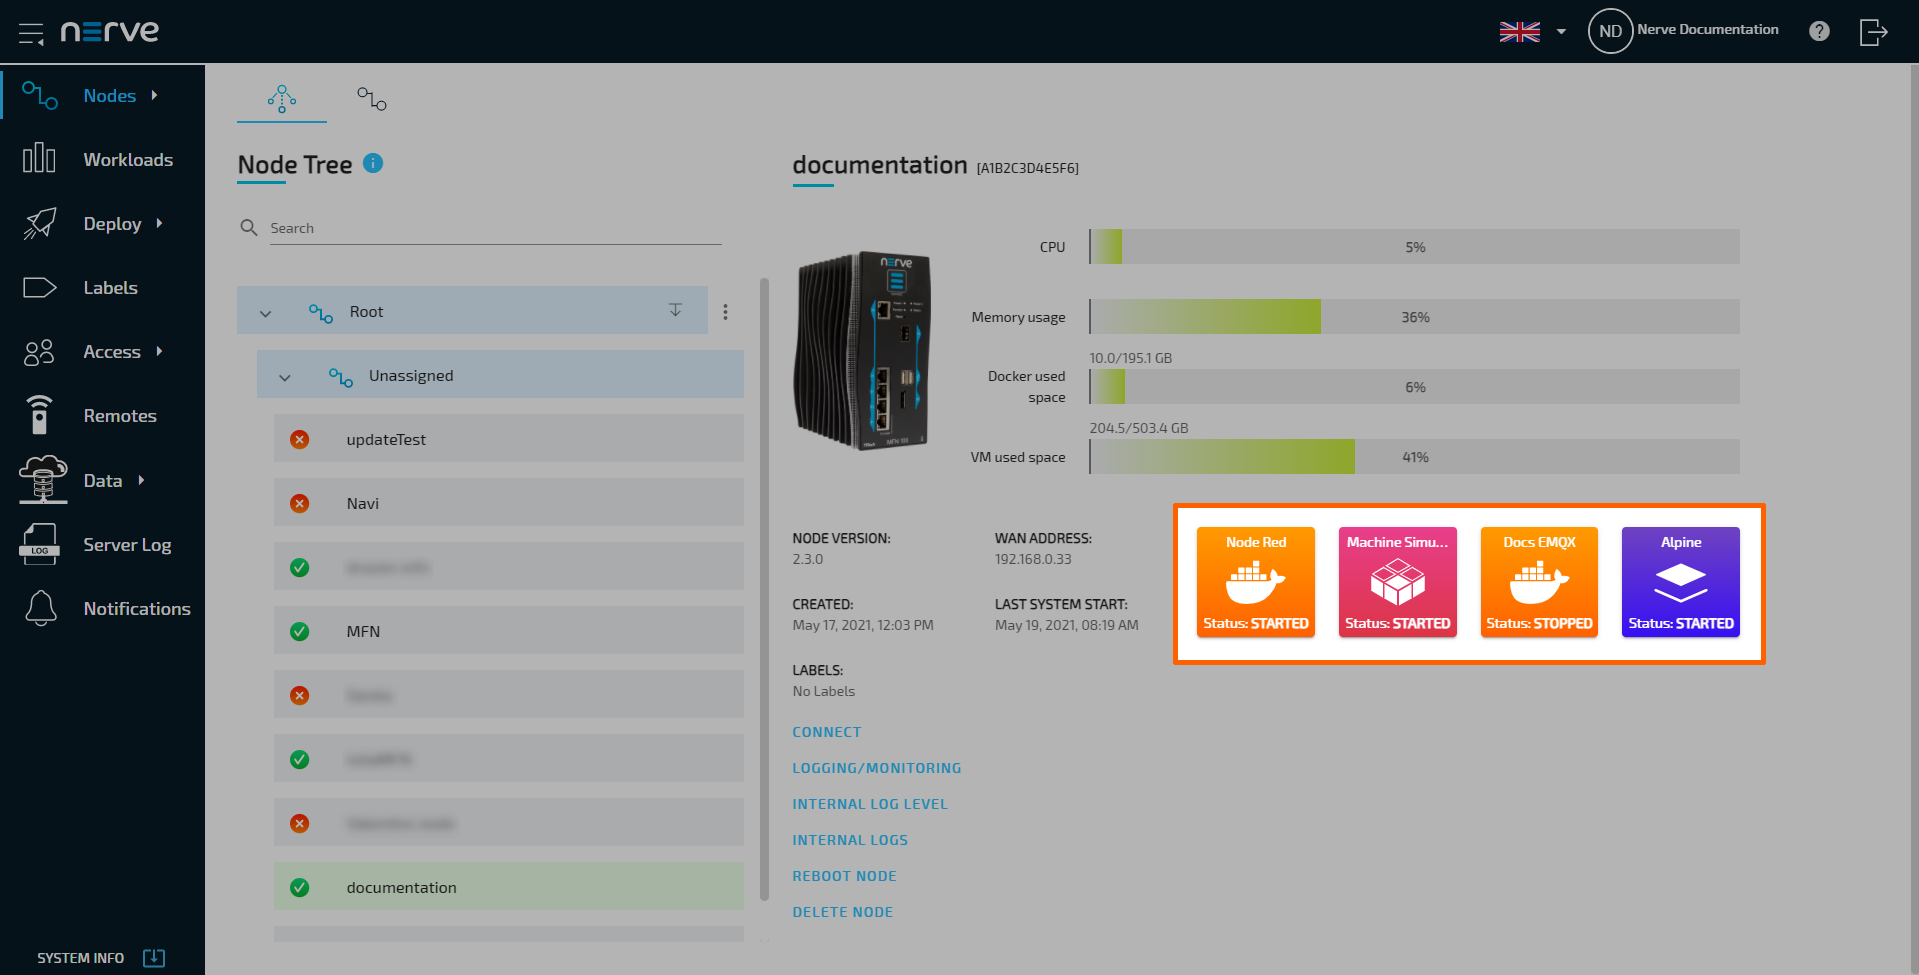
| Workloads overview (15) | Find workloads that have been deployed to the Nerve Device displayed in tiles here. Selecting these tiles leads to a control area in which the workload can be controlled. If there are no tiles, no workloads have been deployed to the Nerve Device. Refer to Workload control below for more information. |
Workload control
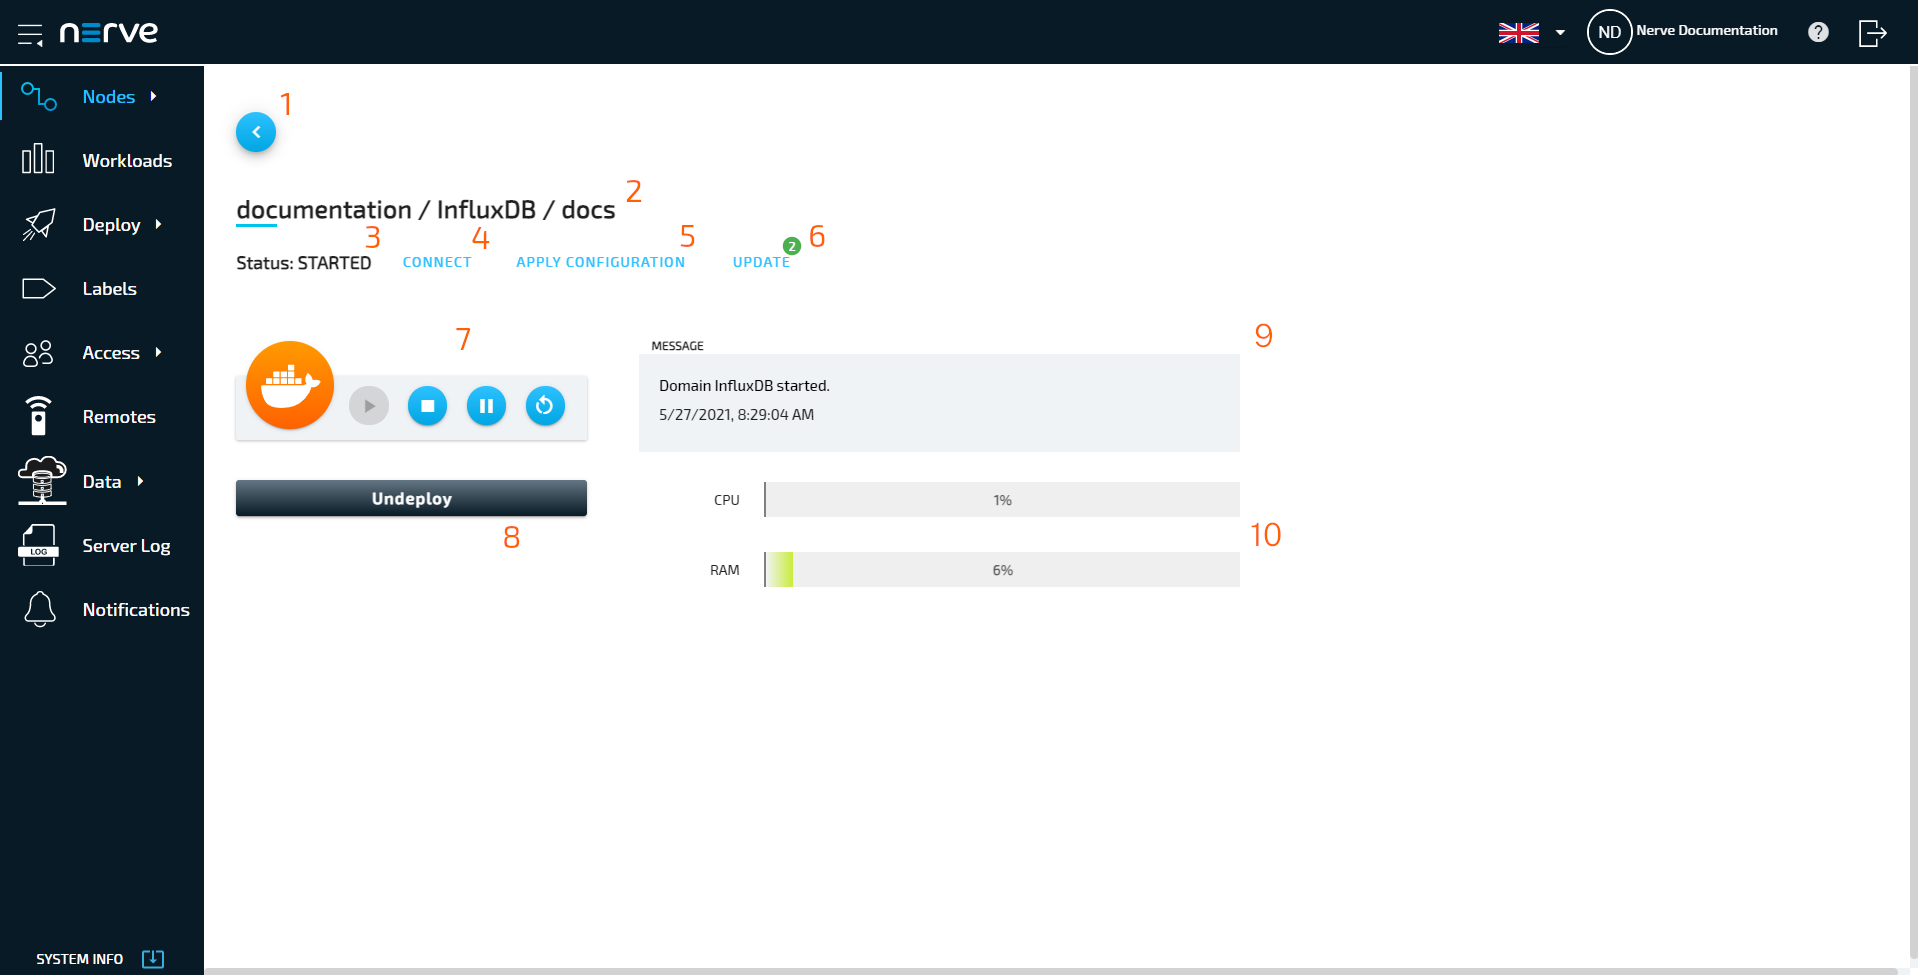
All workloads that have been deployed to the node are displayed in tiles below the node details in the node tree. Clicking these tiles allows control of the respective workload. The control options are minimally different for each workload type. Note that CODESYS workloads can only be controlled from the Local UI.
| Item | Description |
|---|---|
| Back button (1) | Click here to return to the node tree. |
| Device and workload name (2) | The names of the device, the workload and the release name are displayed here as <devicename> / <workloadname> / <releasename>. The name of the workload version is not displayed. |
| Workload status (3) | The current status of the workload is displayed here. The possible statuses are the following:
|
| CONNECT (4) | Clicking here opens an overlay, through which a remote connection to the workload can be established. Refer to Remote Connections for more information. |
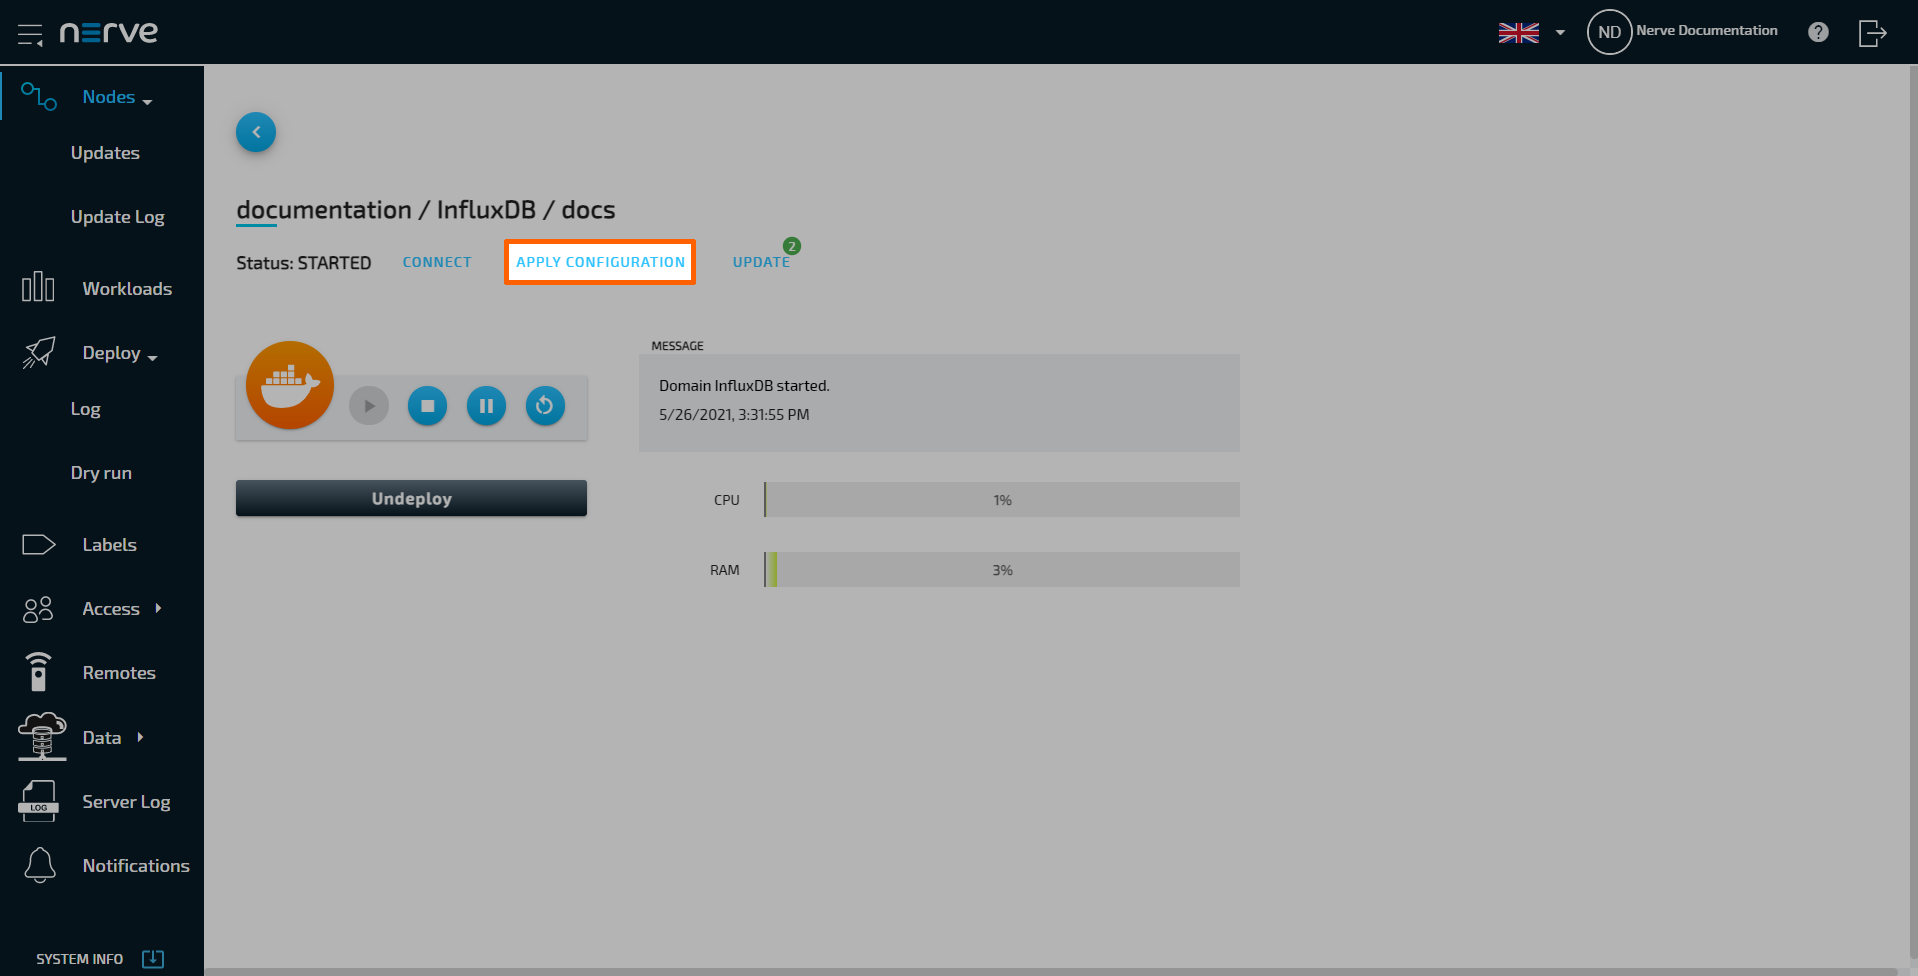
| APPLY CONFIGURATION (5) | This element only applies to Docker workloads with configuration storage defined. Selecting this allows the upload of configuration files. The configuration files have to be archived and uploaded in a ZIP file. For more information, refer to Applying configuration files to a workload below. |
| UPDATE (6) | This element applies to CODESYS and Docker workloads. Select this to open an overlay displaying all available versions of this workload. Note that the notification bubble displays the total number of available versions of this workload. Refer to Updating a deployed workload for more information. |
| Control panel (7) | The following control options are available:
|
| Undeploy (8) | Selecting this removes the workload from the node. The tile in the node detail screen disappears. The workload can be deployed again from the deployment menu. |
| Message window (9) | The message window displays the latest message the workload has sent out including a time stamp. The type of message that is displayed here depends on the workload. Messages for VMs and Docker containers:
Additional set of messages for VMs only:
Messages from CODESYS workloads:
|
| Usage statistics (10) | Virtual Machine workloads and Docker workloads have their assigned resources they can use. The use of these resources is displayed with bar graphs:
|
Note
Since CODESYS workloads can only be controlled through the Local UI, the workload control screen does not offer any control options. It offers a message window. the option to undeploy the workload and the CONNECT button for establishing remote connections.
Applying configuration files to a workload
Configuration files can be applied to deployed Docker workloads through the workload control screen. In this case, configuration files are files that the application in the Docker workload needs to perform a specific task. The nature of these files is completely dependent on the application. Therefore, these configuration files need to be prepared by the workload creator beforehand. They also need to be archived as a ZIP file so that they can be applied to a Docker workload using the Management System. Configuration files can be applied to the Docker workload while it is running, stopped or suspended.
Also, note that the workload needs to be properly configured before it is deployed in order to apply a configuration. At least one Docker volume for persistent storage needs to be defined, as well as marking the first volume as configuration storage. For more information, refer to Settings for Docker workloads.
Note
Note that this functionality is also available in the Local UI.
- Select Nodes in the navigation on the left.
- Select the node tree symbol.
- Select a node with a deployed Docker workload from the node tree.
-
Select the tile of the Docker workload in the node details view on the right.
-
Select APPLY CONFIGURATION.
-
Select the plus icon to open the file browser.
- Select the ZIP file containing the configuration files.
-
Select Open to add the ZIP file.
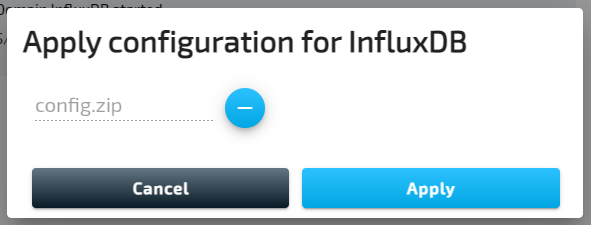
-
Select Apply.
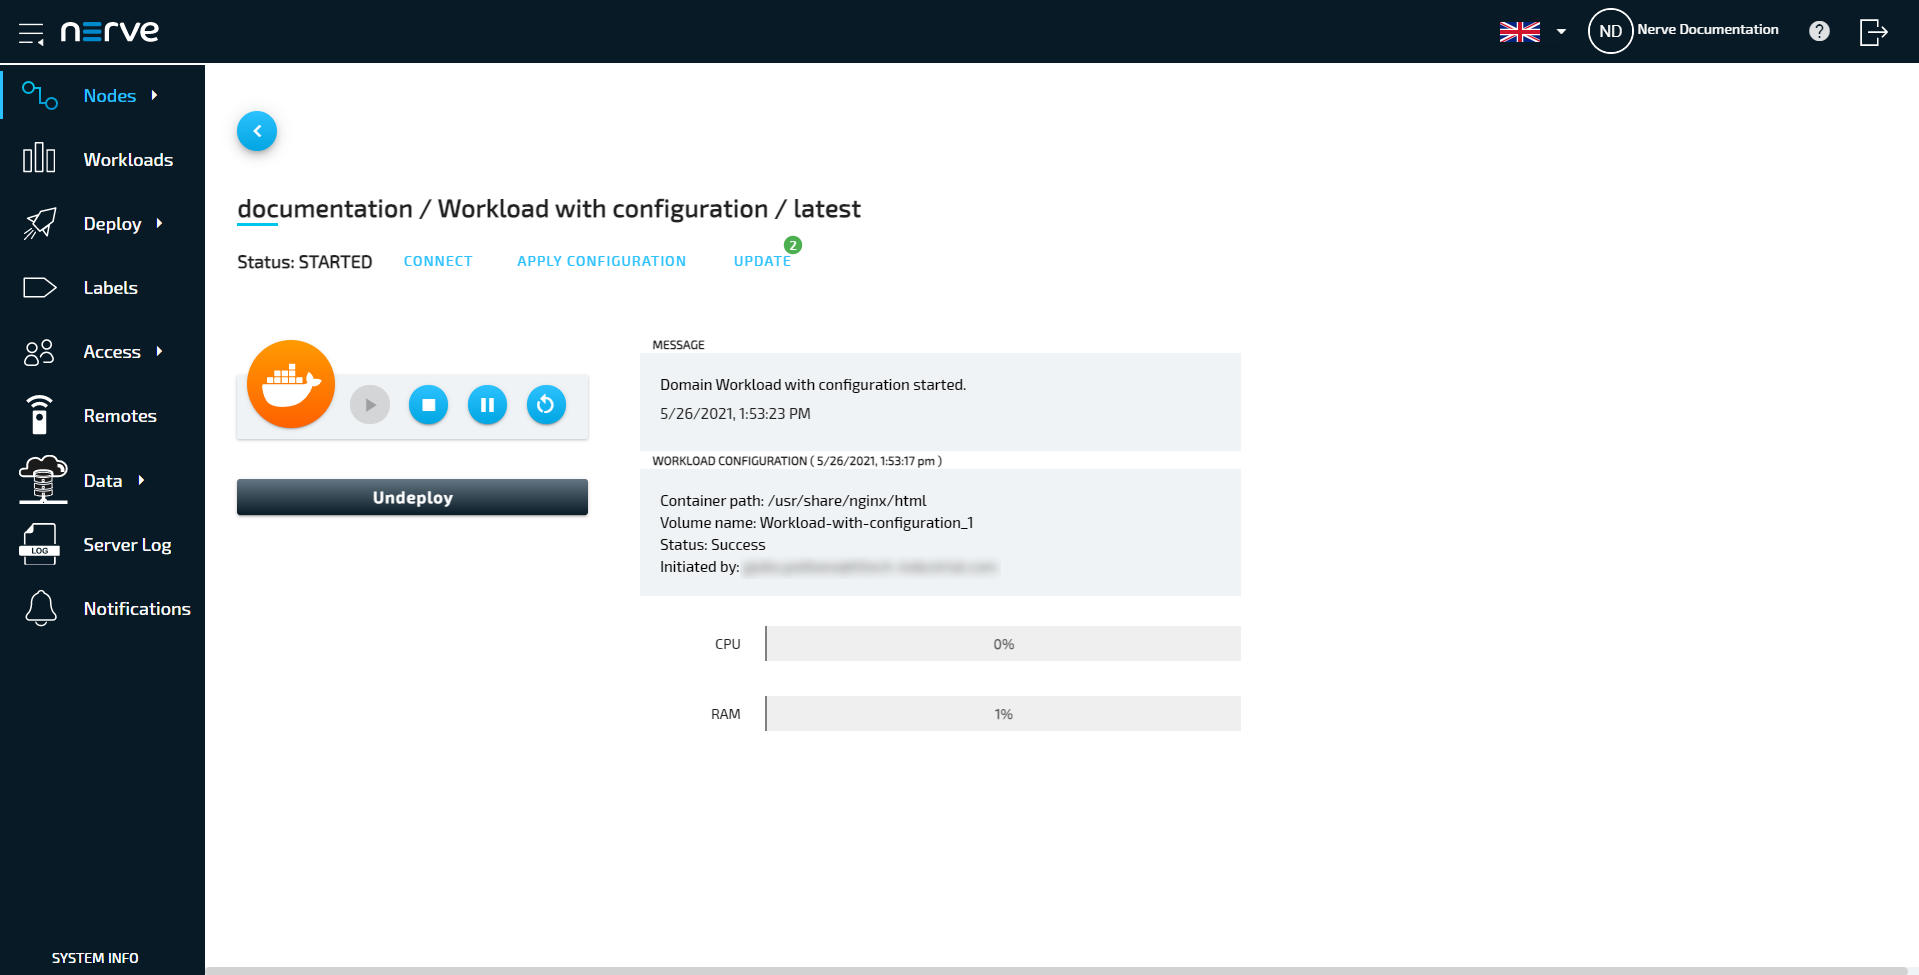
A success message will pop up in the upper-right corner once the ZIP file has been applied. Also, a new message window labelled WORKLOAD CONFIGURATION is added. It includes the following information:
| Item | Description |
|---|---|
| Timestamp | A timestamp in the format M/DD/YYYY, h:mm:ss am/pm is added next to WORKLOAD CONFIGURATION in the header of the workload configuration message window. This indicates the most recent time configuration files have been applied. |
| Container path | This is the path of the Docker volume that has been defined in the workload version settings before the deployment of the workload. |
| Volume name | This is the name of the Docker volume that has been defined in the workload version settings before the deployment of the workload. |
| Status | This indicates whether the files containing in the ZIP file have been successfully transferred to the Docker container. |
| Initiated by | Here the user is listed that applied the configuration files. |
Changing resource allocation of a deployed Virtual Machine workload
The allocation of resources for Virtual Machine workloads can be modified while the workload is deployed and running on a node. This allows for balancing of resources when several Virtual Machine workloads are running on one node. Note that the workload automatically restarts in order to apply the changes.
- Select Nodes in the navigation on the left.
- Select the node tree symbol.
- Select a node with a deployed Virtual Machine workload from the node tree.
-
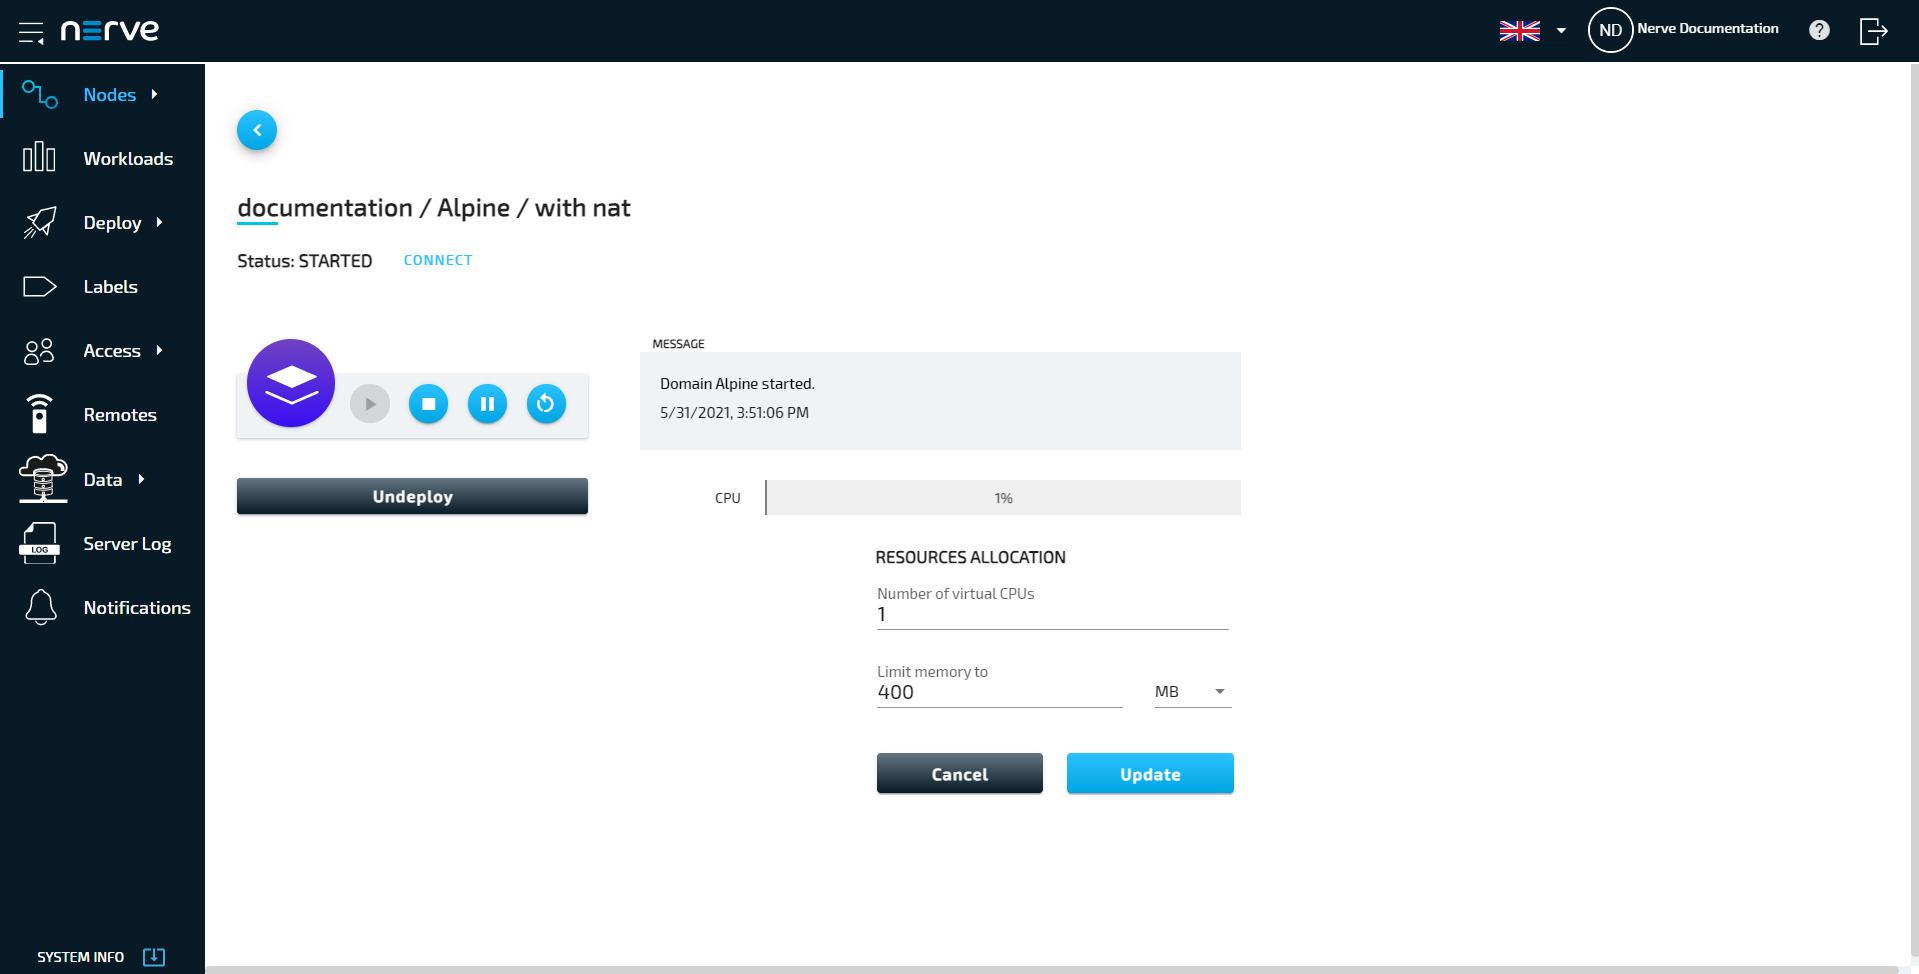
Select the tile of the Virtual Machine workload in the node details view on the right.
-
Edit the values of Number of virtual CPUs and Limit memory to to the desired values.
-
Select Update.
-
Select Yes in the pop-up that appeared.
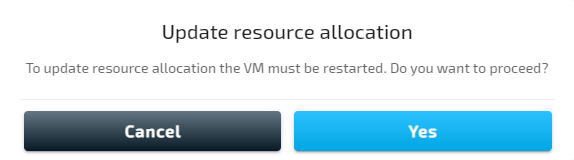
A green notification pops up in the upper-right and the Virtual Machine workload is automatically restarted to apply the changes.
Note
This functionality is also available in the Local UI. Log in to the Local UI and select Workload Management in the navigation on the left. Select a Virtual Machine workload and follow the steps above.
Virtual machine video options
Note
The following feature is not enabled by default. The Nerve Device needs to be configured by service technicians first. Contact a sales representative or TTTech Industrial customer support to request this feature to be enabled. Note that there are two options: regular and grid display. Make sure to state the display mode when requesting the feature to be enabled.
The video output of Nerve Devices can be configured to directly output the interface of deployed virtual machines. This means that by connecting one or more monitors, a keyboard and a mouse, virtual machines can be operated directly at the Nerve Device. There are two display modes that can be chosen: regular and grid display. Note that only one of the two modes can be active. Refer to the images below for more information on possible VM display scenarios:
One monitor, multiple virtual machines, one at a time
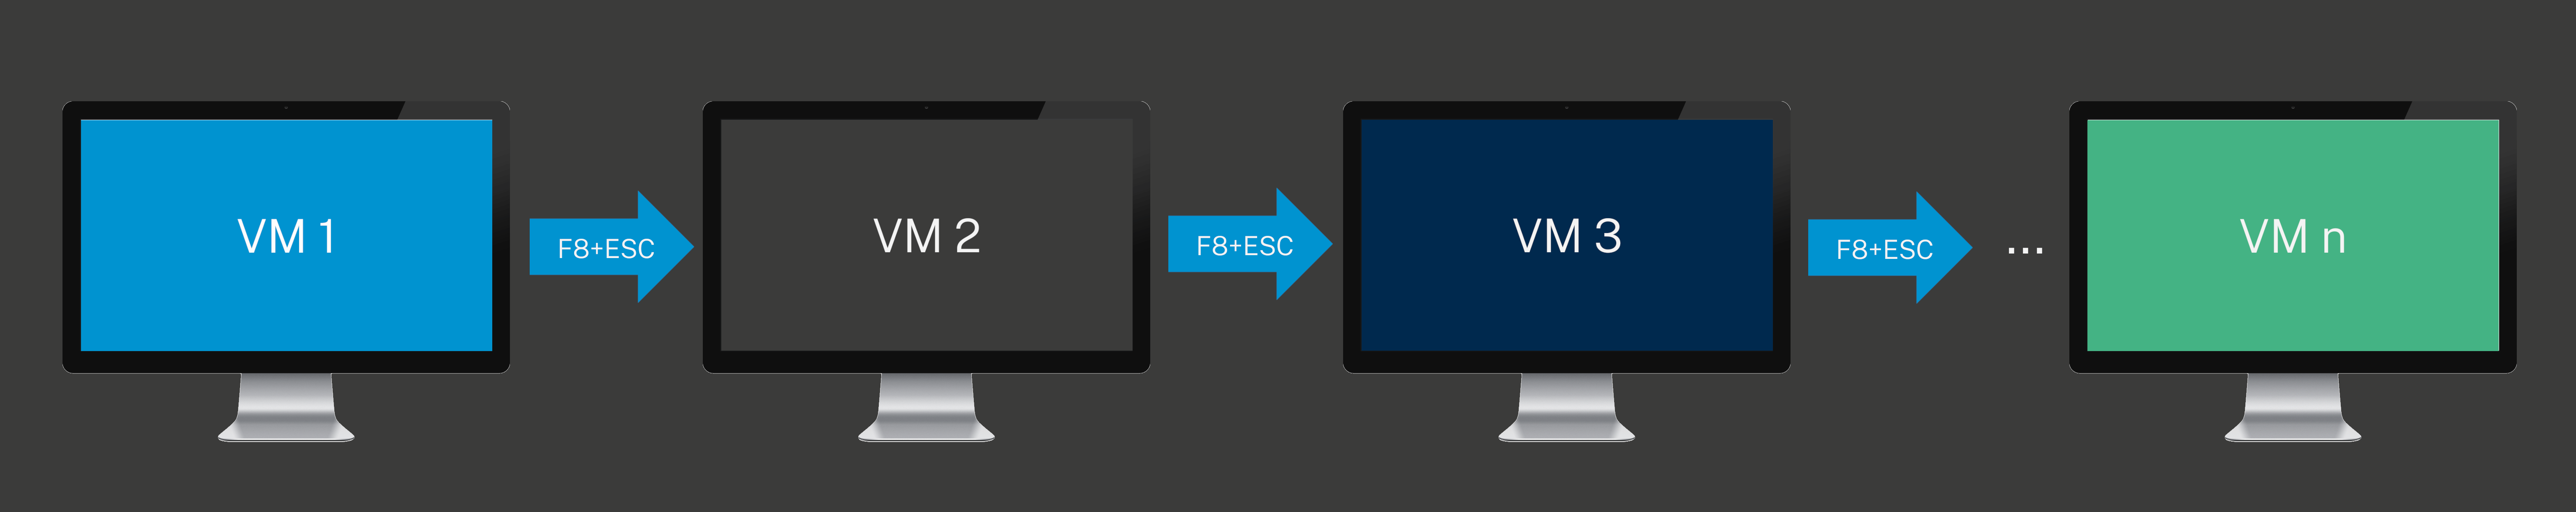
Request regular display mode to use the feature this way. Press F8+Esc to switch between VMs. Determine the order of the VMs by changing the display order settings in the VM video options menu in the Management System.
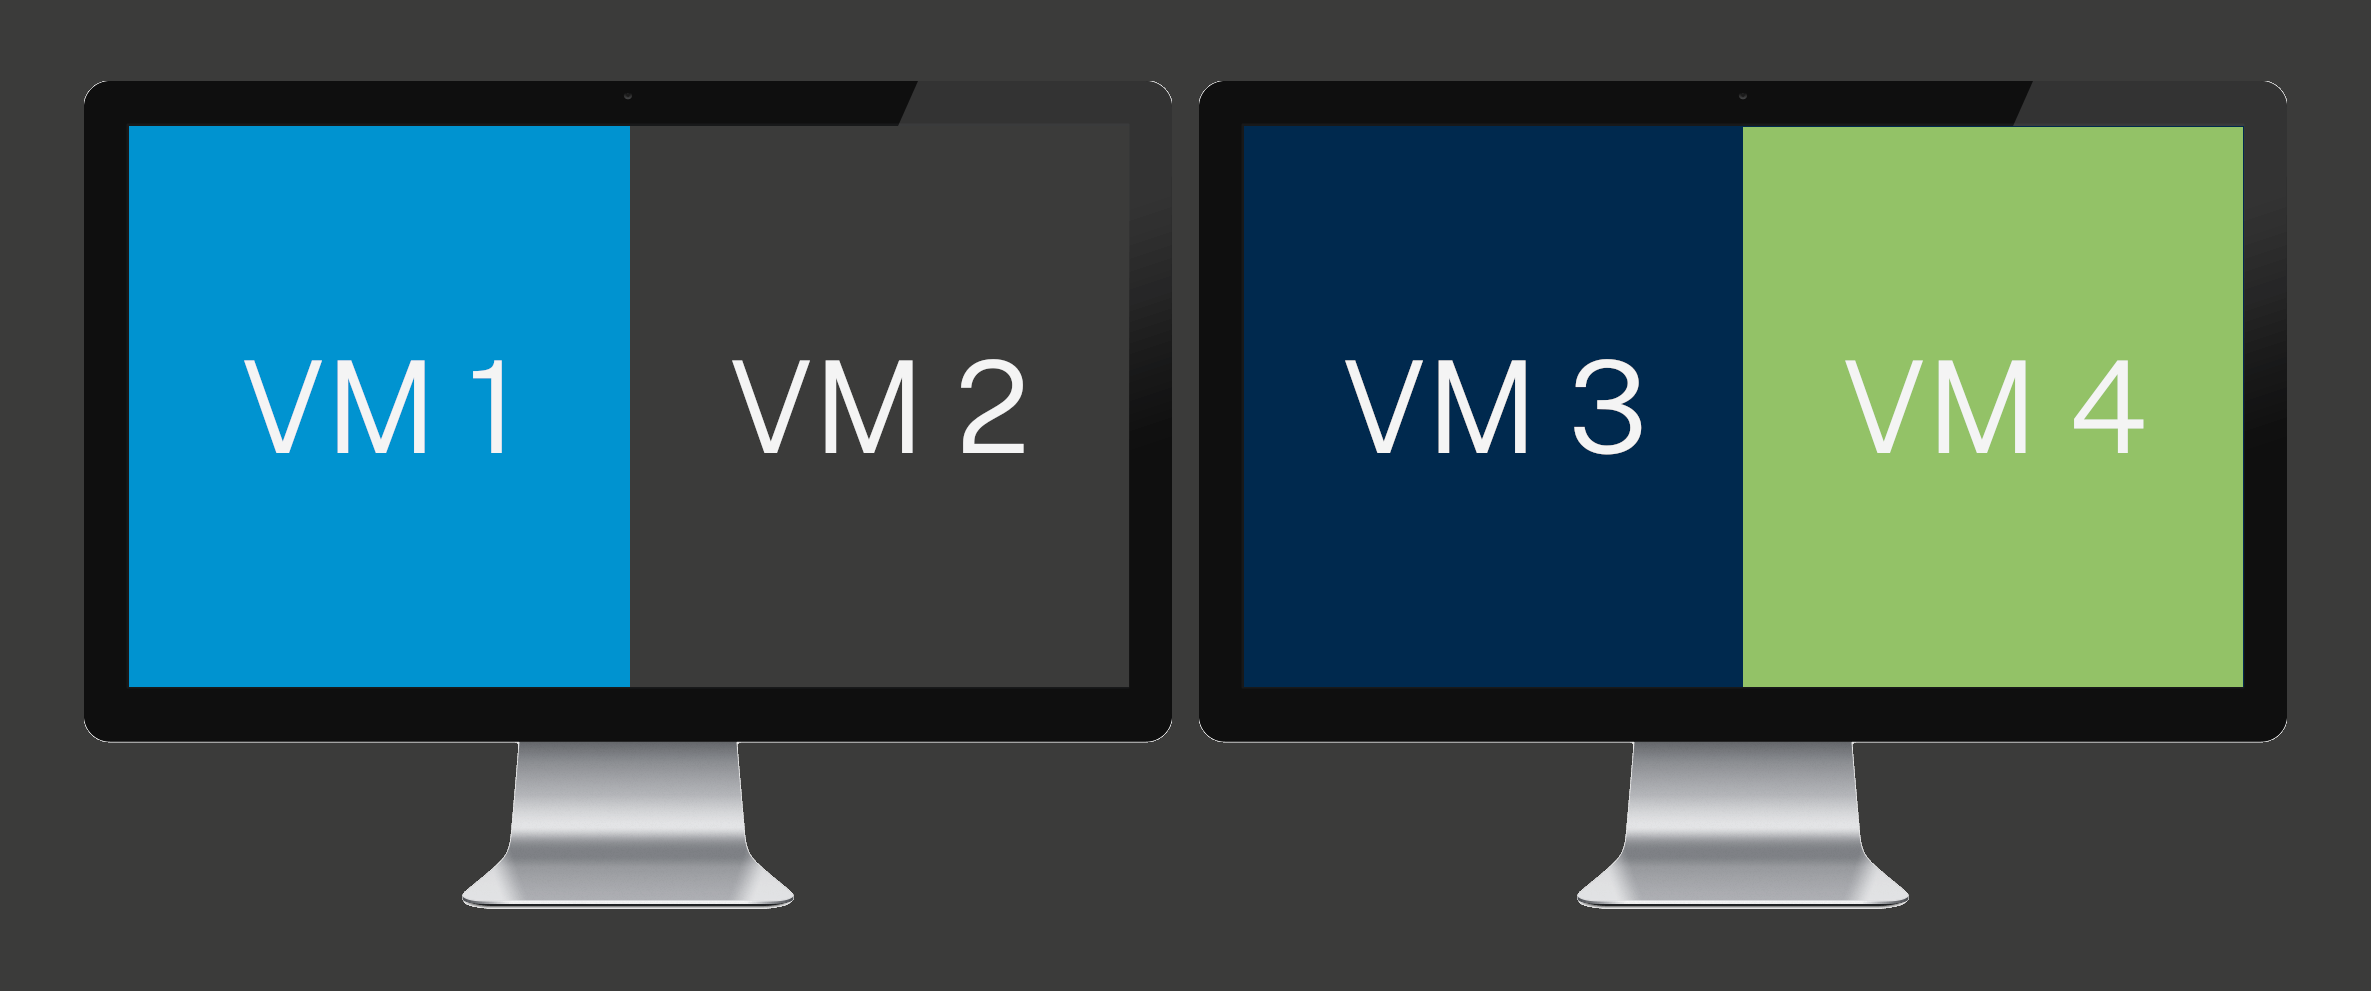
One monitor, multiple virtual machines at once
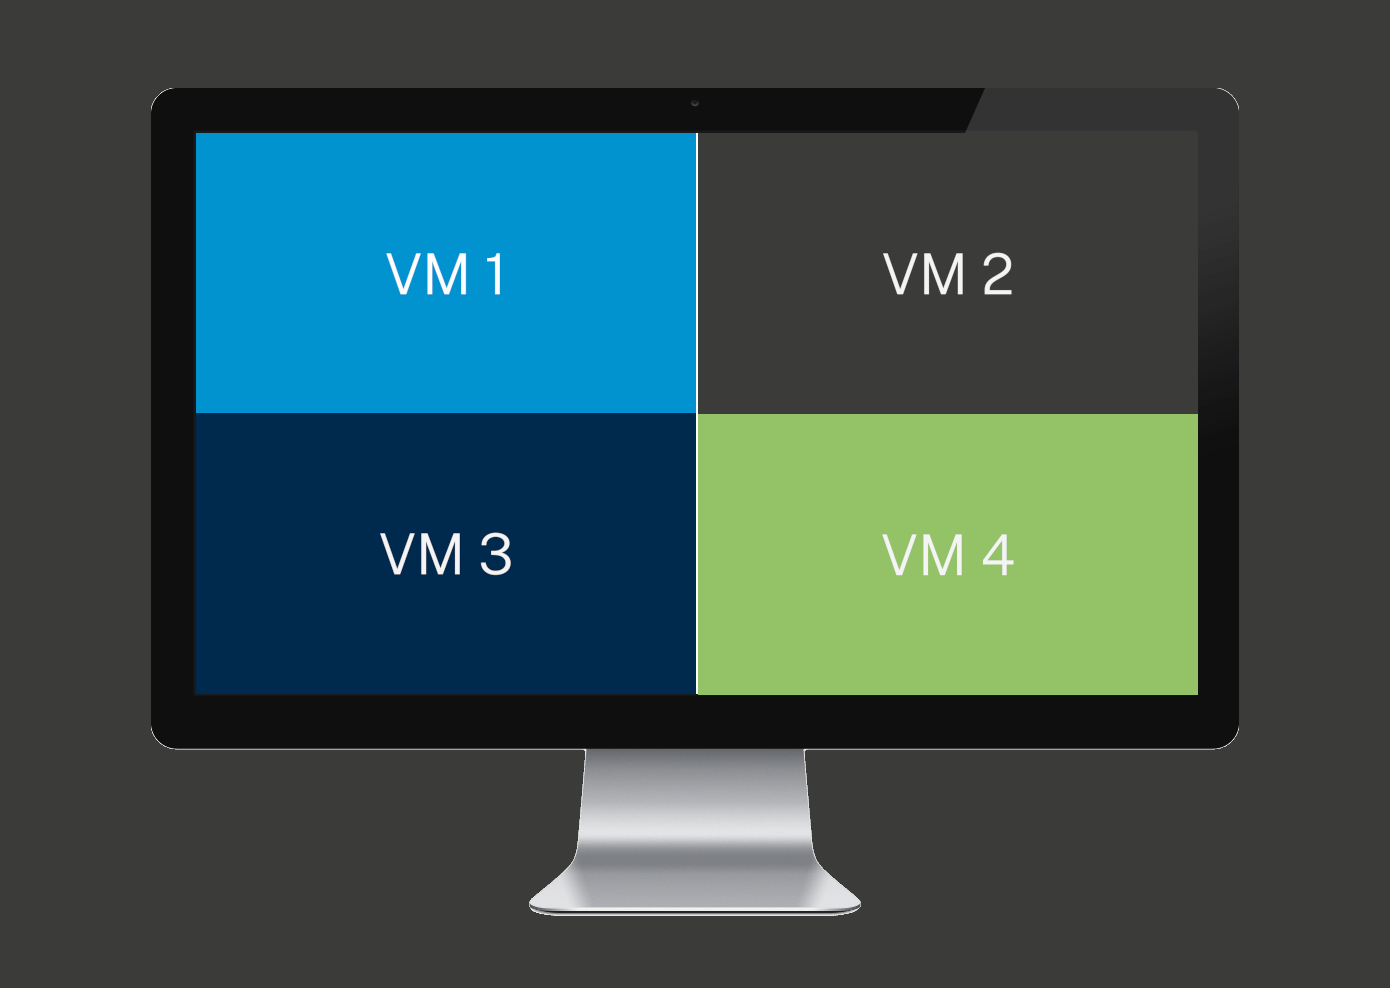
Request grid display mode to use the feature this way. The maximum number of virtual machines that can be displayed is four. Determine the screen position of each VM by changing the display order settings in the VM video options menu in the Management System. All virtual machines can be operated by seamlessly moving the mouse pointer.
Two monitors, two virtual machines
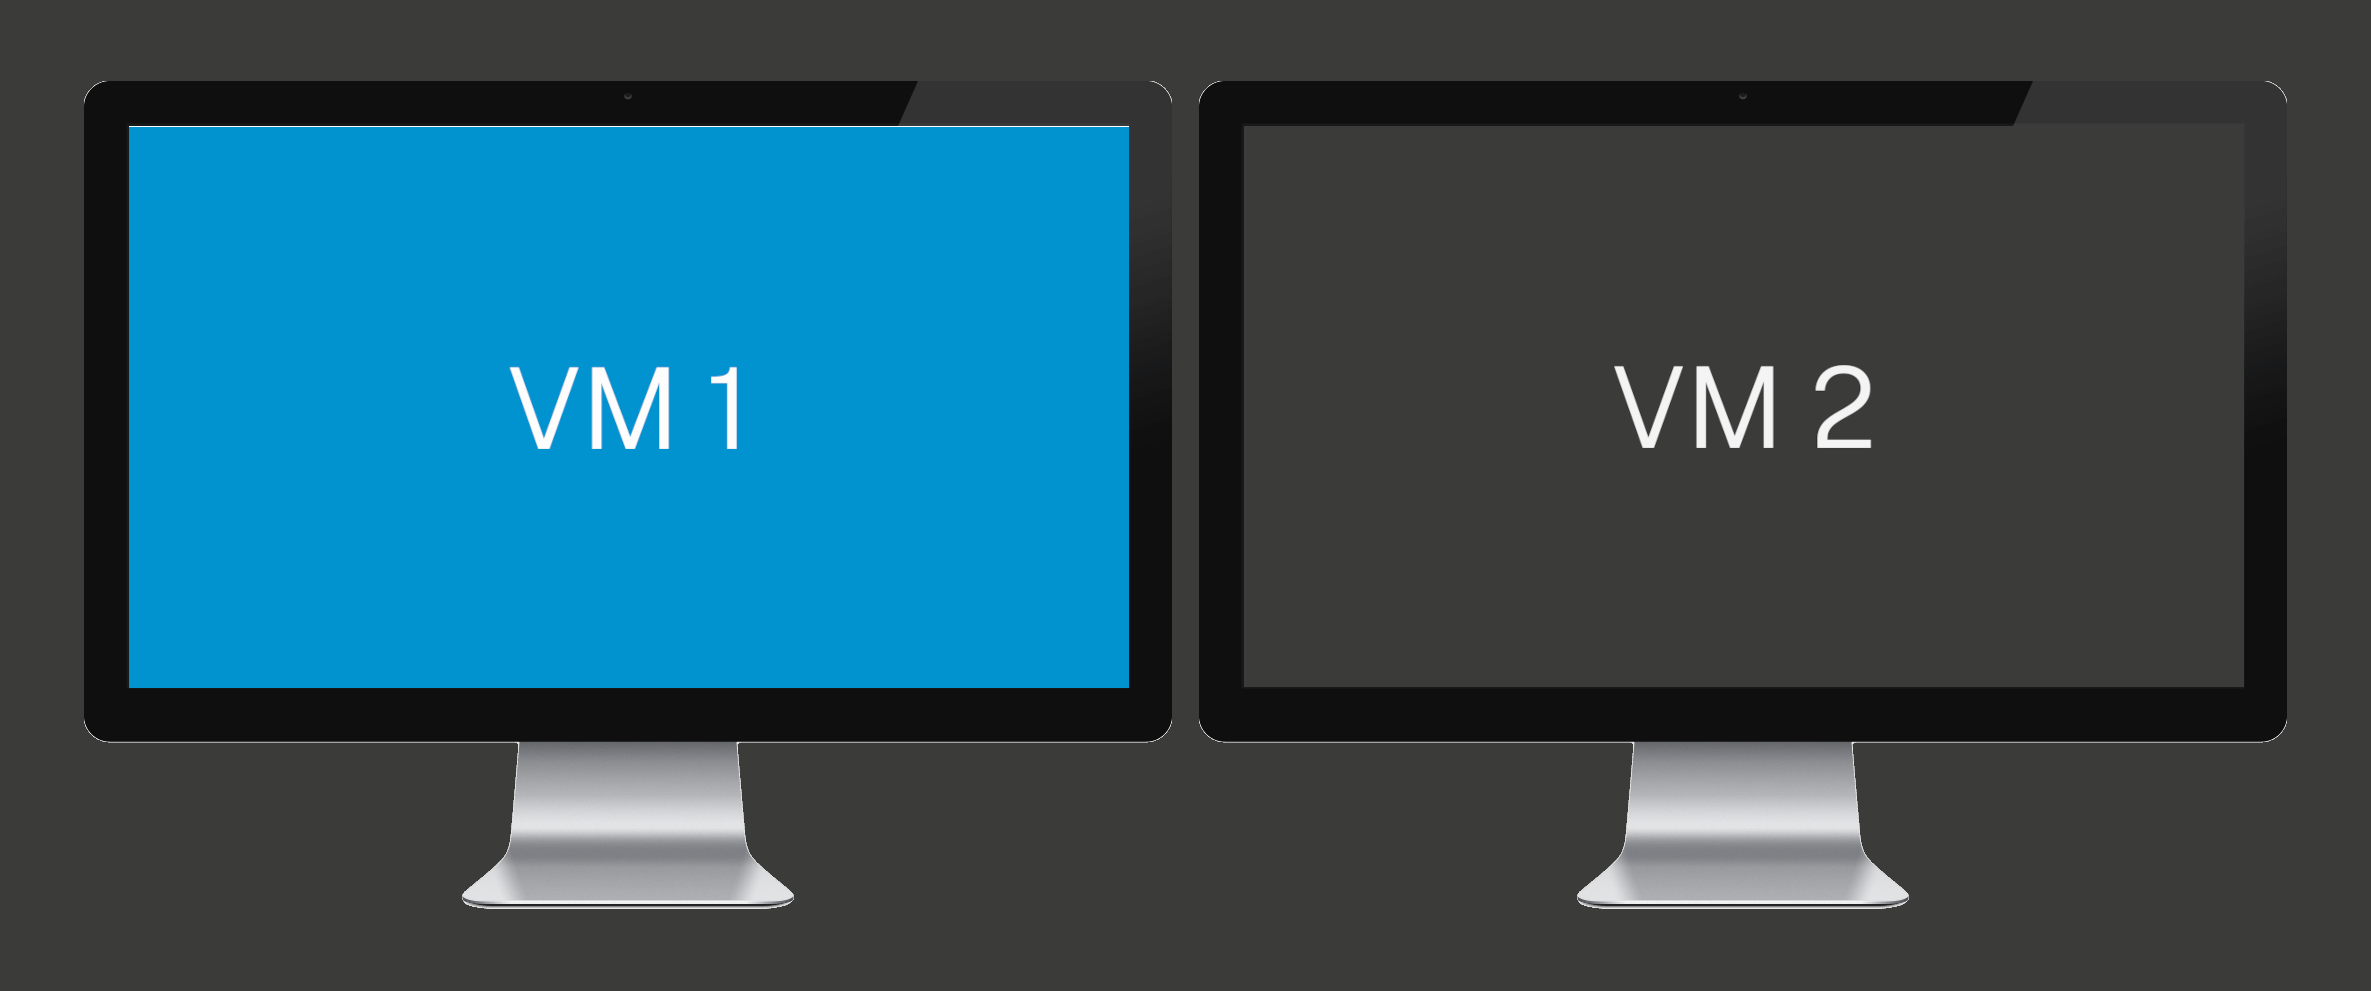
Request regular display mode to use the feature this way. This scenario is only possible with Nerve Devices that have more than one video output. Determine the position of each VM by changing the display order settings in the VM video options menu in the Management System. Both virtual machines can be operated by seamlessly moving the mouse pointer.
Two monitors, multiple virtual machines
Request grid display mode to use the feature this way. This scenario is only possible with Nerve Devices that have more than one video output. Determine the screen position of each VM by changing the display order settings in the VM video options menu in the Management System. All virtual machines can be operated by seamlessly moving the mouse pointer.
Note
Connect a monitor to the Nerve Device before the Nerve Device is powered on. This is to avoid having to reboot the node once the VM video options are activated.
- Make sure the user has the required permission to view the VM video options.
The permission is VM video output configuration. Refer to Editing a role for more information on changing the permissions of a role. - Select Nodes in the navigation on the left.
- Select the node that has VM video options enabled from the node tree.
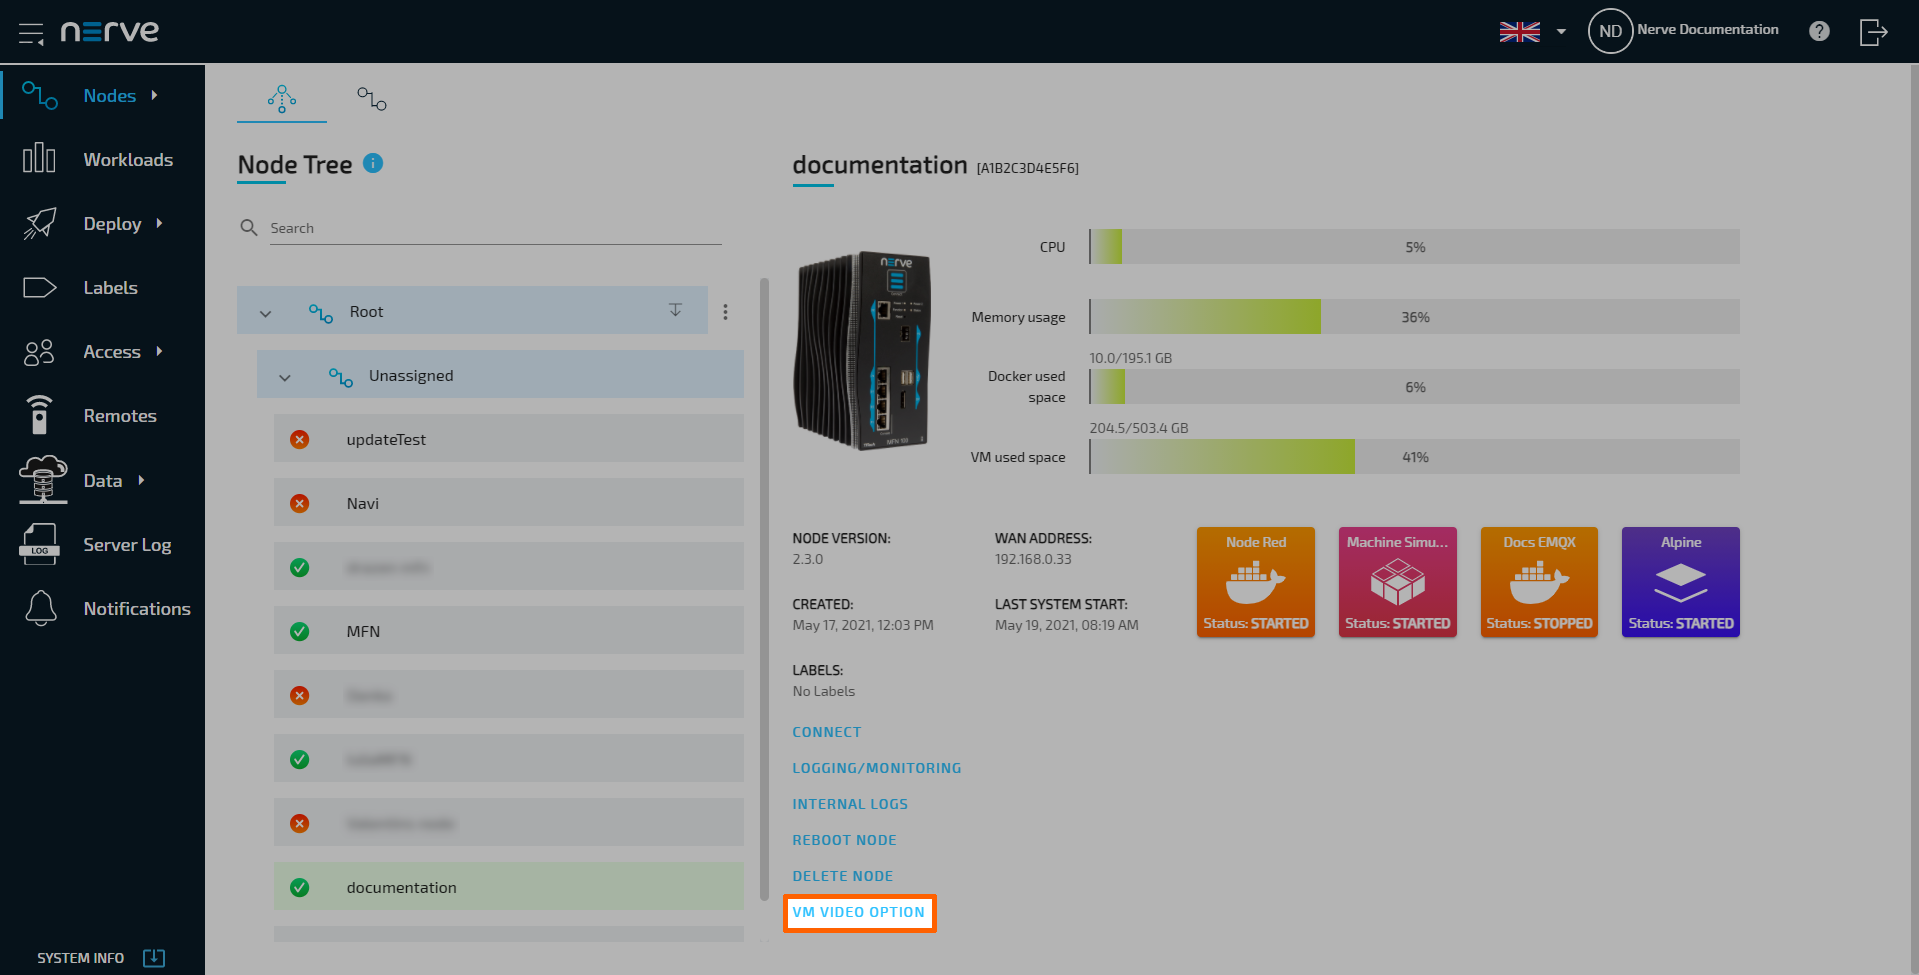
-
Select VM VIDEO OPTION in the node details view.
-
Tick the checkbox next to the VMs that shall have video output at the Nerve Device.
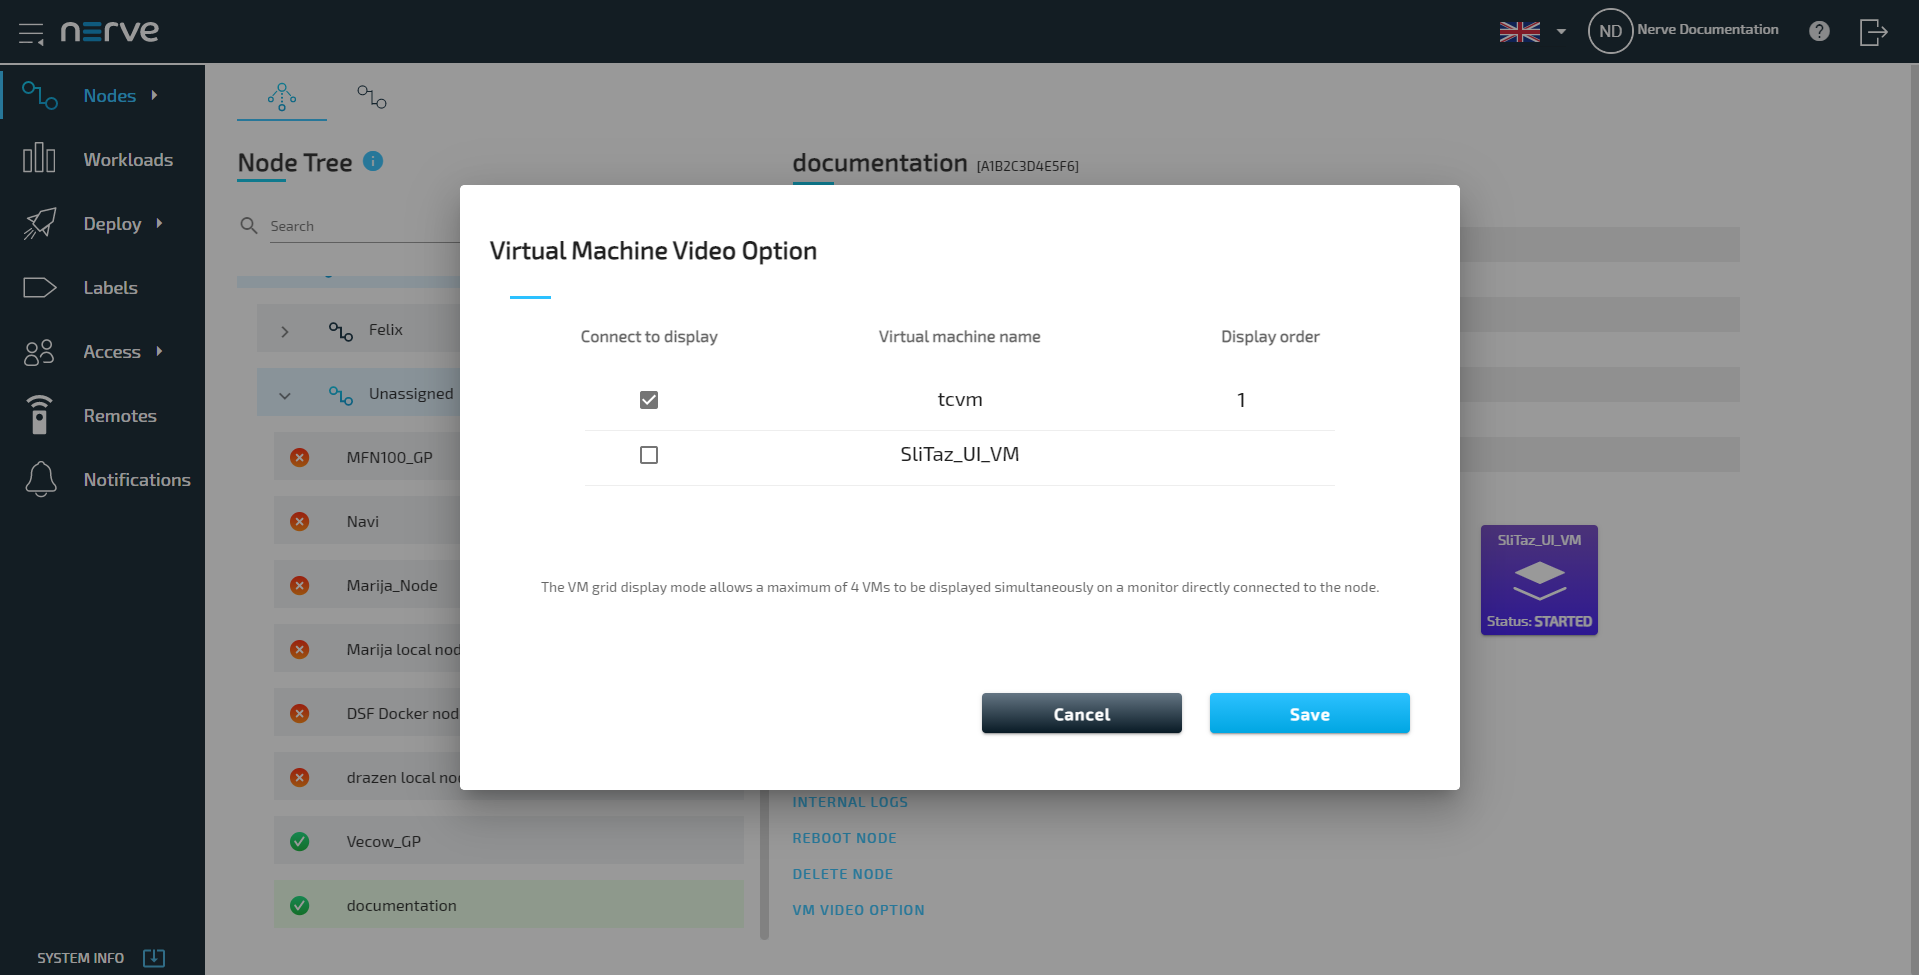
-
Use the arrows under Display order to define in which order the VMs shall be displayed.

-
Select Save.
The selected virtual machine will now be displayed at the video output of the Nerve Device. However, the VM display resolution might need to be adjusted inside of the VM to make the VM fit its portion of the screen. Note that the node needs to be restarted for the video output to be displayed if the node was already running when the monitor was connected. Also note that having video options enabled for a given virtual machine, makes VNC remote connections to that virtual machine not possible.
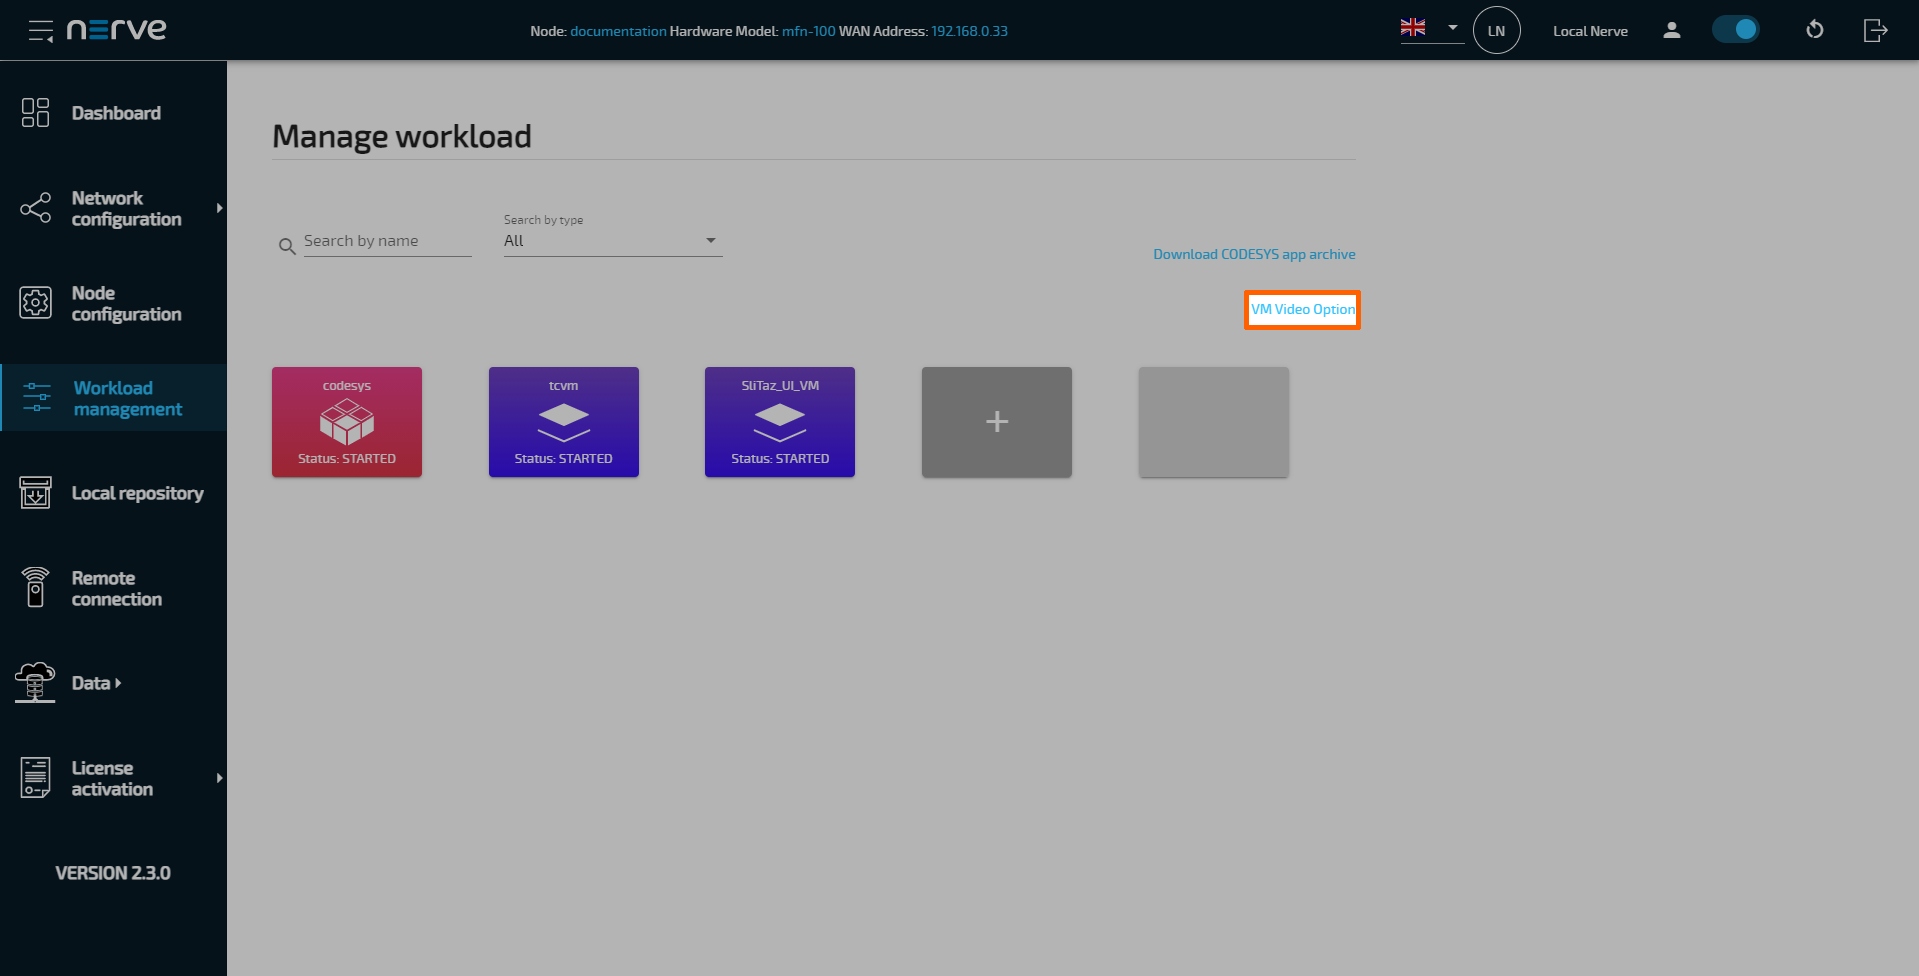
This feature is also available in the Local UI. Select Workload management in the navigation on the left and then select VM Video Option.
Node list
The topics covered in this chapter are mainly means of organization and have no impact on the functionality of the nodes and their workloads. Select Nodes in the navigation on the left. Then select the nodes tab  on the right to display the list of registered nodes.
Note
Operational functions of the nodes are located in the node details view in the node tree.
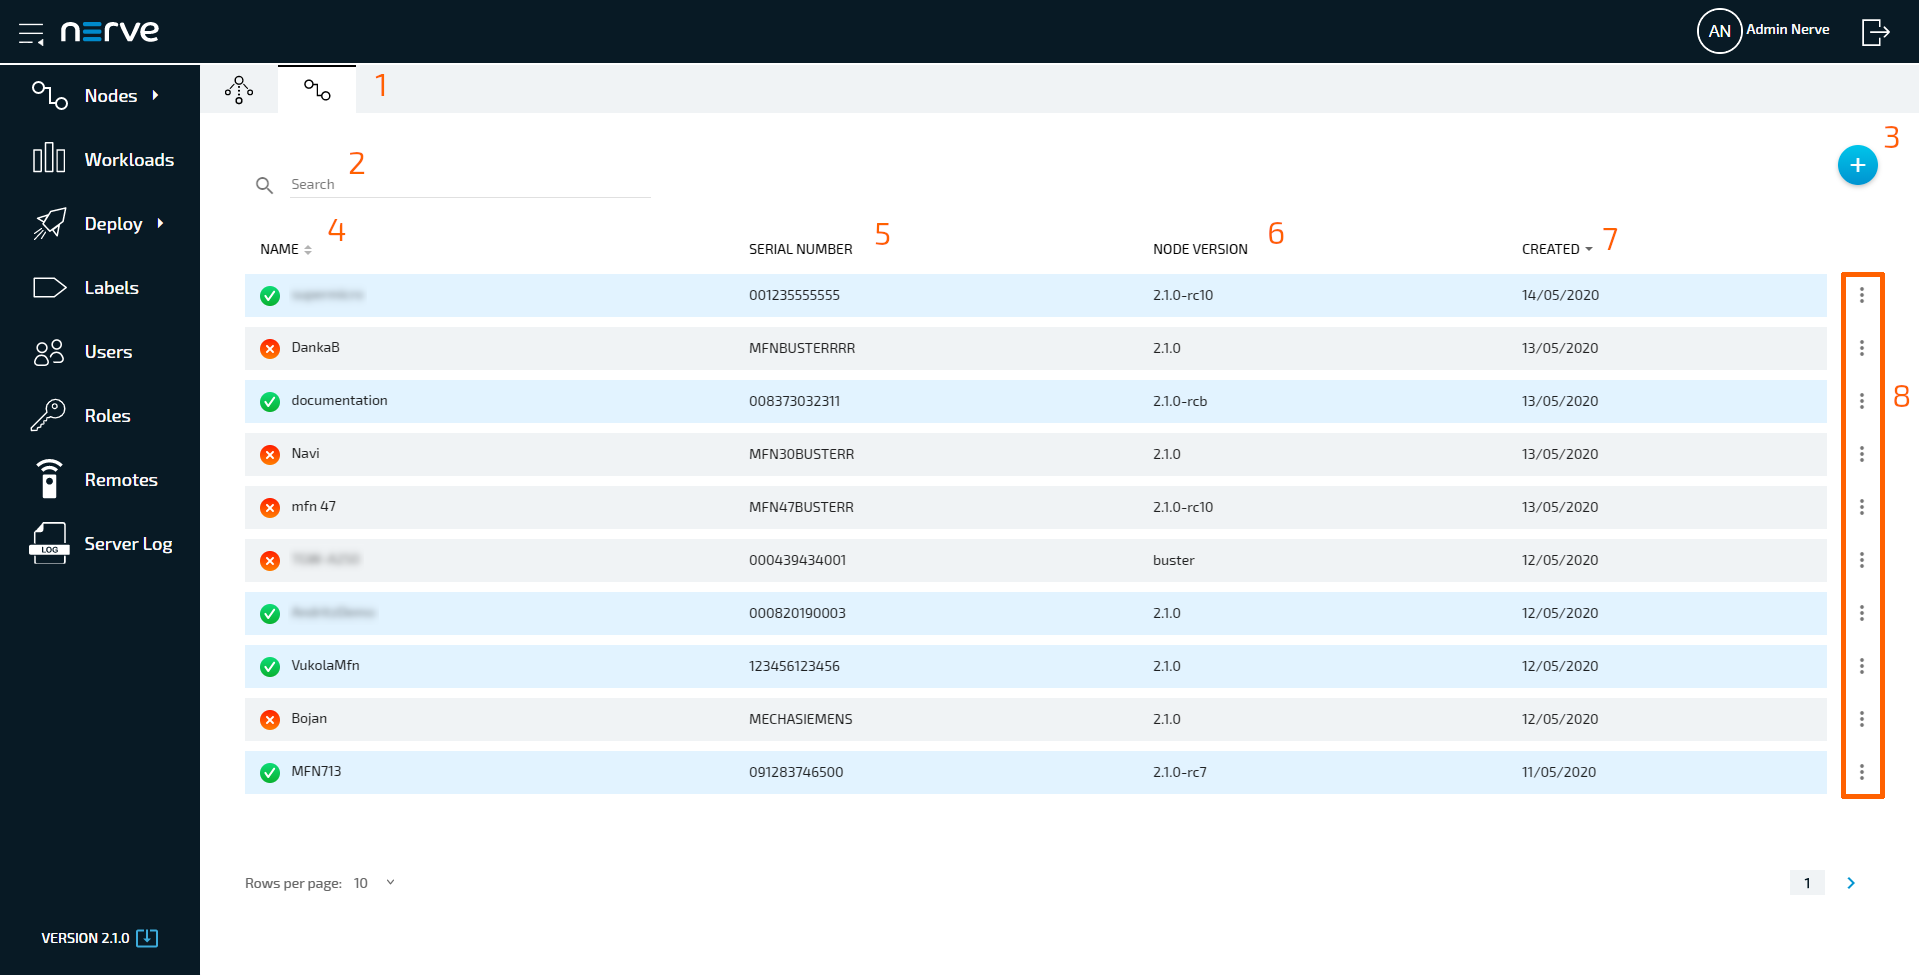
| Item | Description |
|---|---|
| Tab selection (1) | Switch between the node tree and the node list by selecting the appropriate tab. |
| Search bar (2) | Use the search bar to filter nodes by name. |
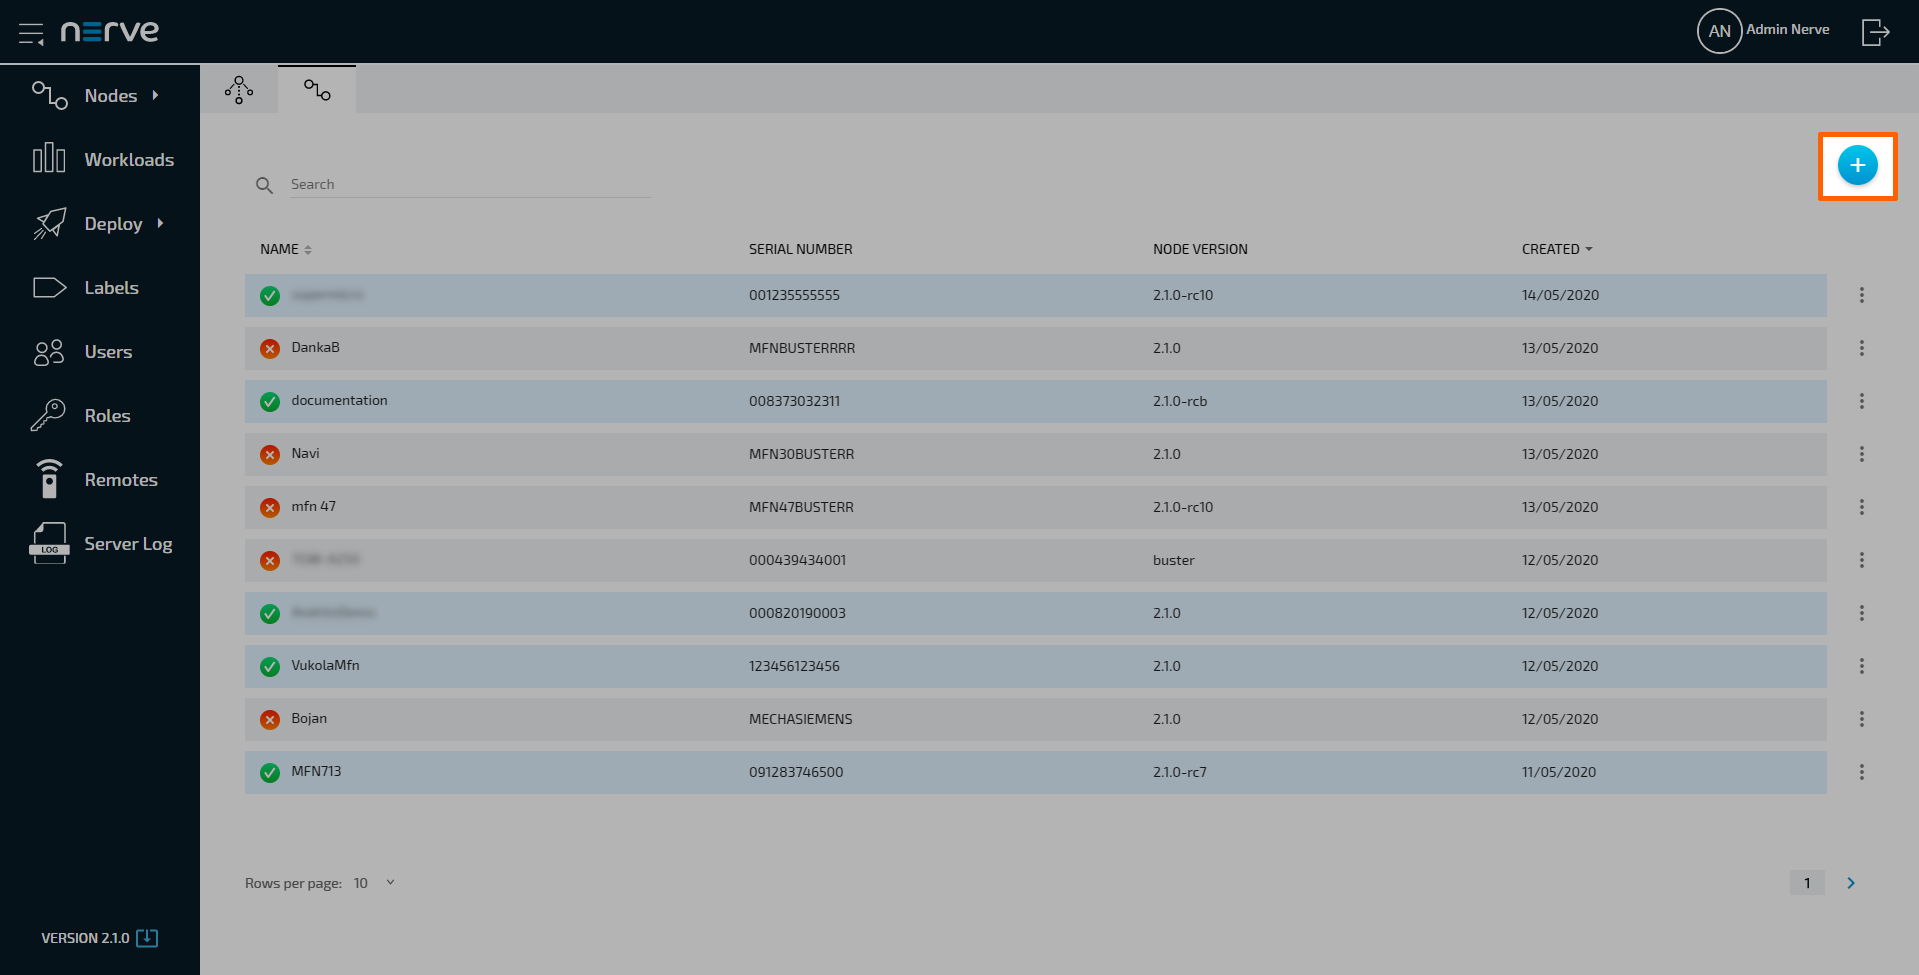
| Add new node (3) | Click here to manually add a new node. |
| NAME (4) | This is the name of the node. If a node is online or offline can be seen to the left of the name. A green check mark indicates an online node while a red cross shows an offline node. The sorting of the list can also be switched from alphabetical to reverse alphabetical by clicking NAME, as well as being sorted by creation date by clicking CREATED. |
| SERIAL NUMBER (5) | This is the serial number of the node that was defined during node configuration. |
| NODE VERSION (6) | This is the version of the node reflecting the version of the Nerve product. |
| CREATED (7) | This is the date the node was registered in the Management System in the format DD/MM/YYYY. The list can be sorted by creation date when clicking CREATED. |
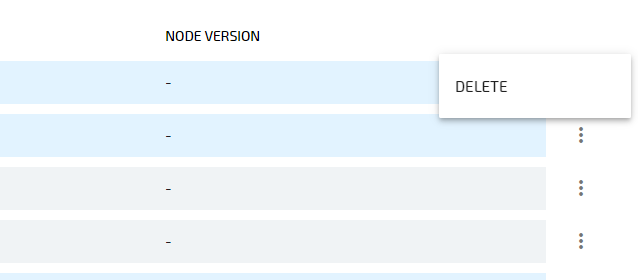
| Ellipsis menu (8) | Clicking here opens an overlay that allows deleting nodes. |
Adding a node
Nodes can only be added to the Management System if they have been configured in the Local UI, as the serial number and secure ID of the node are required. Refer to Node configuration before continuing.
- Select Nodes in the menu on the left side.
- Select the nodes tab on the right to display the list of registered nodes.
-
Select the plus symbol (Add new node) in the upper-right corner.
-
Enter the following information:
Item Description Name Enter the name for the node that will make it easy to identify. Secure ID Enter the secure ID that is generated when the node is configured in the Local UI. Refer to Node configuration for more information. Serial no. Enter the serial number of the Nerve Device that was defined during node configuration. Insert Label This field is optional. Add labels to the node for easier identification and workload deployment. Note that labels have to be created first before they can be assigned to nodes. Refer to Labels for more information. Nerve Device name Select the Nerve Device, on which the node is hosted from the drop-down menu. The name is set to MFN 100 by default. A picture of the selected Nerve Device will be displayed in the node details.
Refer to the device guide for more information on qualified Nerve Devices. -
Click Save to save the changes.
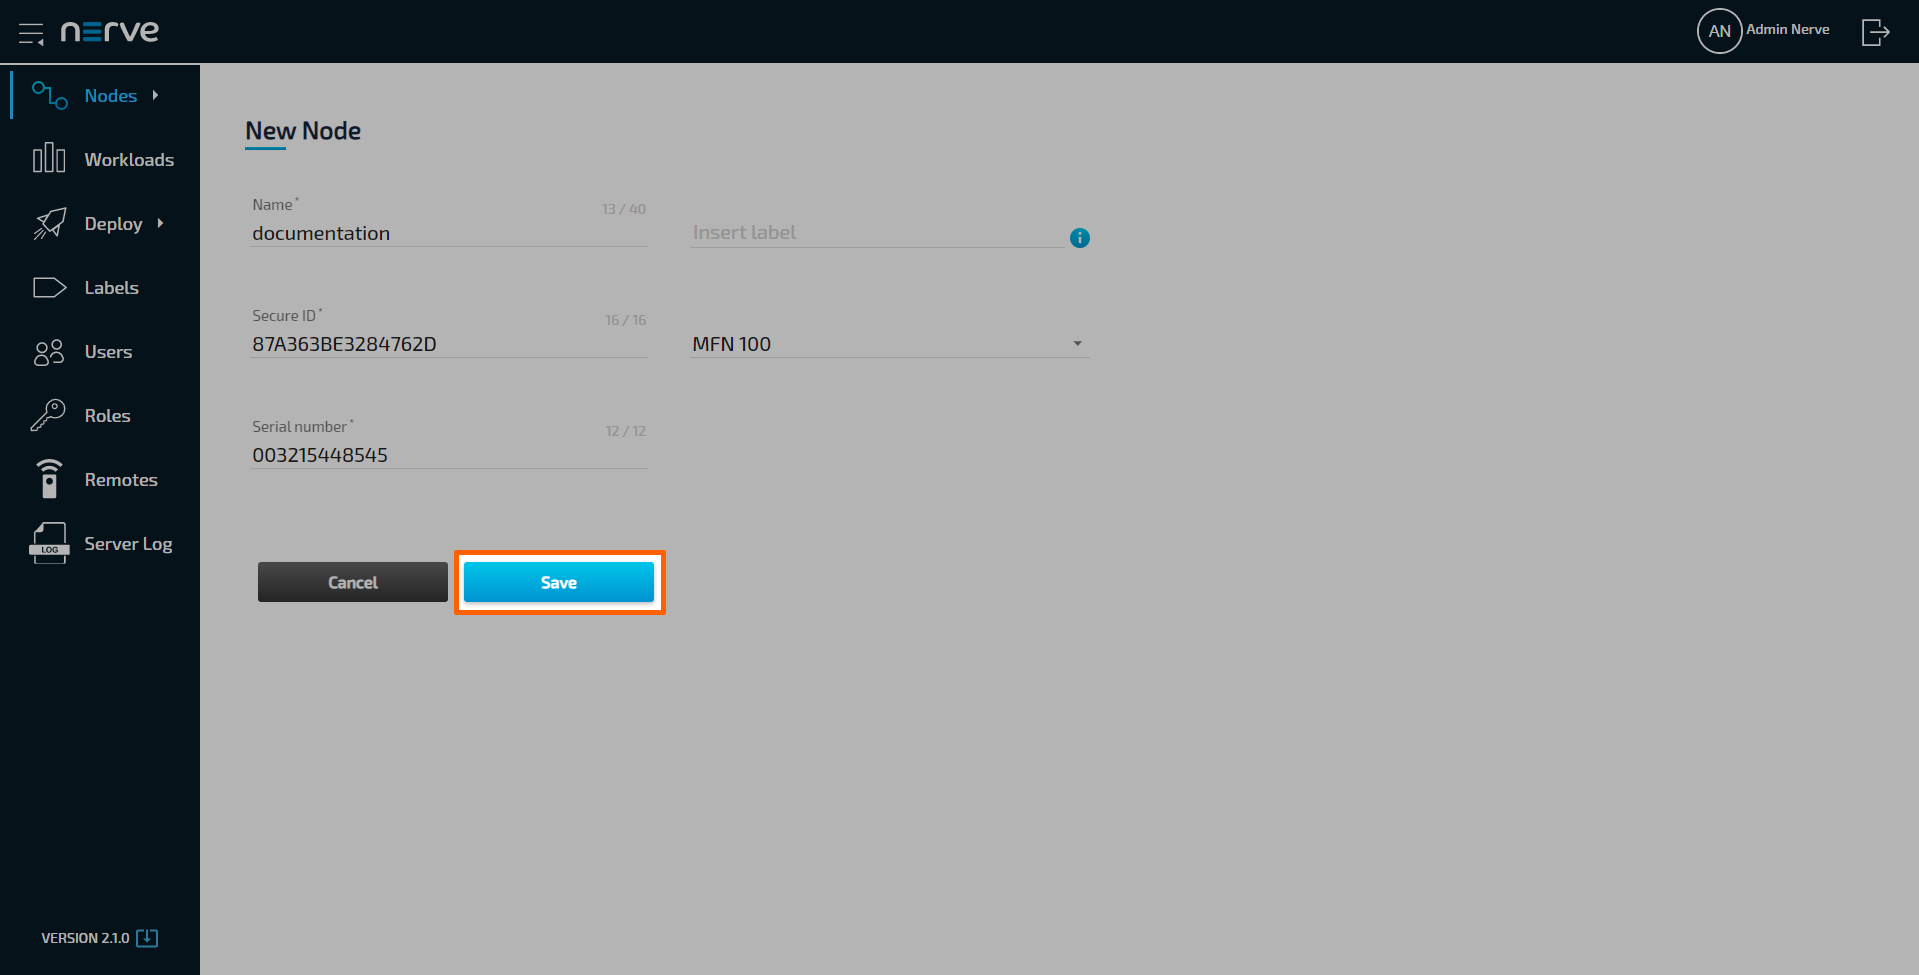
The node now appears in the node list and in Root > Unassigned in the node tree and can be worked with. Refer to the user guide for information on how to continue.
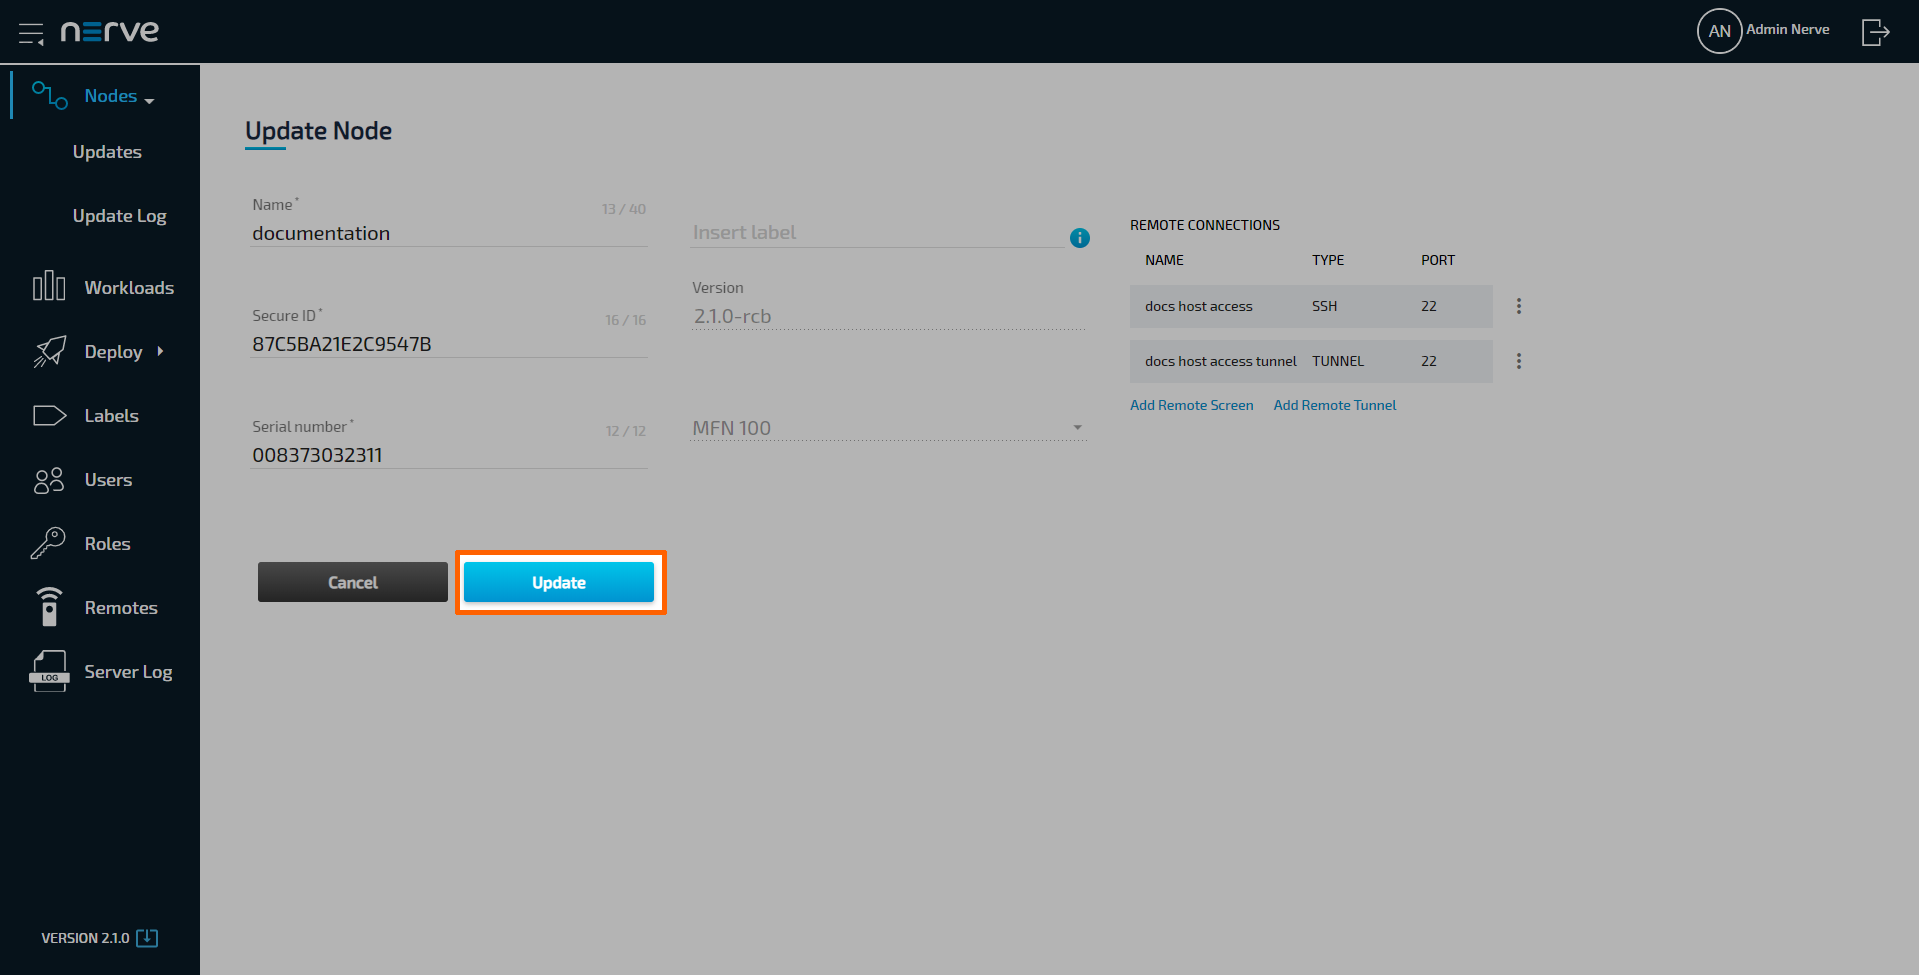
Editing the details of nodes
After registering a node, edit its details in the Nodes menu. Use the search bar at the top to search for nodes if a large number of nodes is registered.
- Select Nodes in the left-hand menu.
- Select the nodes tab on the right to display the list of registered nodes.
- Click a node from the list.
-
Edit the details of the node:
Item Description Name Enter the name of the node. Secure ID This is the ID generated during the node registration process. Do not edit this ID without a valid reason. Serial number This is the serial number of the node. Do not edit the serial number without a valid reason. Insert label This field is optional. Add labels to the node for easier identification and workload deployment. Refer to Labels for more information. Version This is the node version. This field cannot be edited. Device type This is the device the node is hosted on. This field cannot be edited. REMOTE CONNECTIONS This is a list of remote connections to the node stating the NAME, TYPE, and PORT of available remote connections. Add or delete remote connections here. Refer to Remote Connections for more information. Note
Changing the Secure ID or Serial no. of a node will break the connection between the node and the Management System.
-
Click Update to save the changes.
Updating a node to a new version
Nodes are updated through the Management System where currently available updates are listed. Note that nodes can only be updated in order, meaning that node versions cannot be skipped. When an update is started, a snapshot of the user data is made and running workloads are stopped. Reverting to the previous version is possible. Workloads remain stopped after an update or revert.
Note
- By updating a node, the passwords to the Local UI and host access are reset if they have not been changed by the user. Local UI and host access passwords set by the user persist through updates.
- Note that the update process described here is valid for nodes from version 2.1.0 and later. Nodes below version 2.1.0 need to be updated manually. Refer to Updating Nerve from version 2.0 to 2.1 for more information.
- Expand Nodes > Updates in the navigation on the left.
-
Select a node version from the list. Available nodes for the update to the selected version will appear on the right.
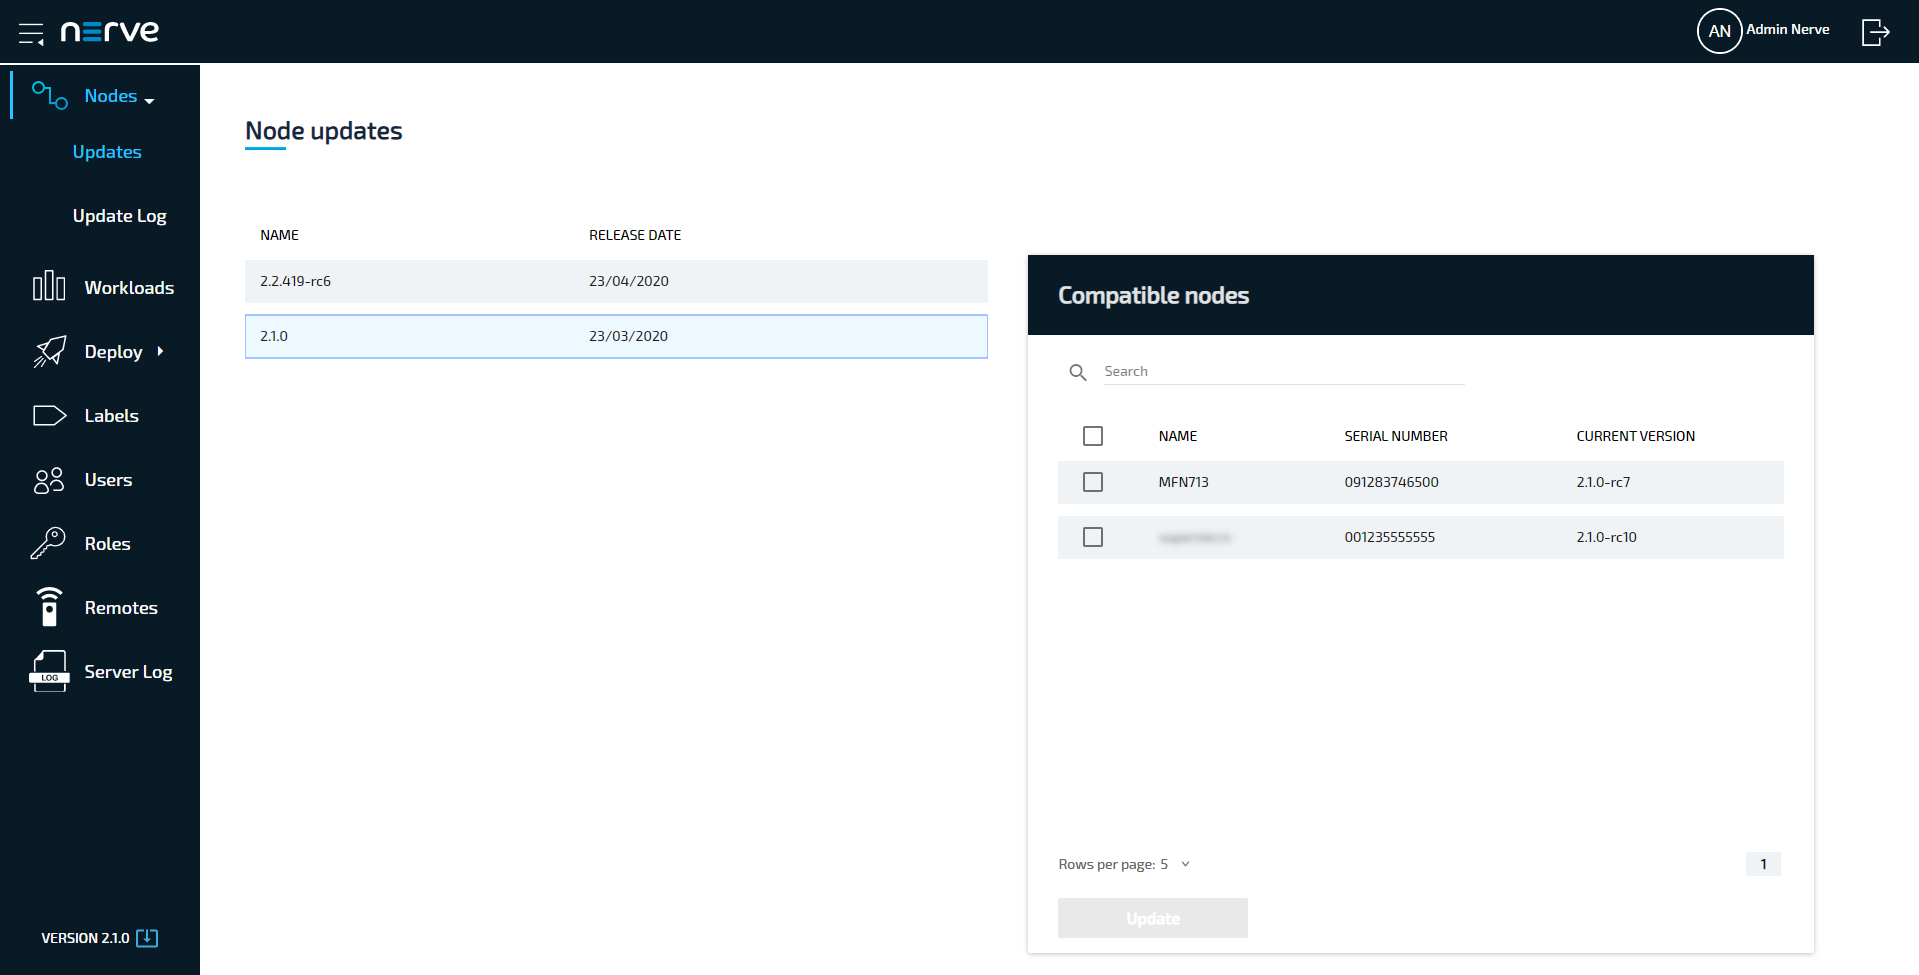
-
Tick the checkboxes next to the nodes that will be updated.
-
Select Update.
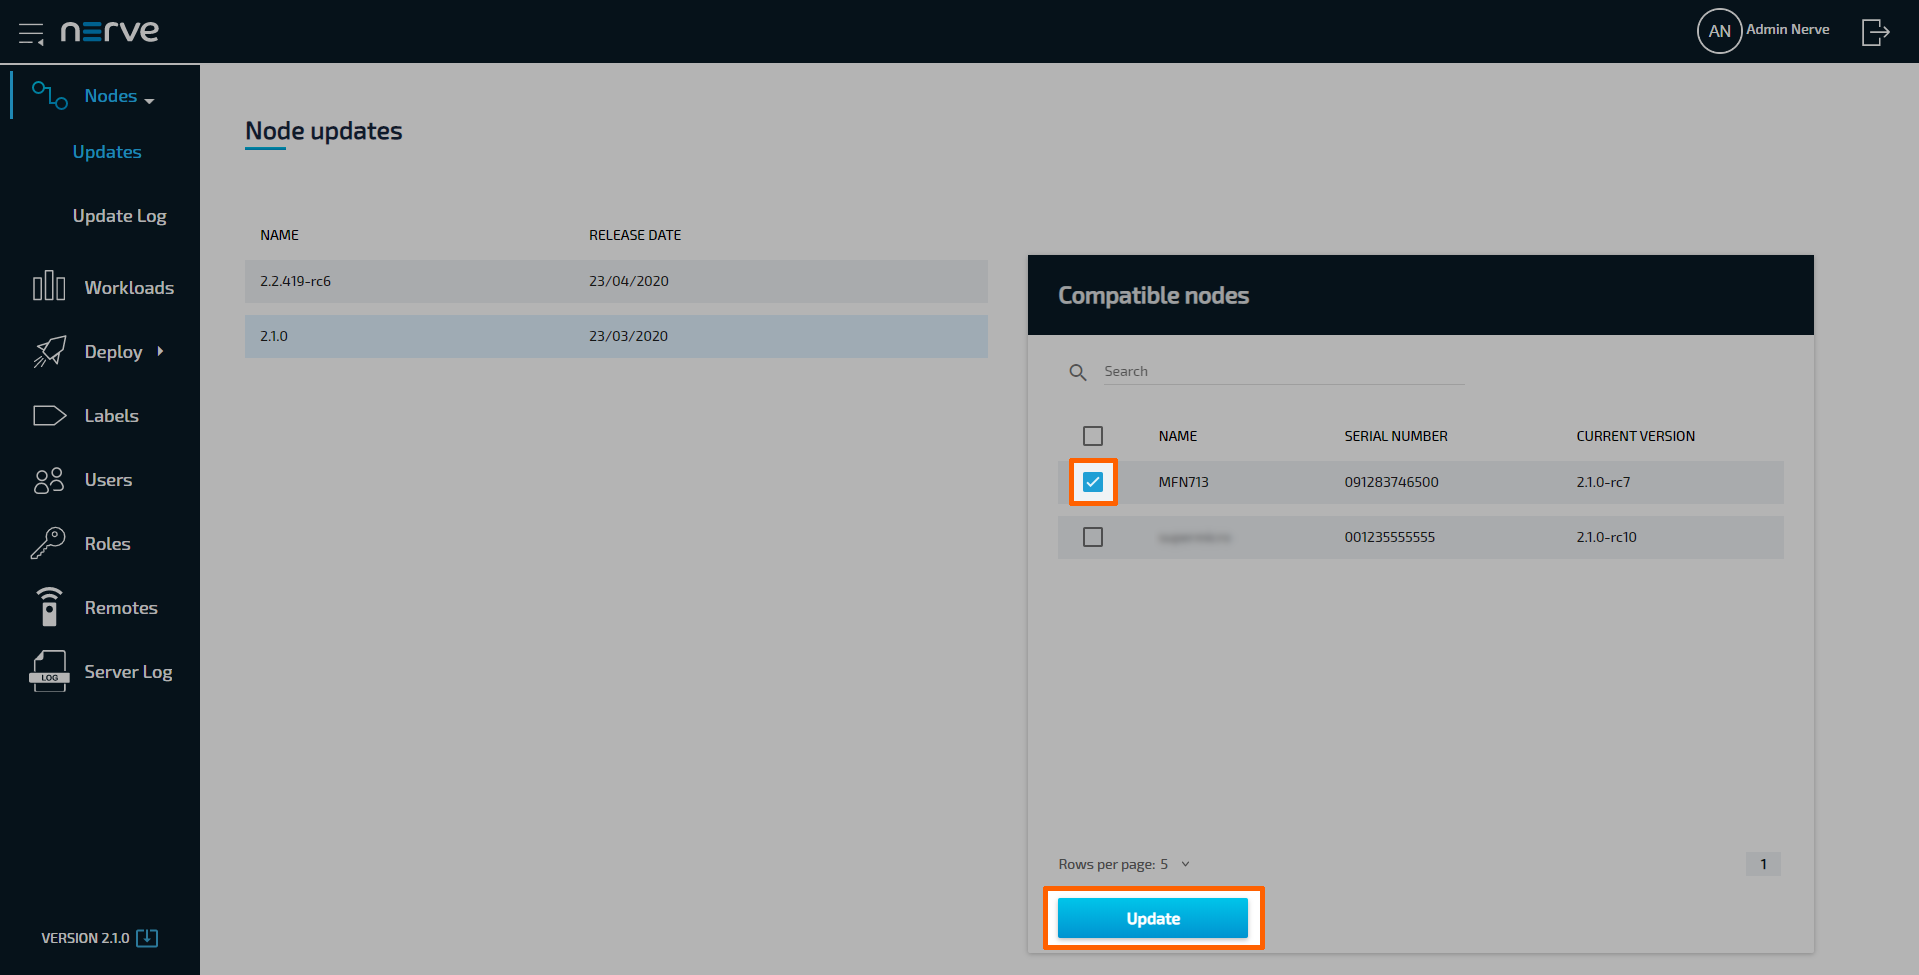
-
Select YES in the pop-up window.
The Management System will display the log screen where the update is shown as in progress. The progress bar here shows the progress of the entire update campaign if more than one node has been selected before. Click the progress bar to see the progress of the update to each node.
Removing a node
Note that generally there is no need in removing a node. Only remove a node in case of technical difficulties or by request of customer support. To remove a node, select DELETE in the ellipsis menu on the right side of a node in the node list.