Logging and monitoring
Data is gathered for Docker workloads and system parameters regarding resource usage. Metrics are then sent to OpenSearch in the Management System and visualized in OpenSearch Dashboard. Logging and monitoring options can be configured for each node in the node details screen in the Management System:
- Log in to the Management System.
- Select Nodes in the navigation on the left.
- Select the node tree tab.
- Select a node in the node tree.
-
Select LOGS AND METRICS.
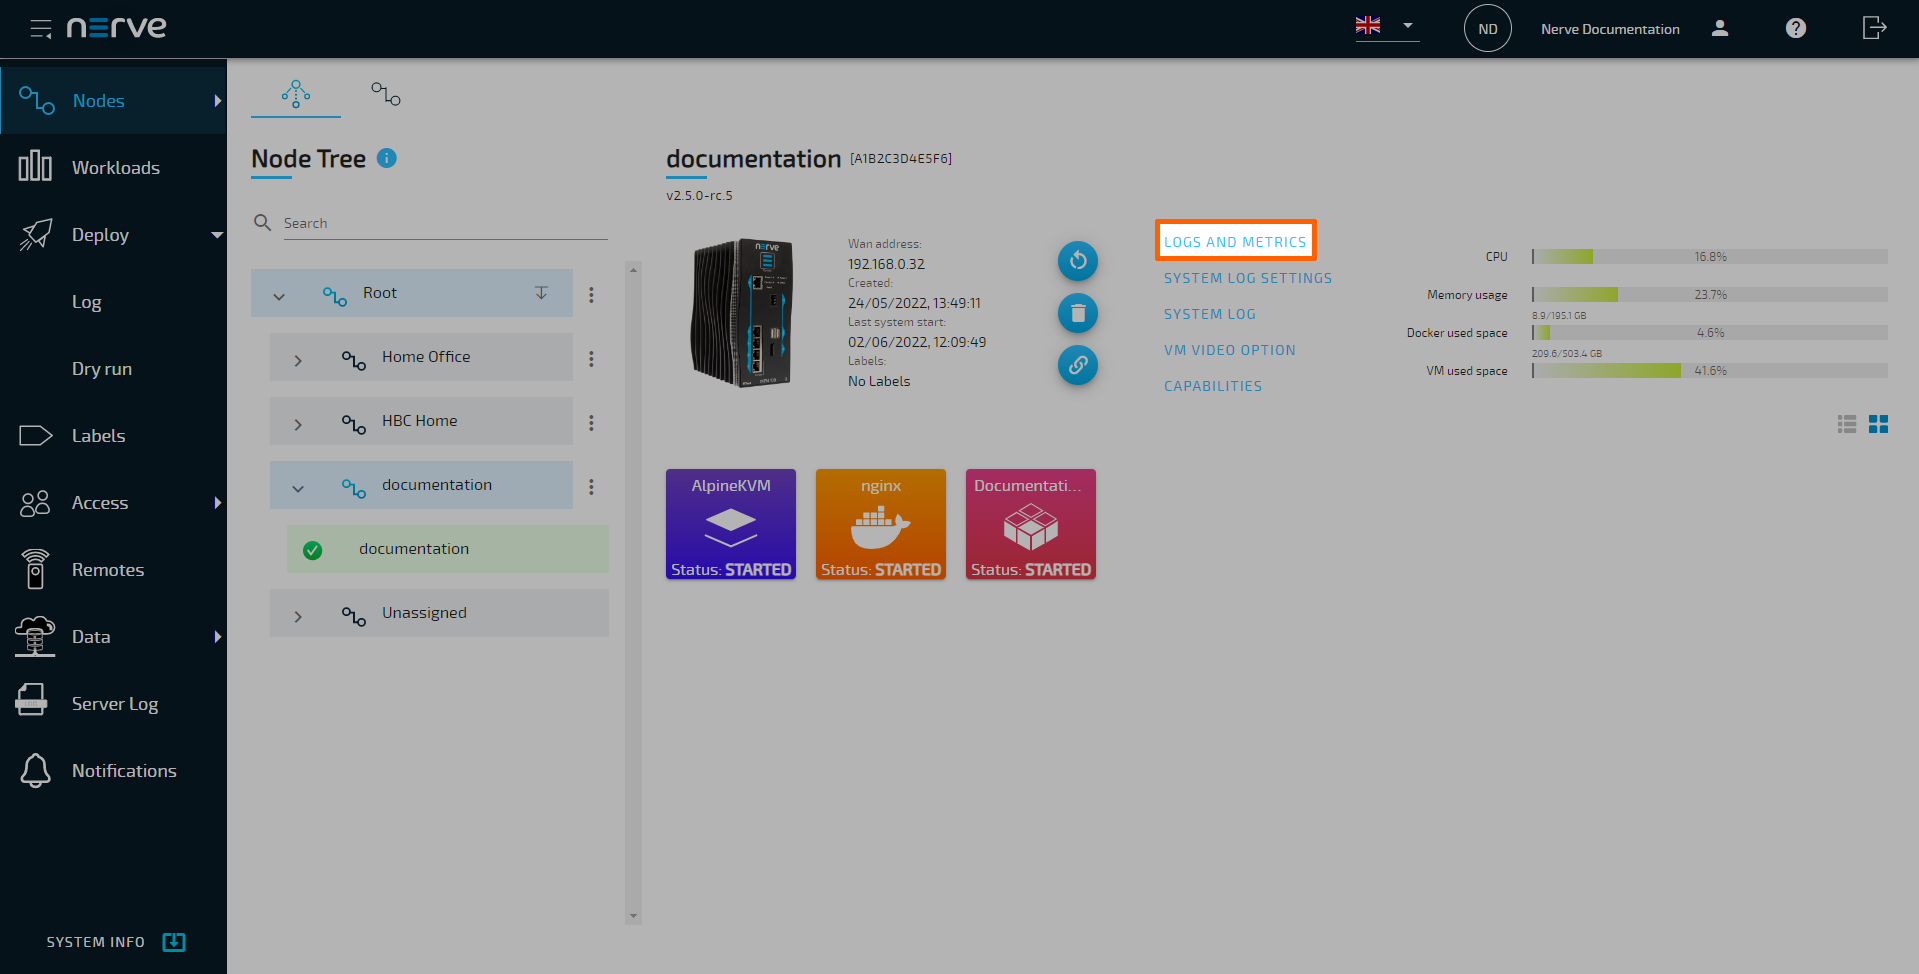
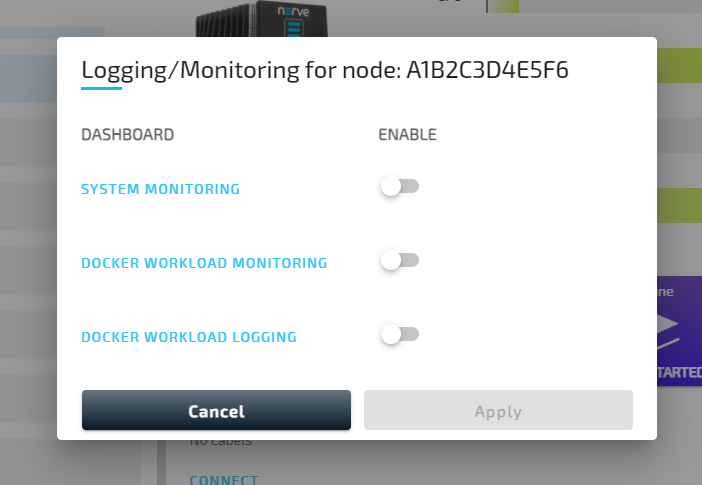
From here, toggle the corresponding slider of a dashboard on the right and select Apply to enable logging or monitoring on that node. The dashboards can be accessed by selecting the dashboard name on the left. A new browser tab opens, displaying the selected dashboard. Note that all dashboards are also available if the node is offline.
Note
Some OpenSearch knowledge could be beneficial when working with the dashboards. Refer to the official OpenSearch documentation for more information on OpenSearch.
System monitoring
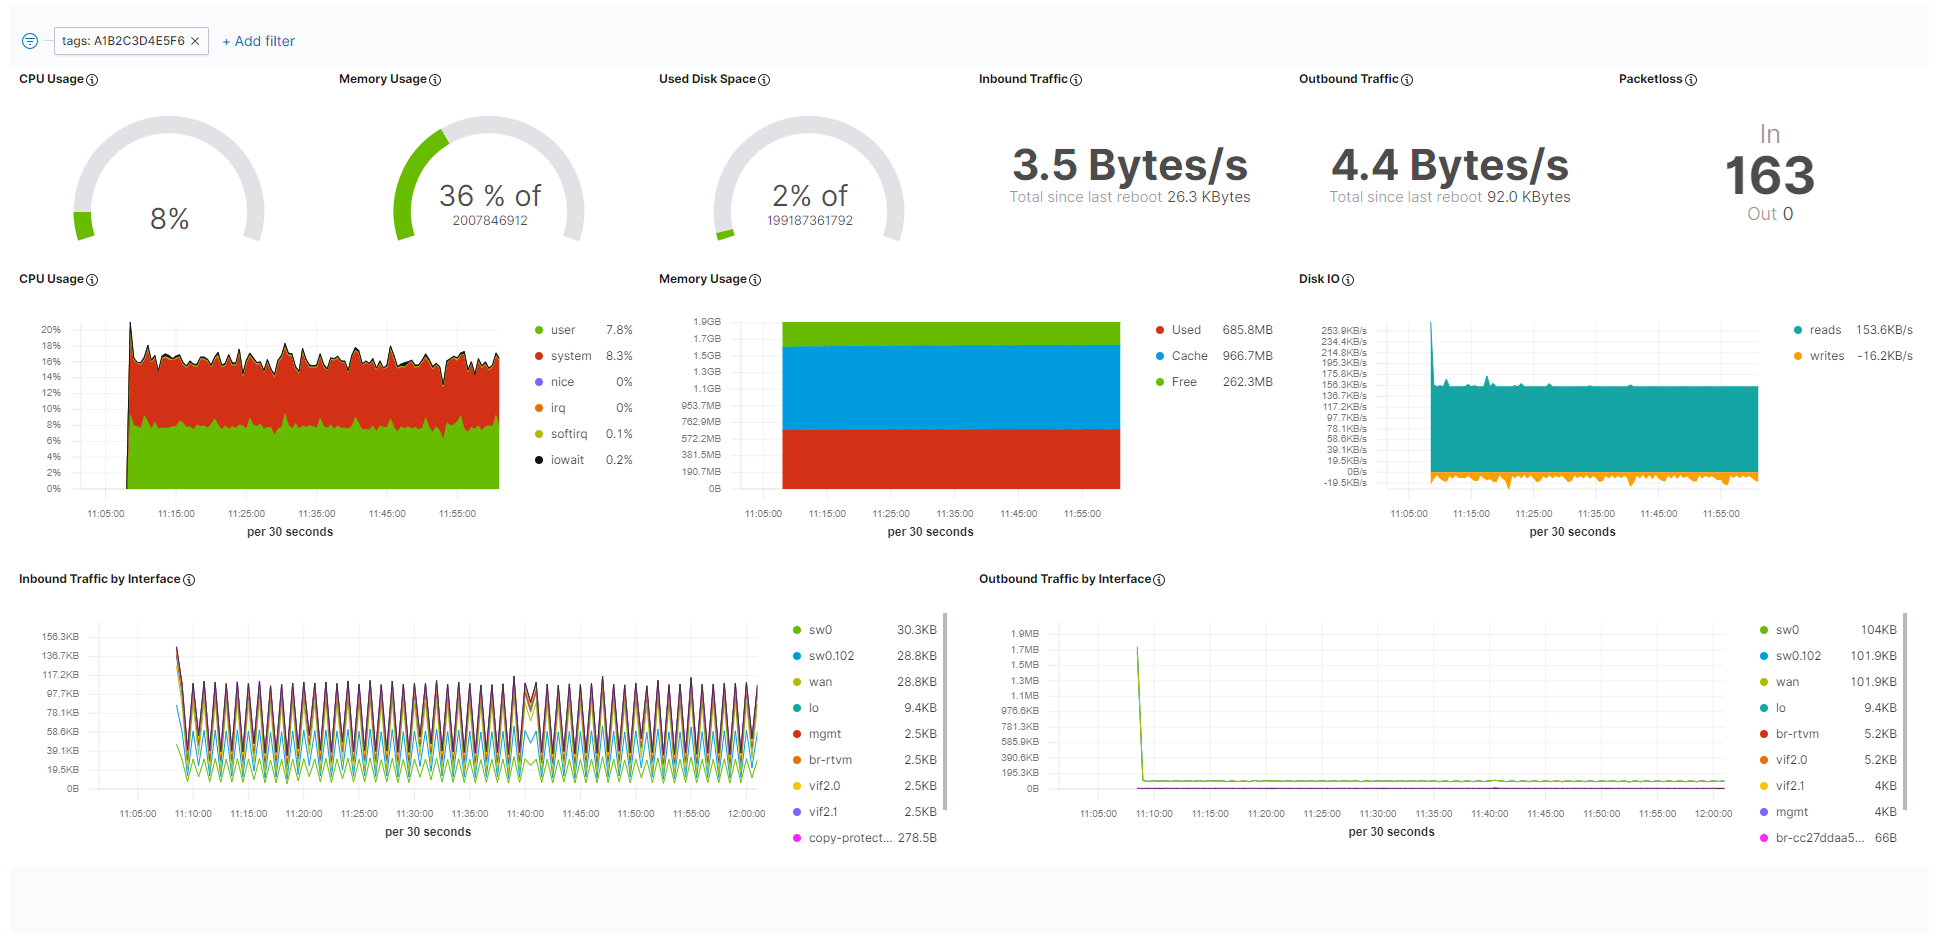
Resource utilization of the system as a whole is tracked when system monitoring is enabled. Refer to the screenshot and the table below for more information on the data that is gathered and displayed. Toggle the SYSTEM MONITORING slider to enable the tracking of system data.
| Item | Description |
|---|---|
| CPU Usage | Gauge chart This chart displays the currently used total percentage of the CPU. Line graph The line graph displays the CPU usage in percent over time. Data is displayed scaled over time. In general, the data displayed here is according to how CPU usage is understood in Linux. For an explanation on how CPU usage is handled in Linux, refer to this link. |
| Memory Usage | Gauge chart This chart displays the currently used total percentage of memory, as well as the total memory available in byte. Memory used for virtualization is not included. Line graph The line graph displays the total amount of memory used over time. Data is displayed scaled over time. Memory used for virtualization is not included. |
| Used Disk Space | This graph displays the currently used total percentage of disk space on the host, as well as the total disk space available in byte. |
| Inbound Traffic | This is the current amount of incoming data, as well as the total amount of data transferred since the last reboot. |
| Outbound Traffic | This is the current amount of outgoing data, as well as the total amount of data transferred since the last reboot. |
| Packetloss | Here the number of lost incoming packets and lost outgoing packets is displayed. |
| Disk IO | This graph displays the amount of reads and writes on the disk. Reads show how much data per second has been read while writes show the amount of data that has been saved or deleted. |
| Inbound Traffic by Interface | This is the amount of incoming data over time. The list to the right of the graph shows the average amount of traffic per interface. Note that this list also includes internal interfaces in this version. |
| Outbound Traffic by Interface | This is the amount of outgoing data over time. The list to the right of the graph shows the average amount of traffic per interface. Note that this list also includes internal interfaces in this version. |
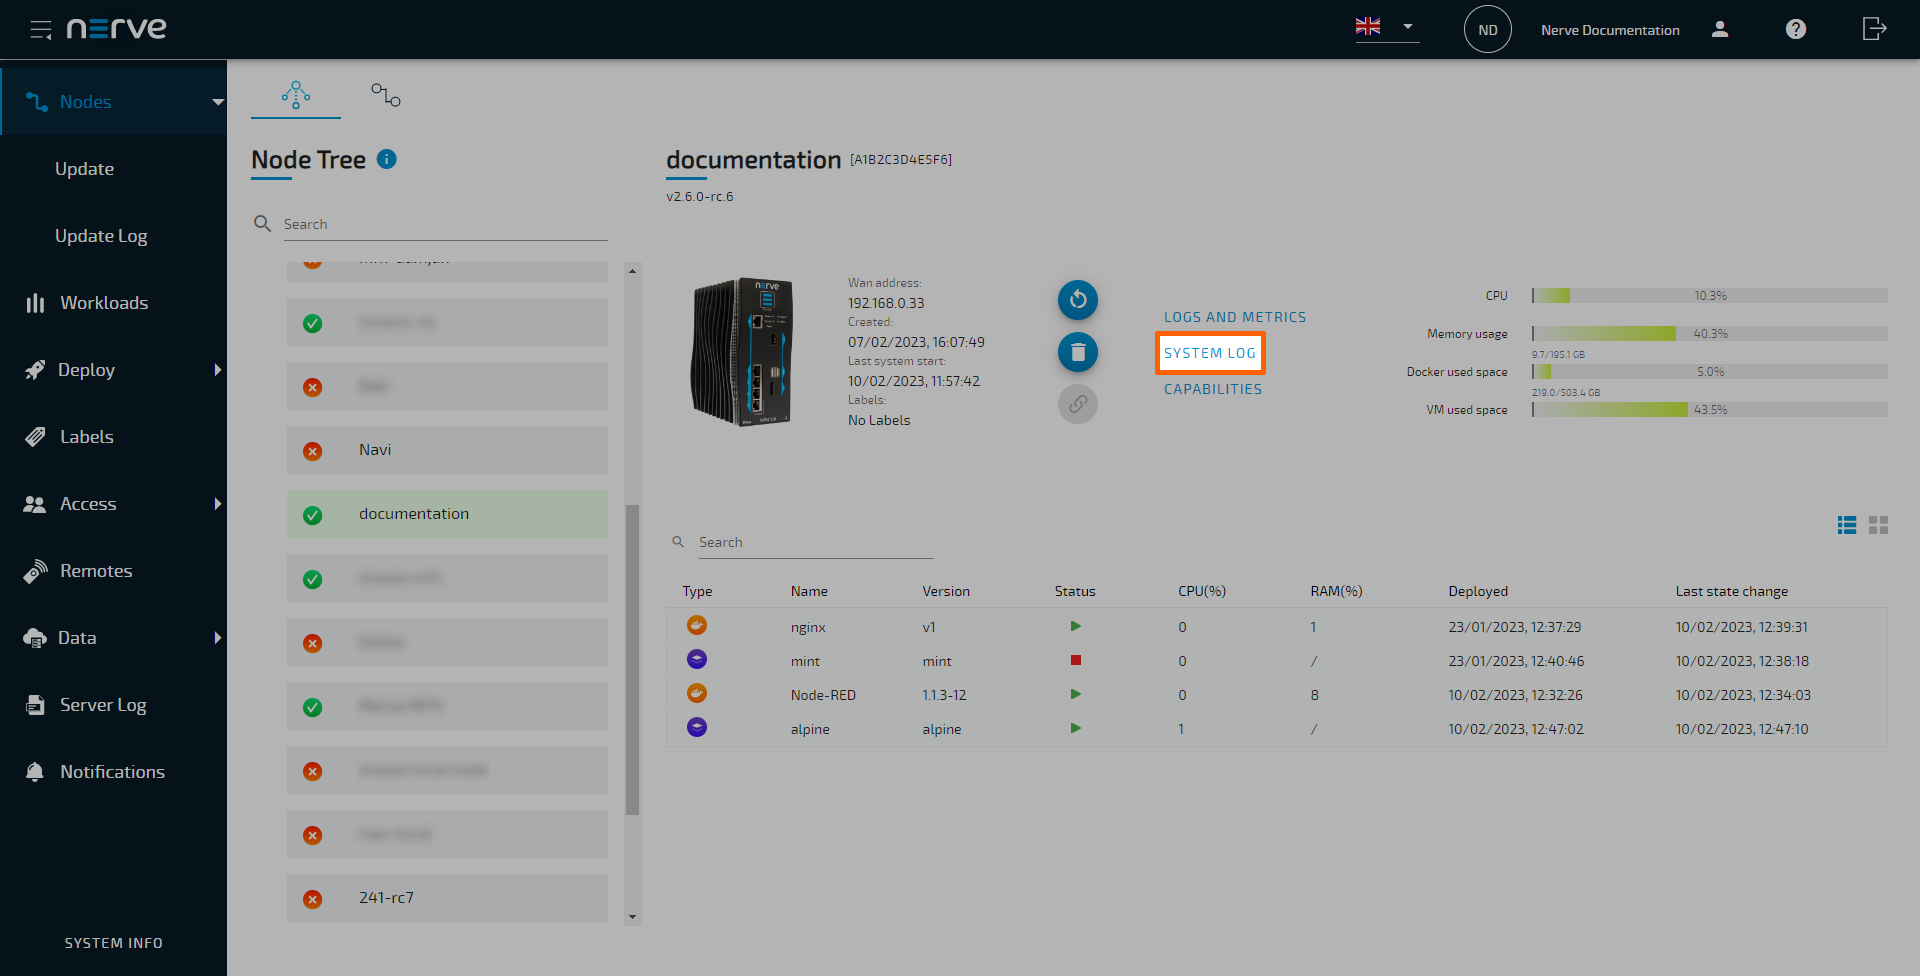
System logs
System logs can be accessed from the node details screen. Selecting SYSTEM LOG will open a new window and show the system logs of the node. The internal node logs are aimed at Nerve service technicians in case of error and failure. Data is stored and visualized with OpenSearch. The amount of logs can be modified through the SYSTEM LOG SETTINGS by Nerve service technicians. Contact customer support for more information.
Docker workload monitoring
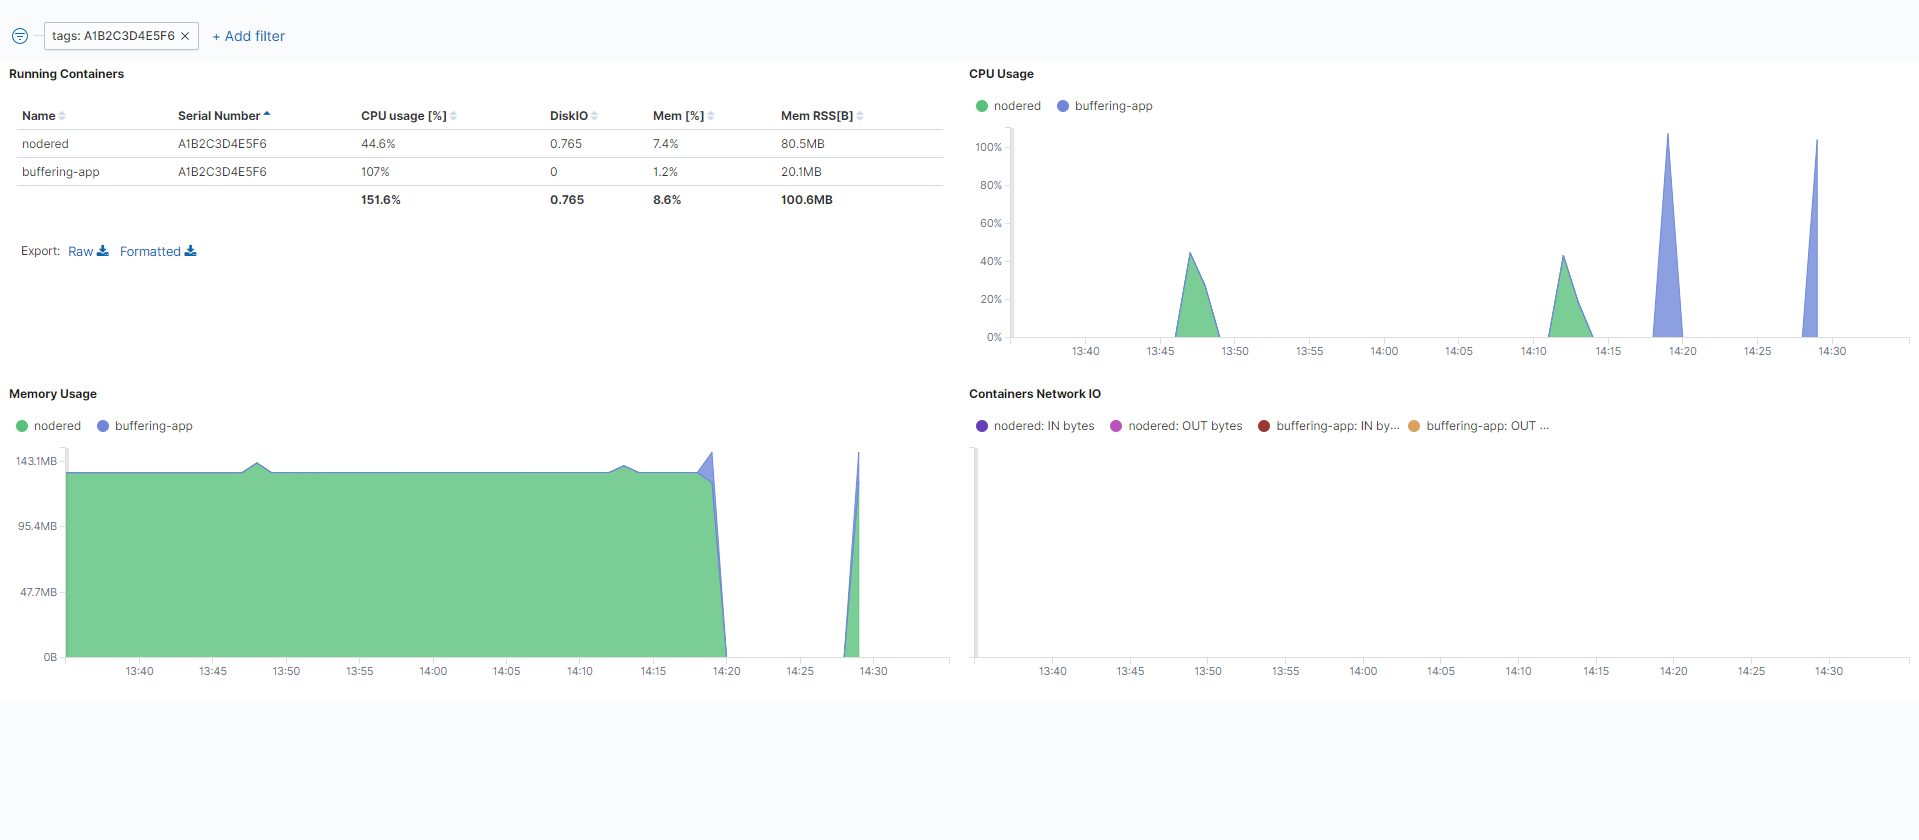
Metadata of the overall state of Docker workloads is gathered in the Management System. A list of installed containers and their resource utilization is displayed in this dashboard. Toggle the DOCKER WORKLOAD MONITORING slider to enable the tracking of Docker workload data.
| Item | Description |
|---|---|
| Running Containers | This is a list of user-installed Docker containers with details. Name This is the name of the Docker container as defined with the Container name setting when provisioning the workload. Serial Number This is the serial number of the current node. CPU usage [%] This is an average value of how much of the total CPU a Docker workload has used. DiskIO This is the sum of reads and writes over the defined timespan. Mem [%] This is an average percentage of how much of the total memory a Docker workload has used. Mem RSS[B] This is an average value of how much resident set size (RSS) memory a Docker workload has used. Refer to this link for a general explanation on RSS. |
| CPU Usage | This is a graph of CPU usage in percentage over time. Note that the percentages here are in relation to the total amount of available CPU. Also, the display behaves according to standard OpenSearch Dashboard behavior, meaning that CPU usage might be displayed as being at zero even though the CPU is busy. This is due to the graph showing only new data coming in and disregarding values that stay constant over a certain amount of time. |
| Containers Network IO | This is a graph showing the incoming and outgoing data for each container over time. Inbound and outbound traffic are marked separately per container. |
| Memory Usage | This is a graph of the total amount of memory used over time. |
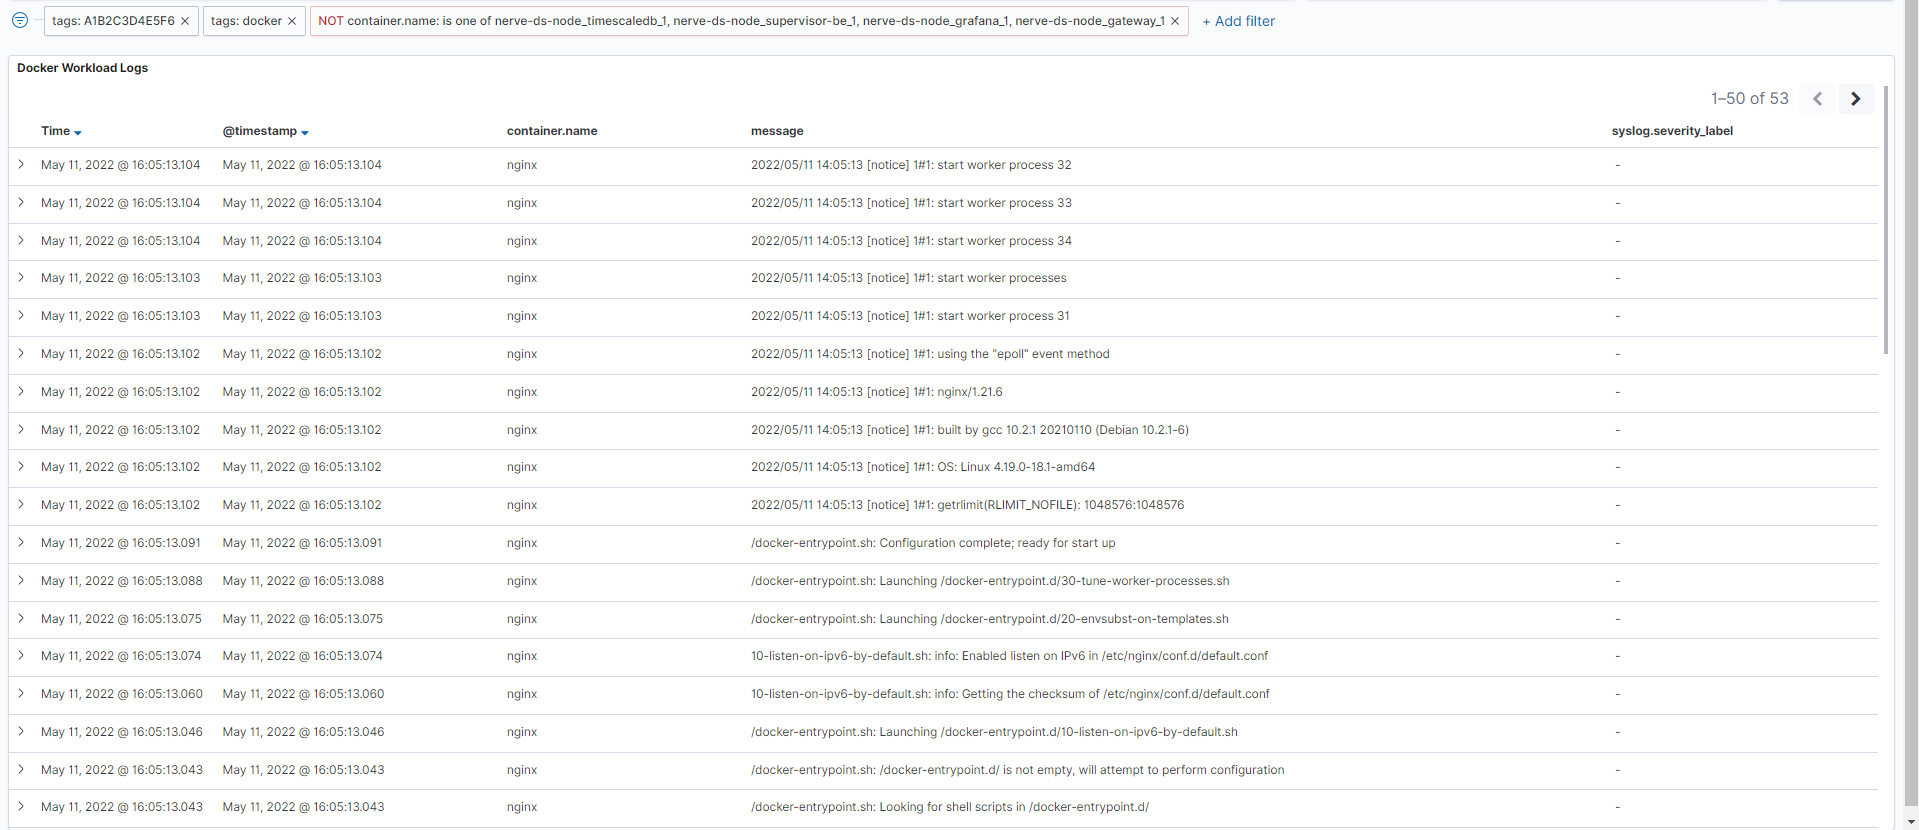
Docker workload logging
The logs of the Docker workloads on a node are collected in the centralized logging system, allowing the analysis of logs from multiple workloads and nodes. Logs are collected from the standard Linux streams stdout (for debug messages) and stderr (for error messages). So for user created workloads this means that logs need to be sent to these streams to be collected. Note that the logs are most suitable to be read by developers with expert knowledge and should also be configured by developers. Toggle the DOCKER WORKLOAD LOGGING slider to enable the tracking of Docker workload logs.
To display logs of a certain workload, collected logs can be filtered in the Docker workload logging dashboard in OpenSearch.
Setting up alerts
Users can monitor specific events and receive alerts when critical events are detected. The instructions below explain how to create alerts and choose a notification method for specific events detected in a Docker workload. The instructions are split up the following way to make them easier to follow:
Note
This section mostly concerns how to use and configure OpenSearch in the context of the Nerve system. Therefore, refer to the OpenSearch documentation for detailed information that is not covered in the instructions below.
-
Setting up a notification channel
A notification channel is set up to use in an action. Inside the channel, sender and recipients are defined. This section is split up further into creating an SMPT sender, a recipient group and a notification channel. -
Setting up a monitor
A monitor is a job that runs on a defined schedule and queries OpenSearch indexes. The results of these queries are then used as input for one or more triggers. -
Setting trigger and action
Triggers are conditions that, if met, generate alerts, with an action that sends out information after being triggered. Actions have a destination, a message subject and a message body.
Since the instructions below cover steps performed in OpenSearch, OpenSearch needs to be accessed in the Nerve system to proceed:
- Log in to the Management System.
- Select a node from the node tree.
-
Select SYSTEM LOG to access OpenSearch.
Note that OpenSearch can also be accessed through any of the dashboards in the LOGS AND METRICS menu.
Setting up a notification channel
To send automated notifications from OpenSearch, a notification channel has to be defined. This example shows how to set up an e-mail notification channel. Before setting up a notification channel, a sender and recipient group have to be defined, which is covered in separate steps below.
Creating an SMTP sender
SSL and OpenSearch keystore are recommended to store usernames and passwords of the sender.
- Select the burger menu in the upper-left.
-
Select Notifications under OpenSearch Plugins.
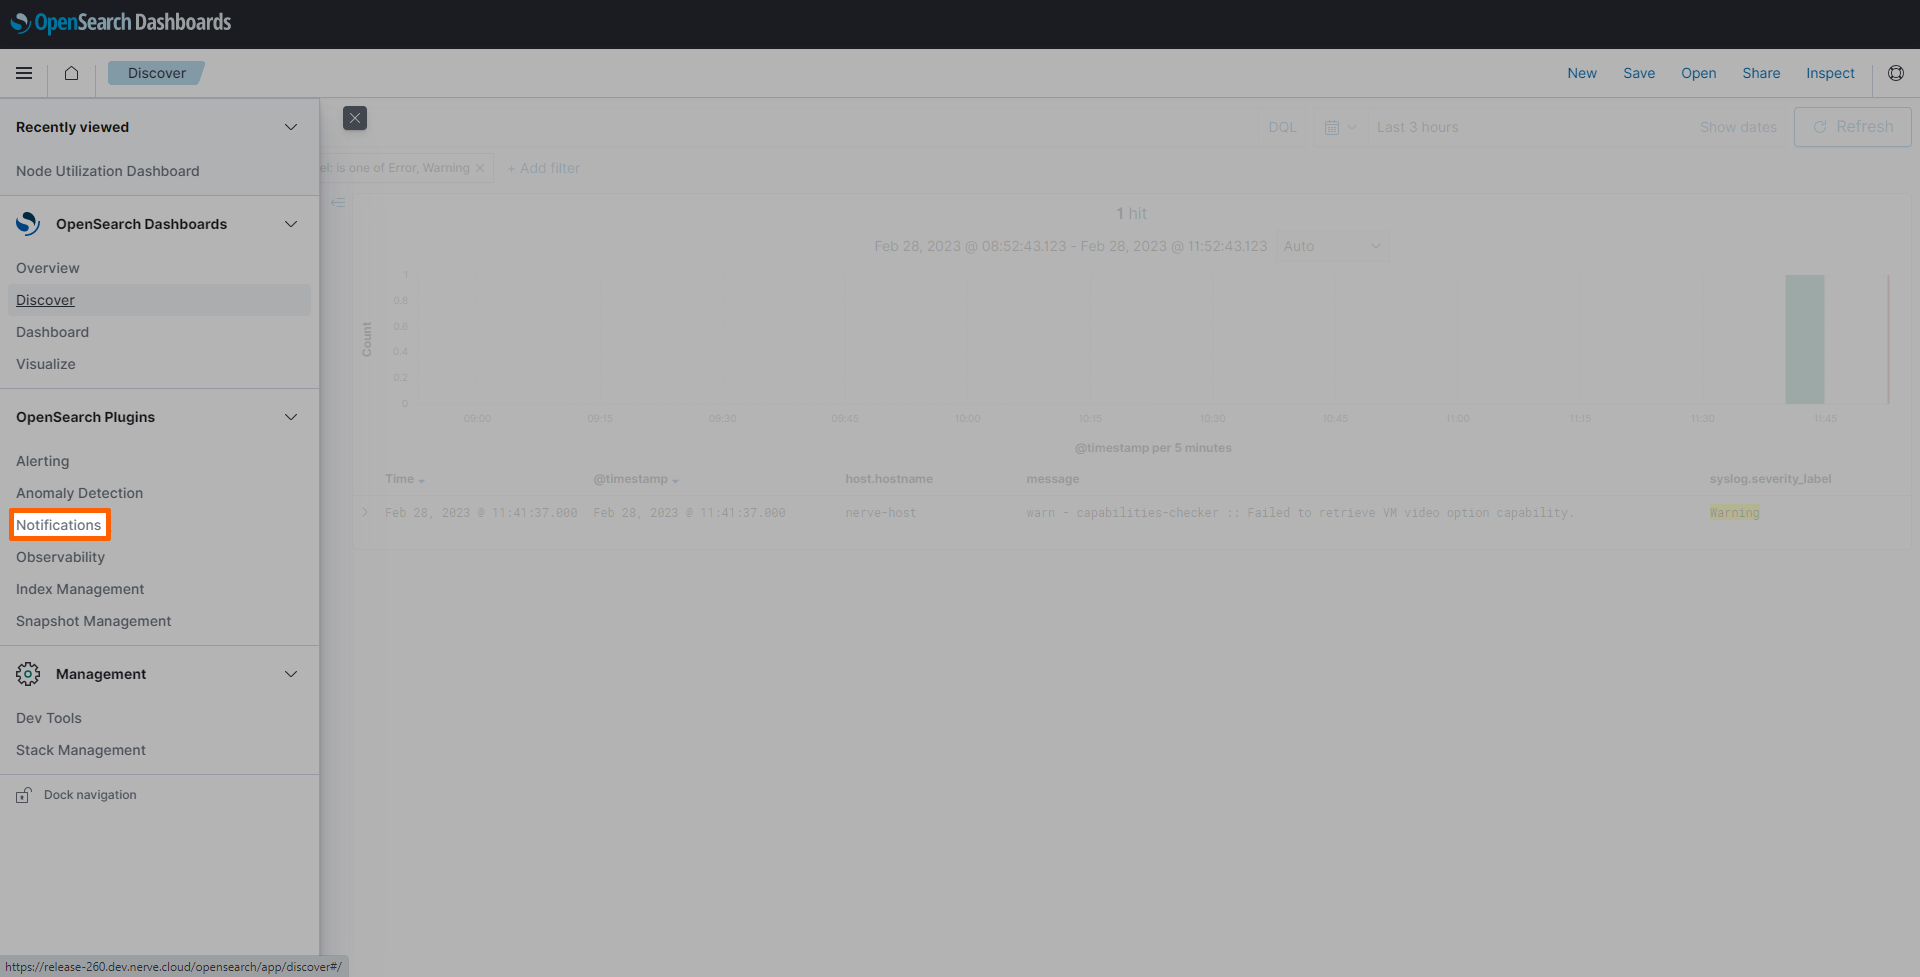
-
Select Email senders.
-
Select Create SMTP sender on the right.
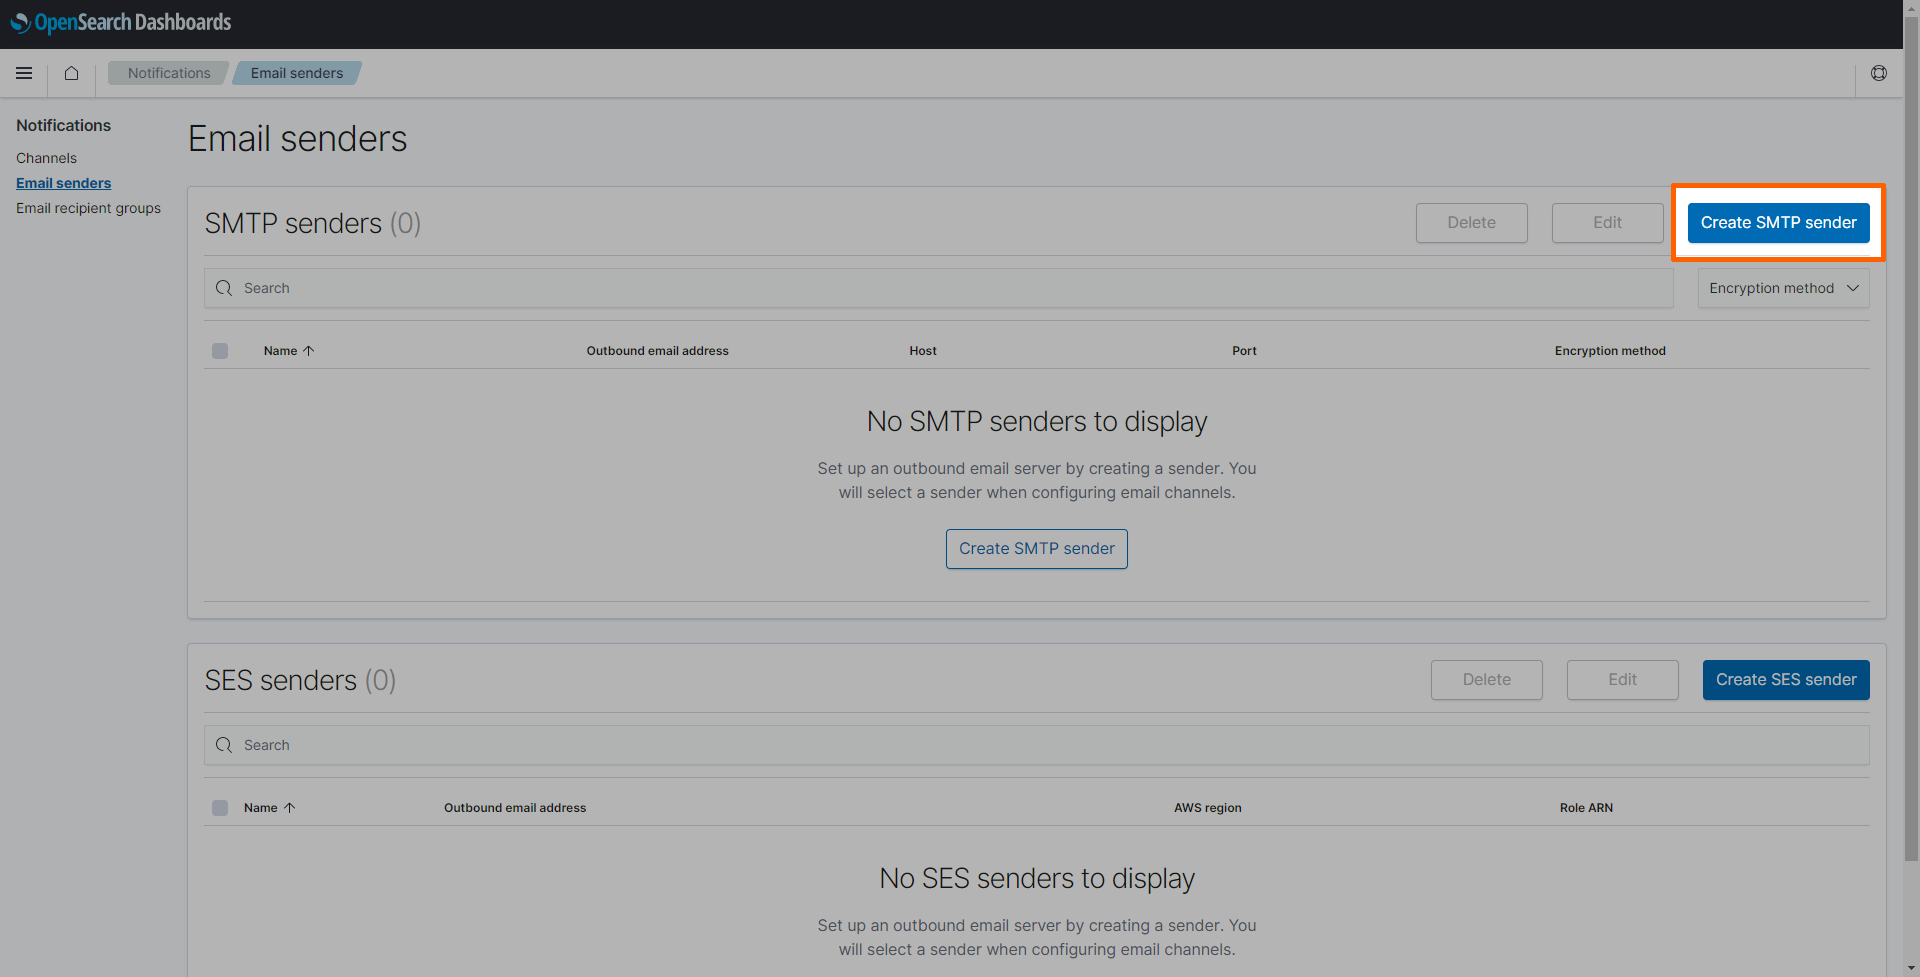
-
Enter the following information:
Setting Value Sender name nerve-alertsEmail address alerts@nerve.cloudHost mail.nerve.cloudPort 587Encryption method TLS -
Select Create.
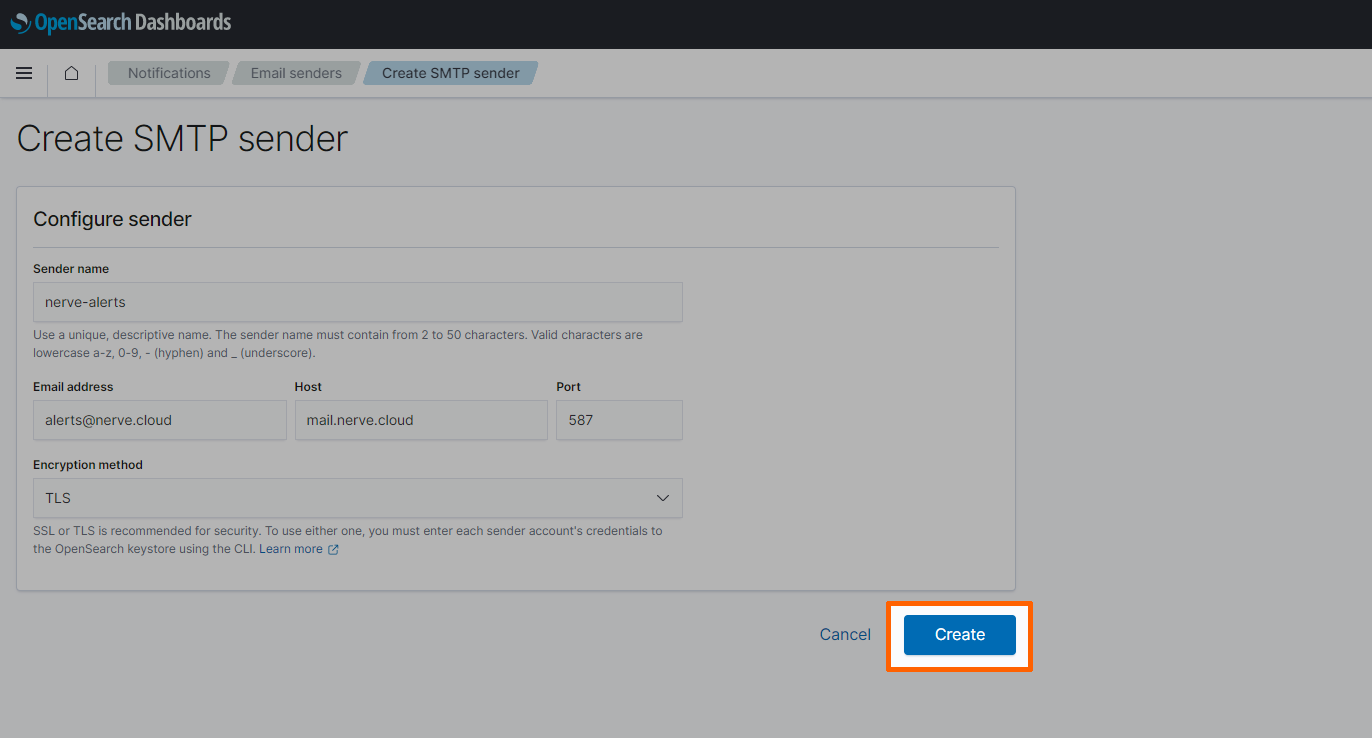
The SMTP sender is now created. However, authentication of the SMTP sender needs to be performed by Nerve Service technicians. Contact customer support through the TTTech Industrial support portal to have the SMTP sender authenticated.
Creating a recipient group
Individuals or a group of people that should be notified about specific events are added to recipient groups.
- Select the burger menu in the upper-left.
-
Select Notifications under OpenSearch Plugins.
-
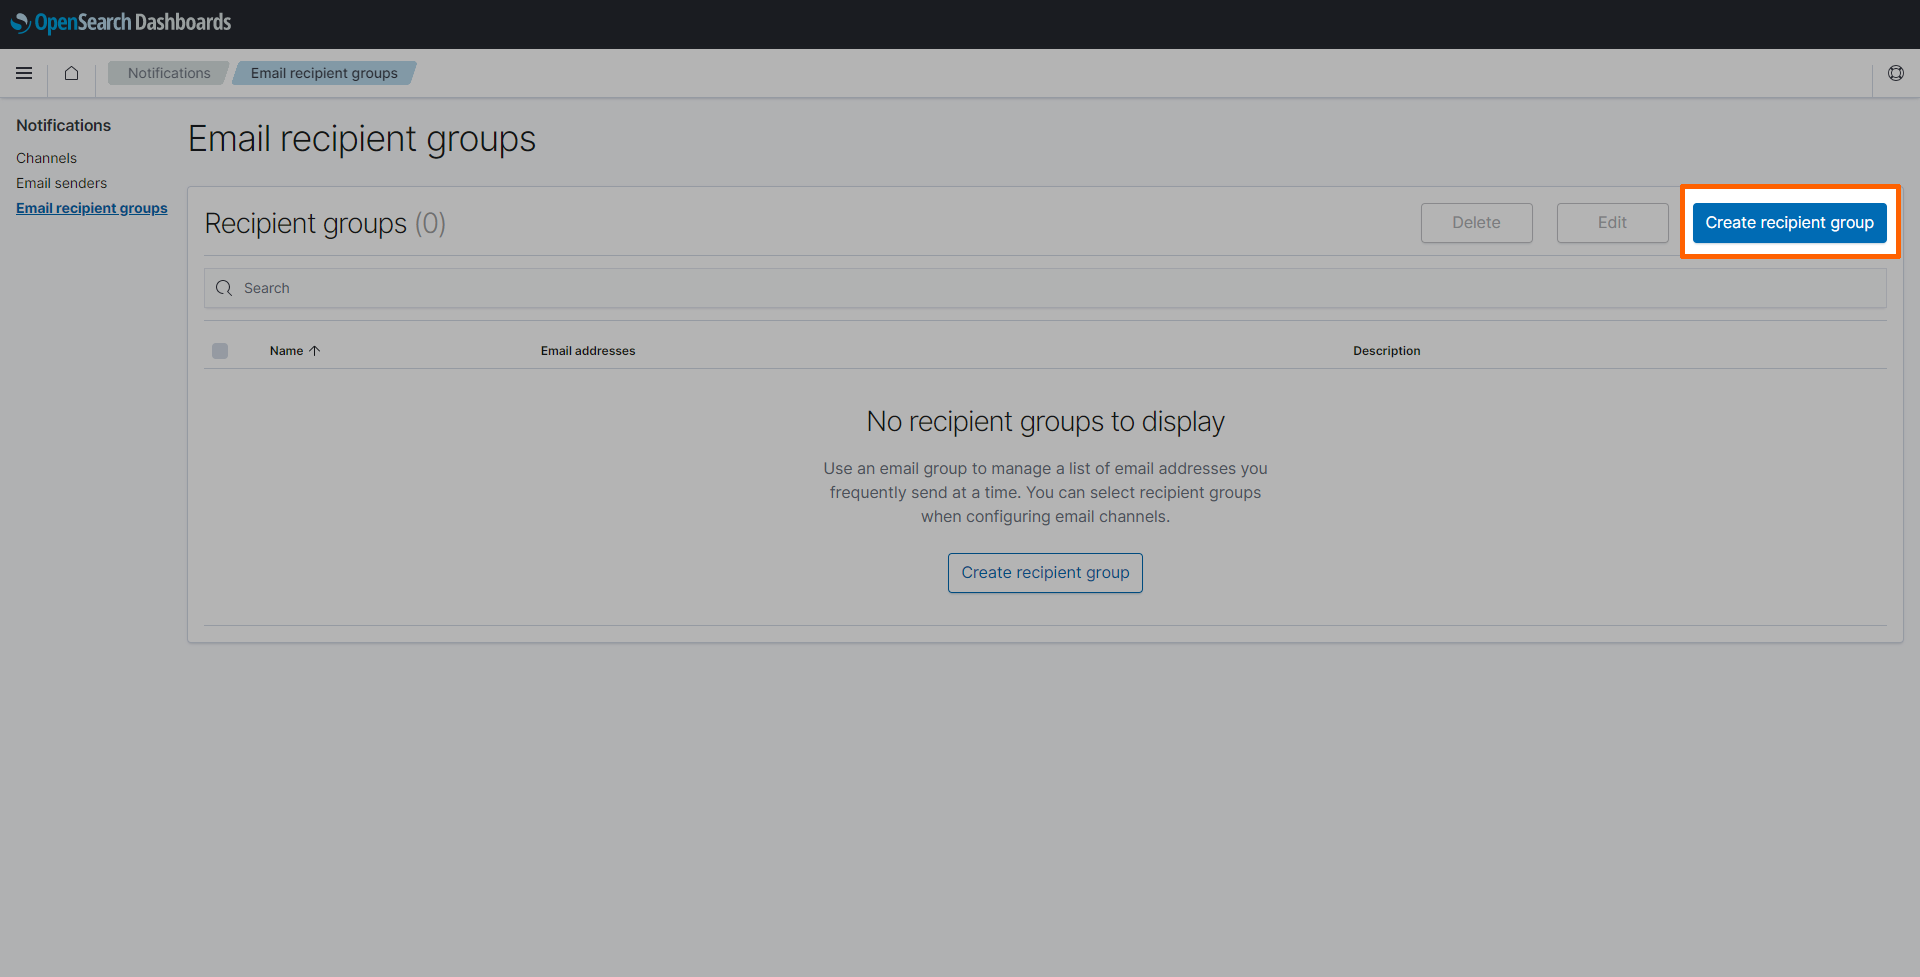
Select Email recipient groups.
-
Select Create recipient group on the right.
-
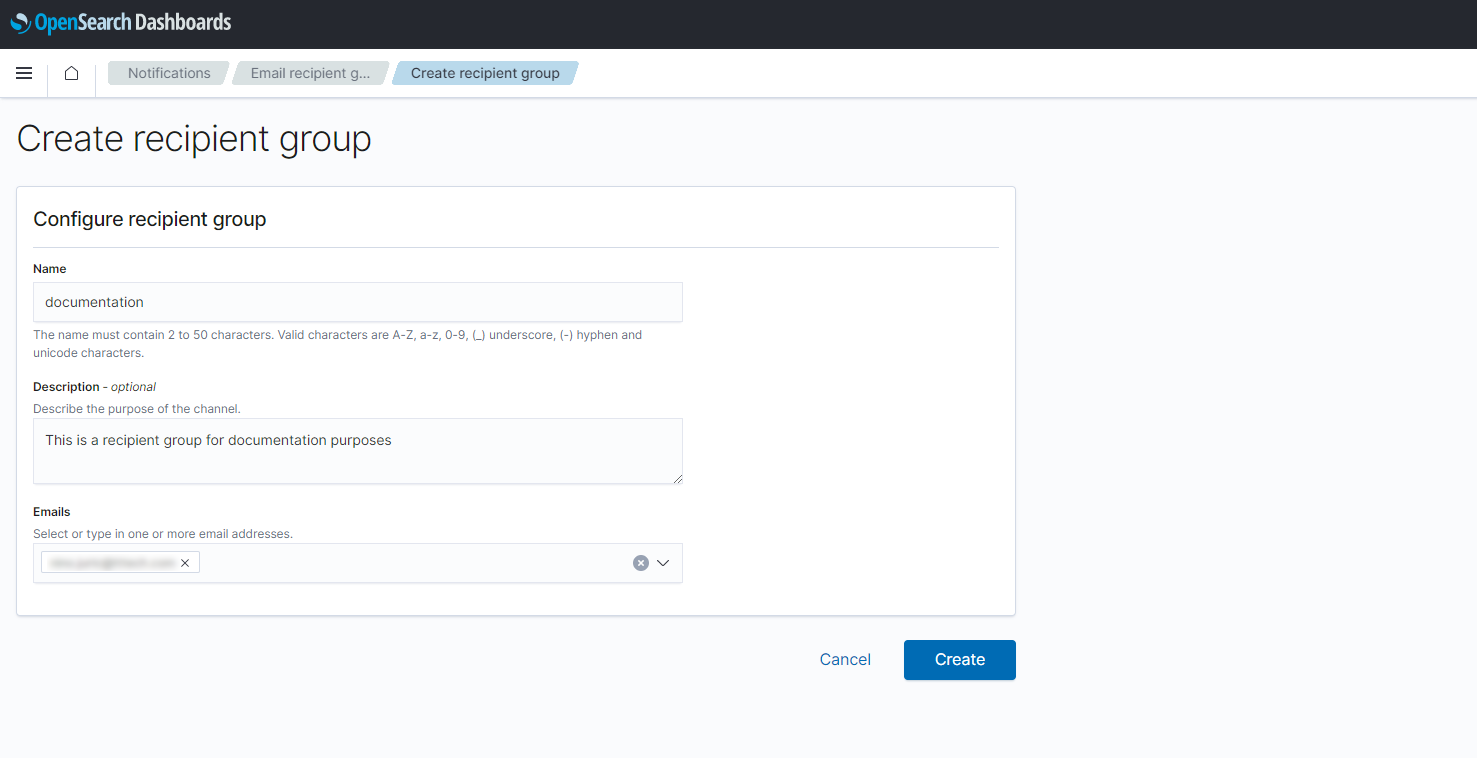
Enter the following information:
Setting Value Name Enter a name for the recipient group. This example uses documentation.Description This field is optional. Enter a description to give more information about the recipient group. Emails Add the email addresses of the recipients that should receive alerts. -
Select Create.
Creating a notification channel
Notification channels can be set up in multiple ways. This example sets up an e-mail notification channel using SMTP. Refer to OpenSearch documentation for more information on other types of notification channels.
- Select the burger menu in the upper-left.
-
Select Notifications under OpenSearch Plugins.
-
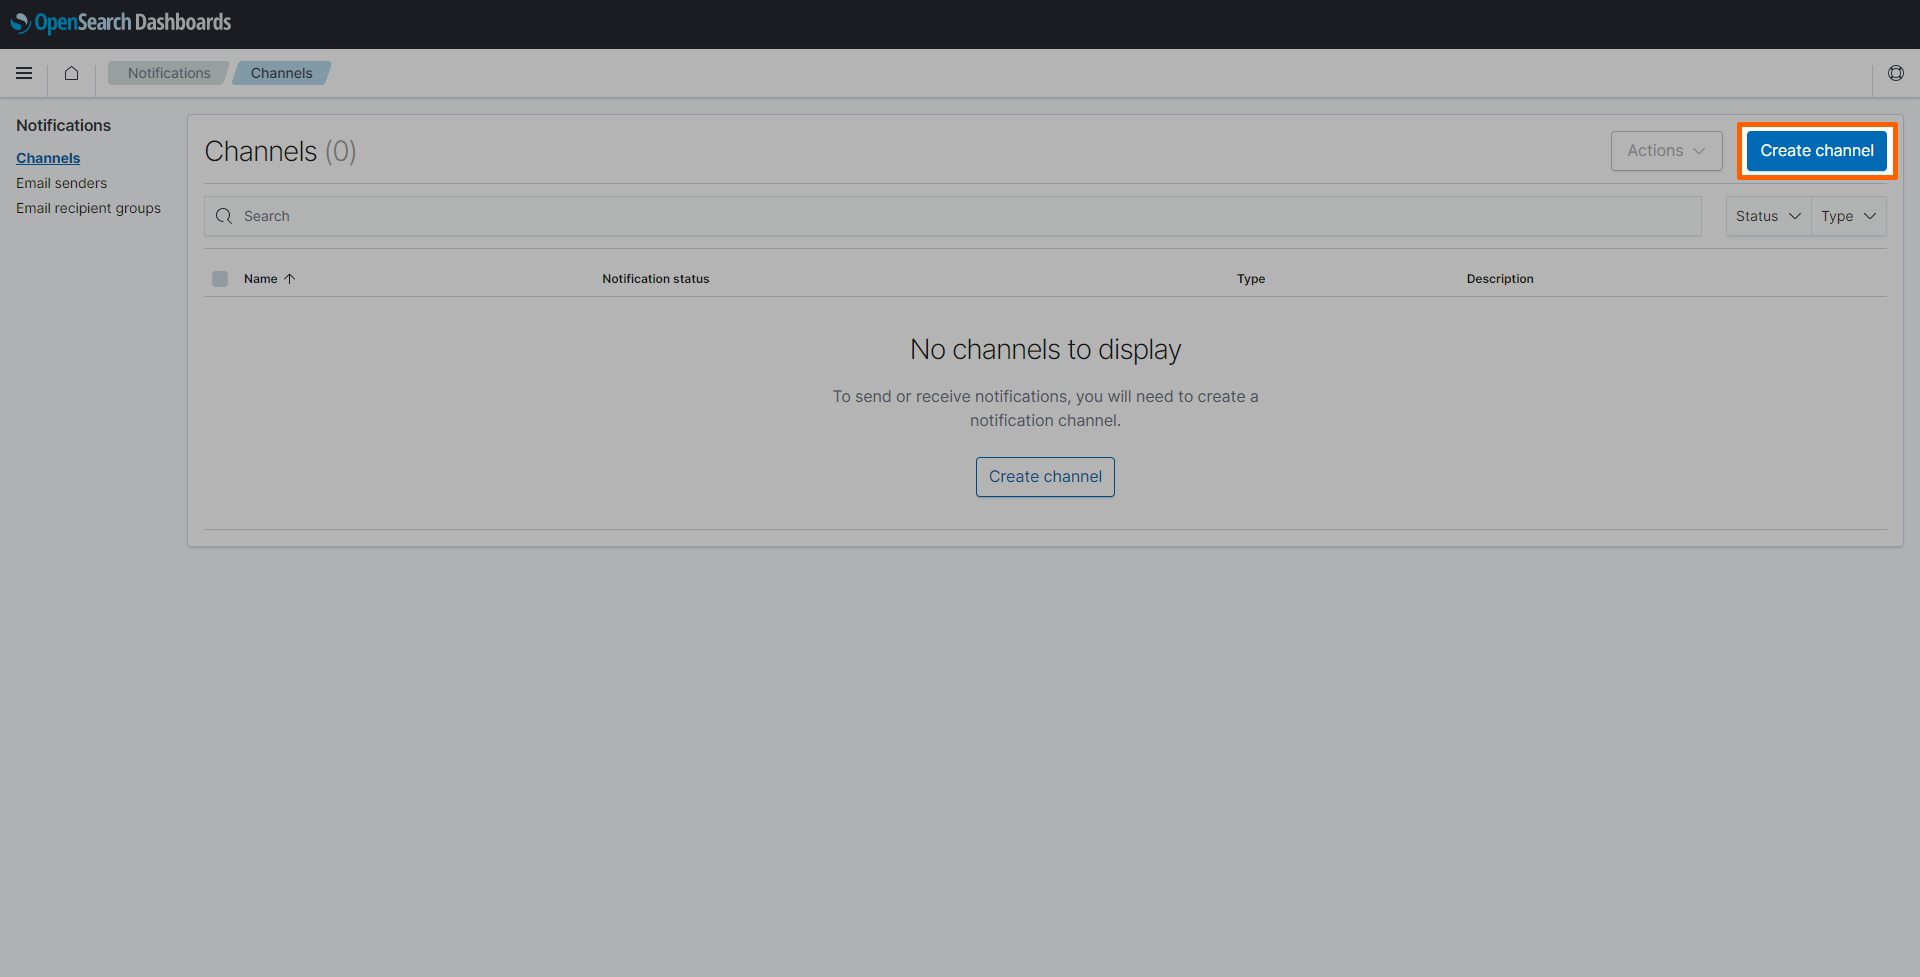
Select Channels.
-
Select Create channel on the right.
-
Enter the following information:
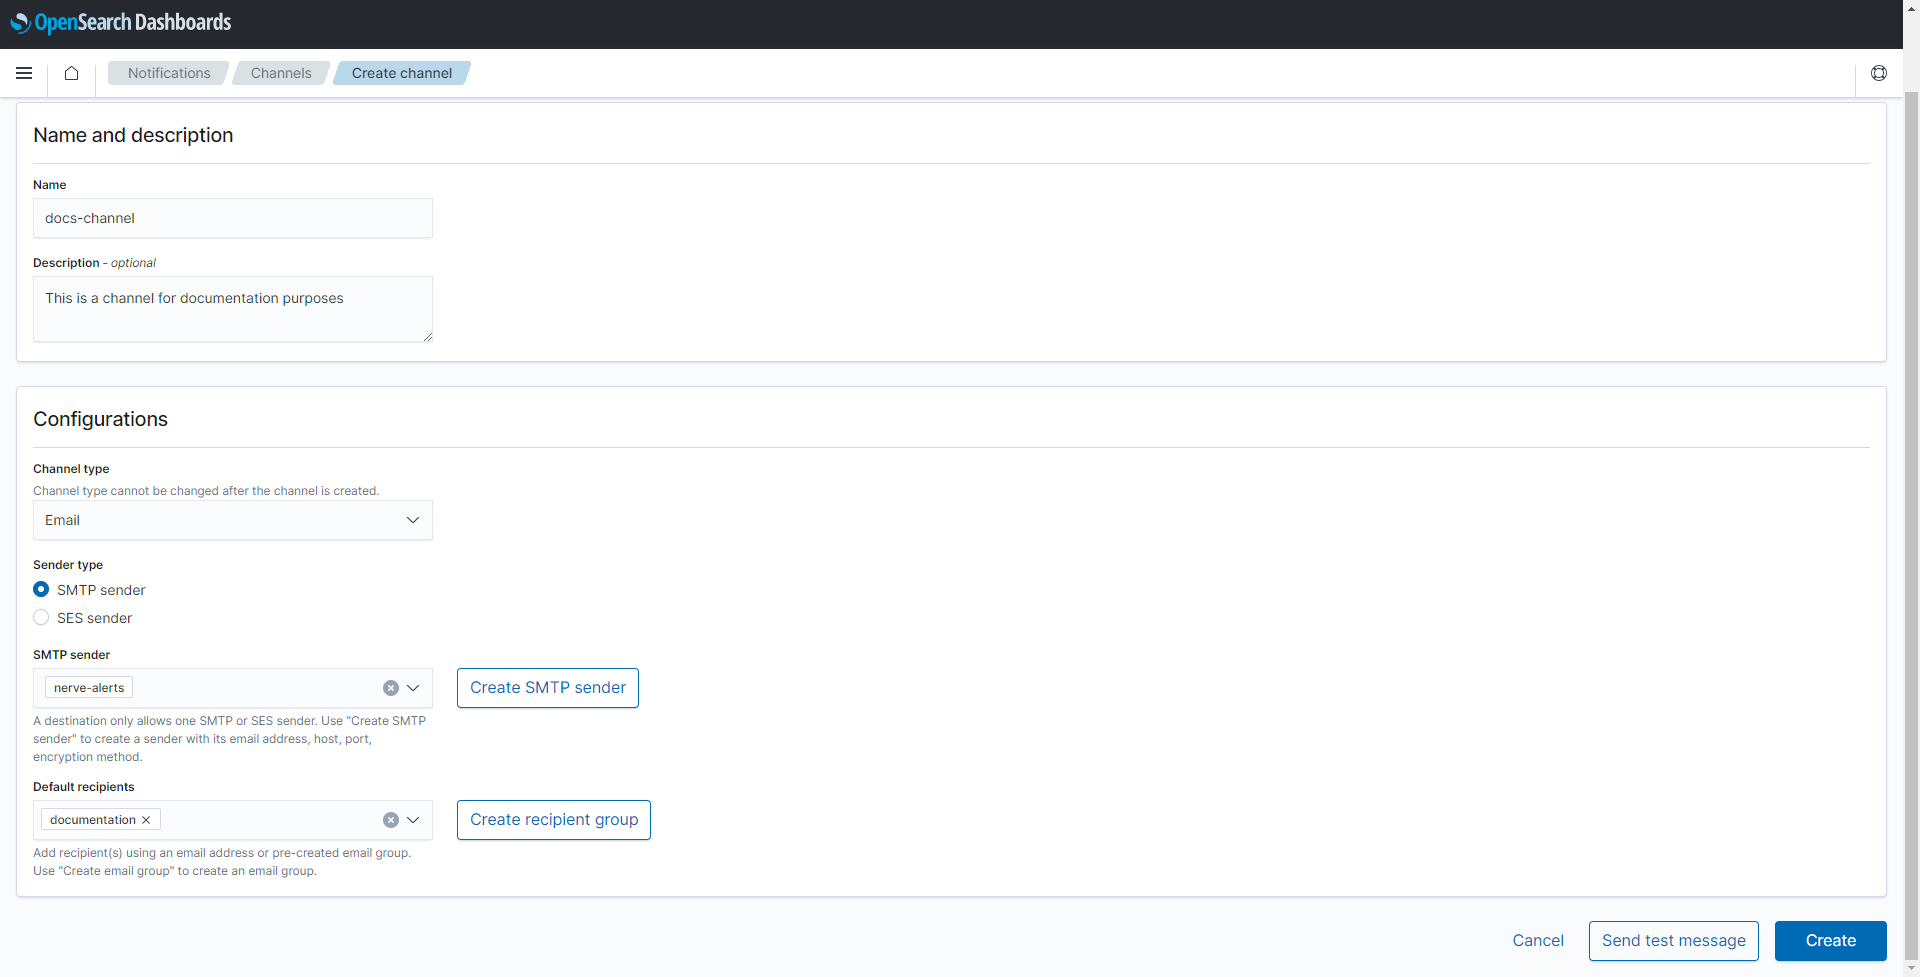
Category Settings and values Name and description Name
Enter a name for the channel. This example usesdocs-channel.
Description
This field is optional. Enter a description to give more information about the channel.Configurations Channel type
Select Email from the drop-down menu.
Sender type
Select SMTP sender.
SMTP sender
Select the sender that was created in Creating an SMTP sender above from the drop-down menu. This example usesnerve-alerts.
Default recipients
Select the recipient group that was created in Creating a recipient group above from the drop-down menu. This example usesdocumentation. -
Select Create.
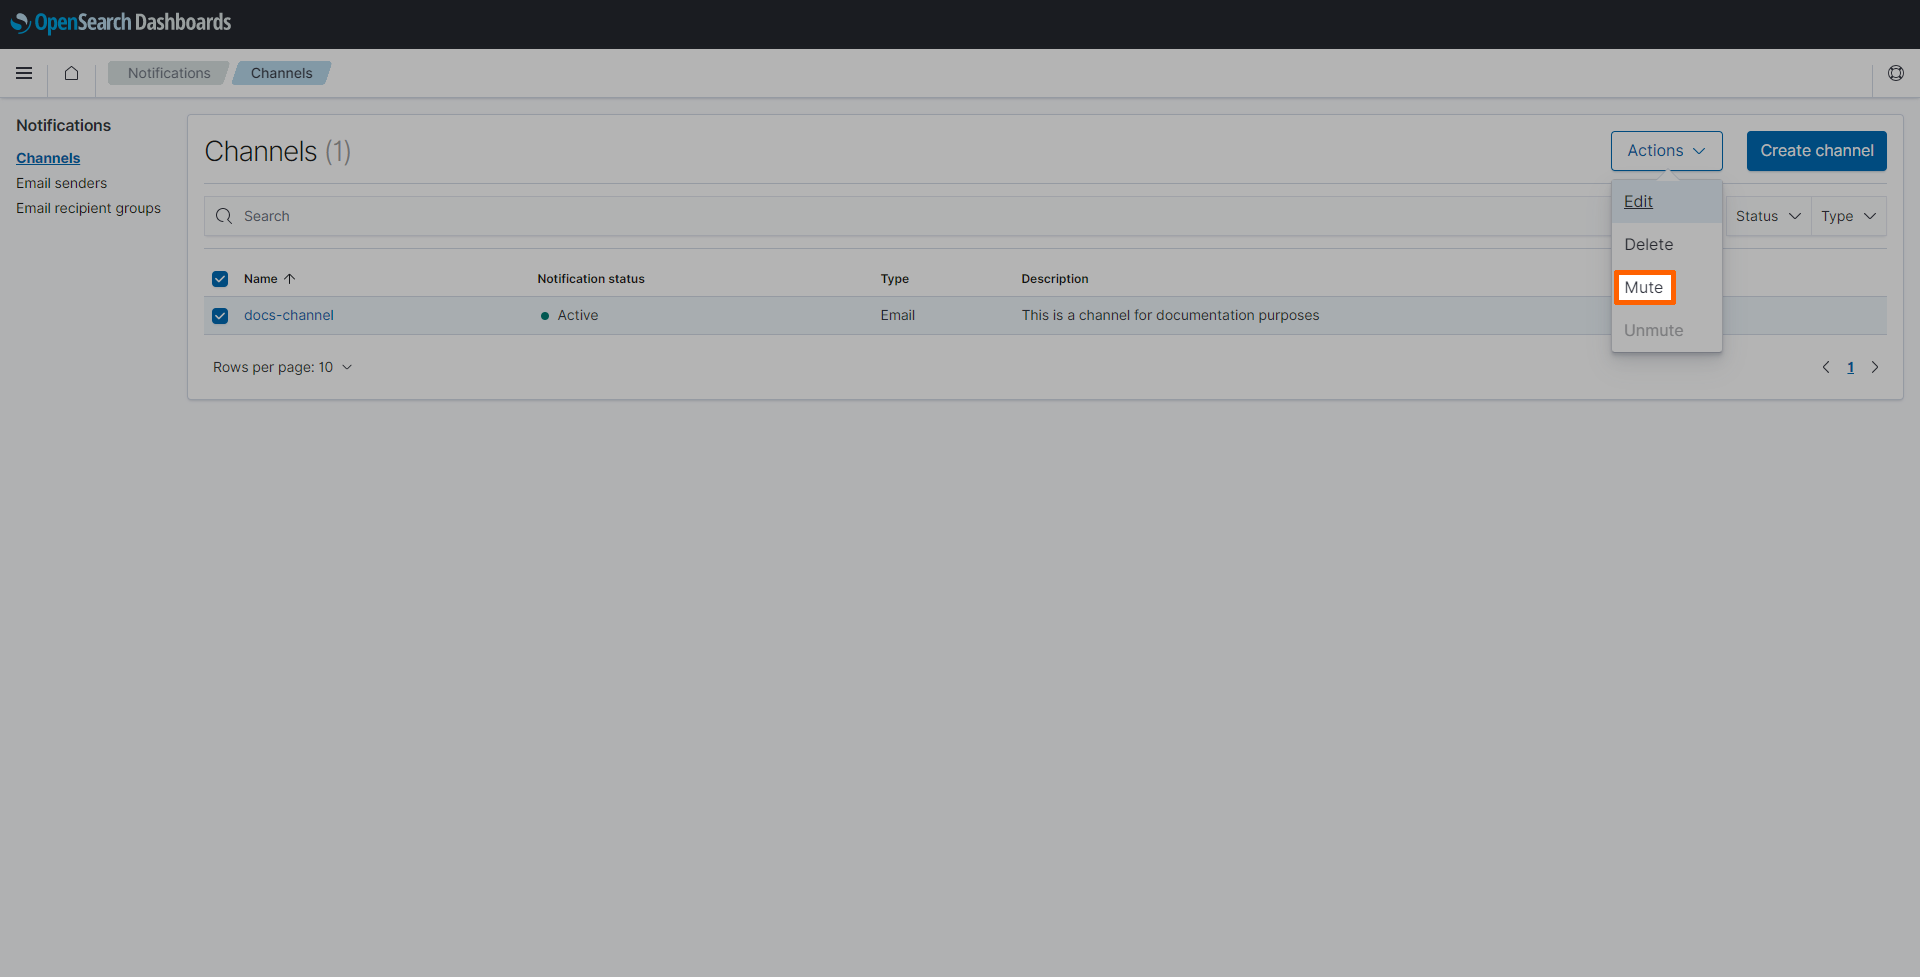
Once created, the channel is automatically activated. It is suggested to temporarily deactivate a channel in case an error has been found. If a system is being repaired, logs will likely produce further error messages that would be detected. Muting a channel helps avoiding unnecessary alarms in the meantime. Tick the checkbox next to the channel and select Mute from the Actions drop-down menu.
Setting up a monitor
Note
This example uses a query monitor to filter log messages by their contents. There are other monitor types that can be used as well. Refer to OpenSearch documentation for more information on other types of monitors.
When setting up a monitor, it is required to define a query, which is used to detect words and phrases in log messages. This query serves as the base of the alert. This query is written in a search language called query domain-specific language (DSL), which is provided by OpenSearch. Query DSL is a flexible language with a JSON interface. Refer to OpenSearch documentation for more information on how to write queries in Query DSL.
For this example, the query is set up to find specific keywords inside custom logs from a container. The query used in the instructions below looks for the phrase ERROR in all log messages, which is set by the query parameter. Replace the value with other words or phrases to search for different terms.
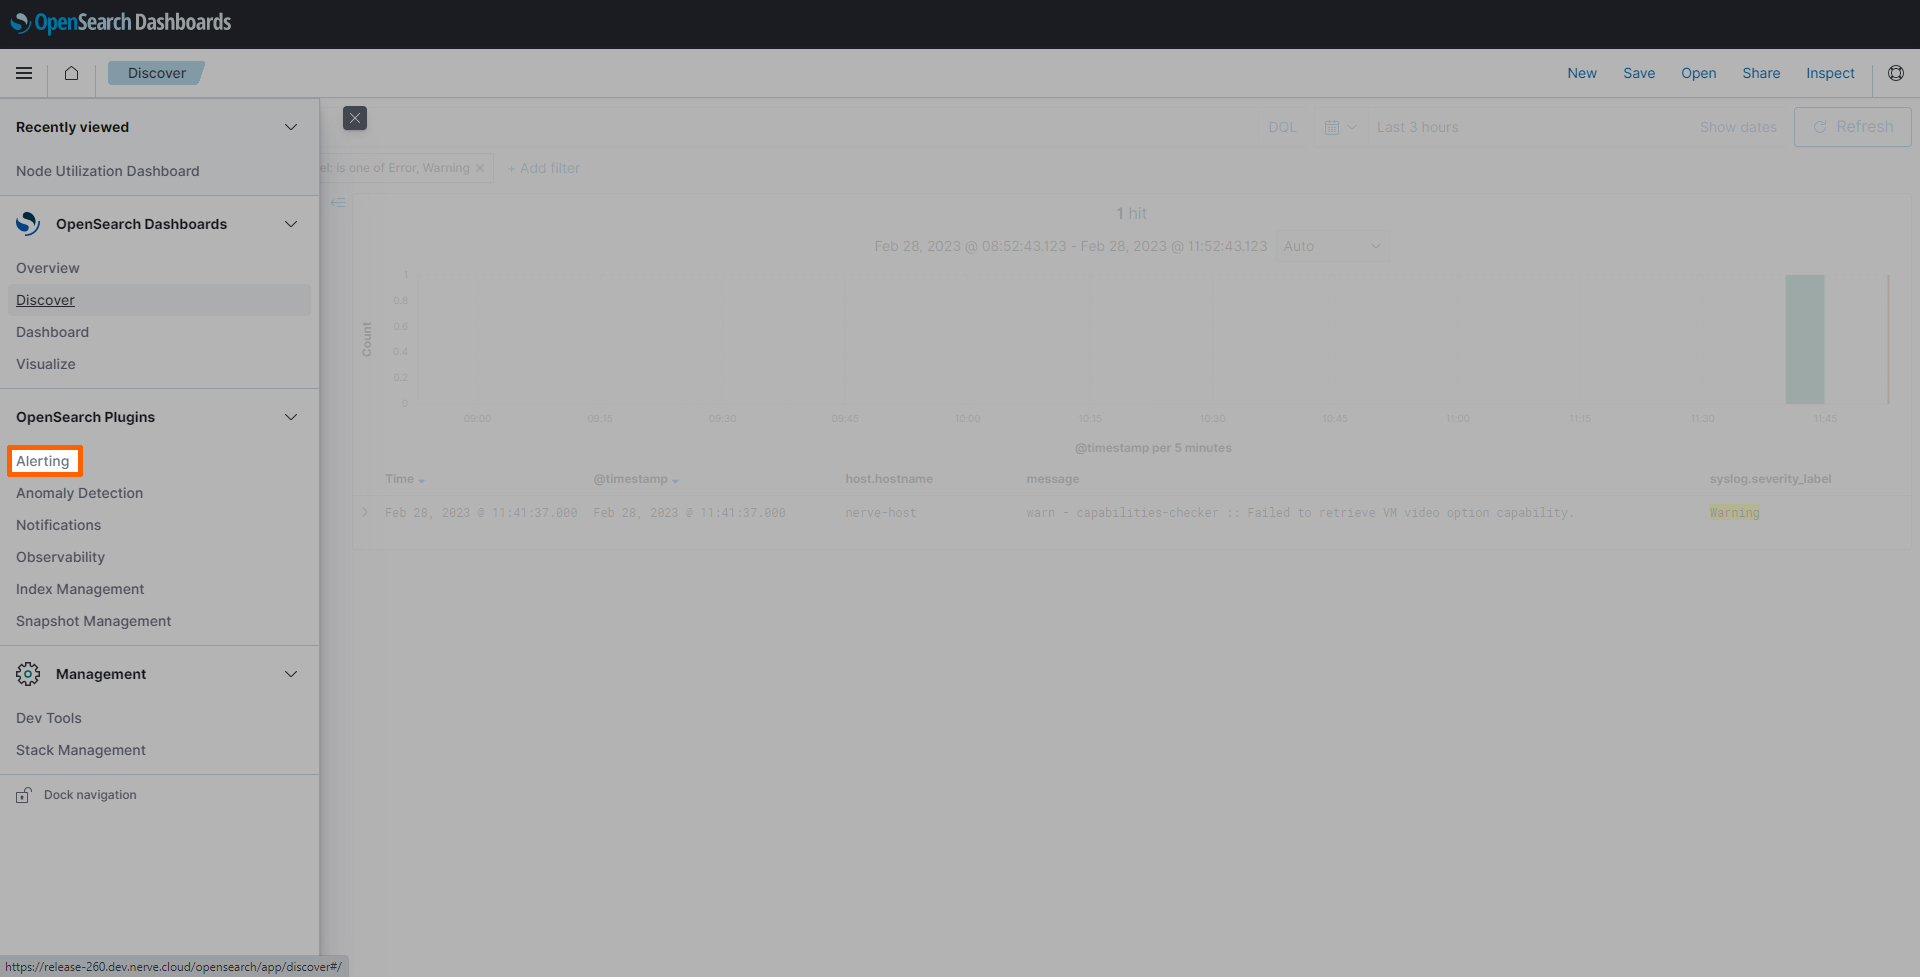
- Select the burger menu in the upper-left.
-
Select Alerting under OpenSearch Plugins.
-
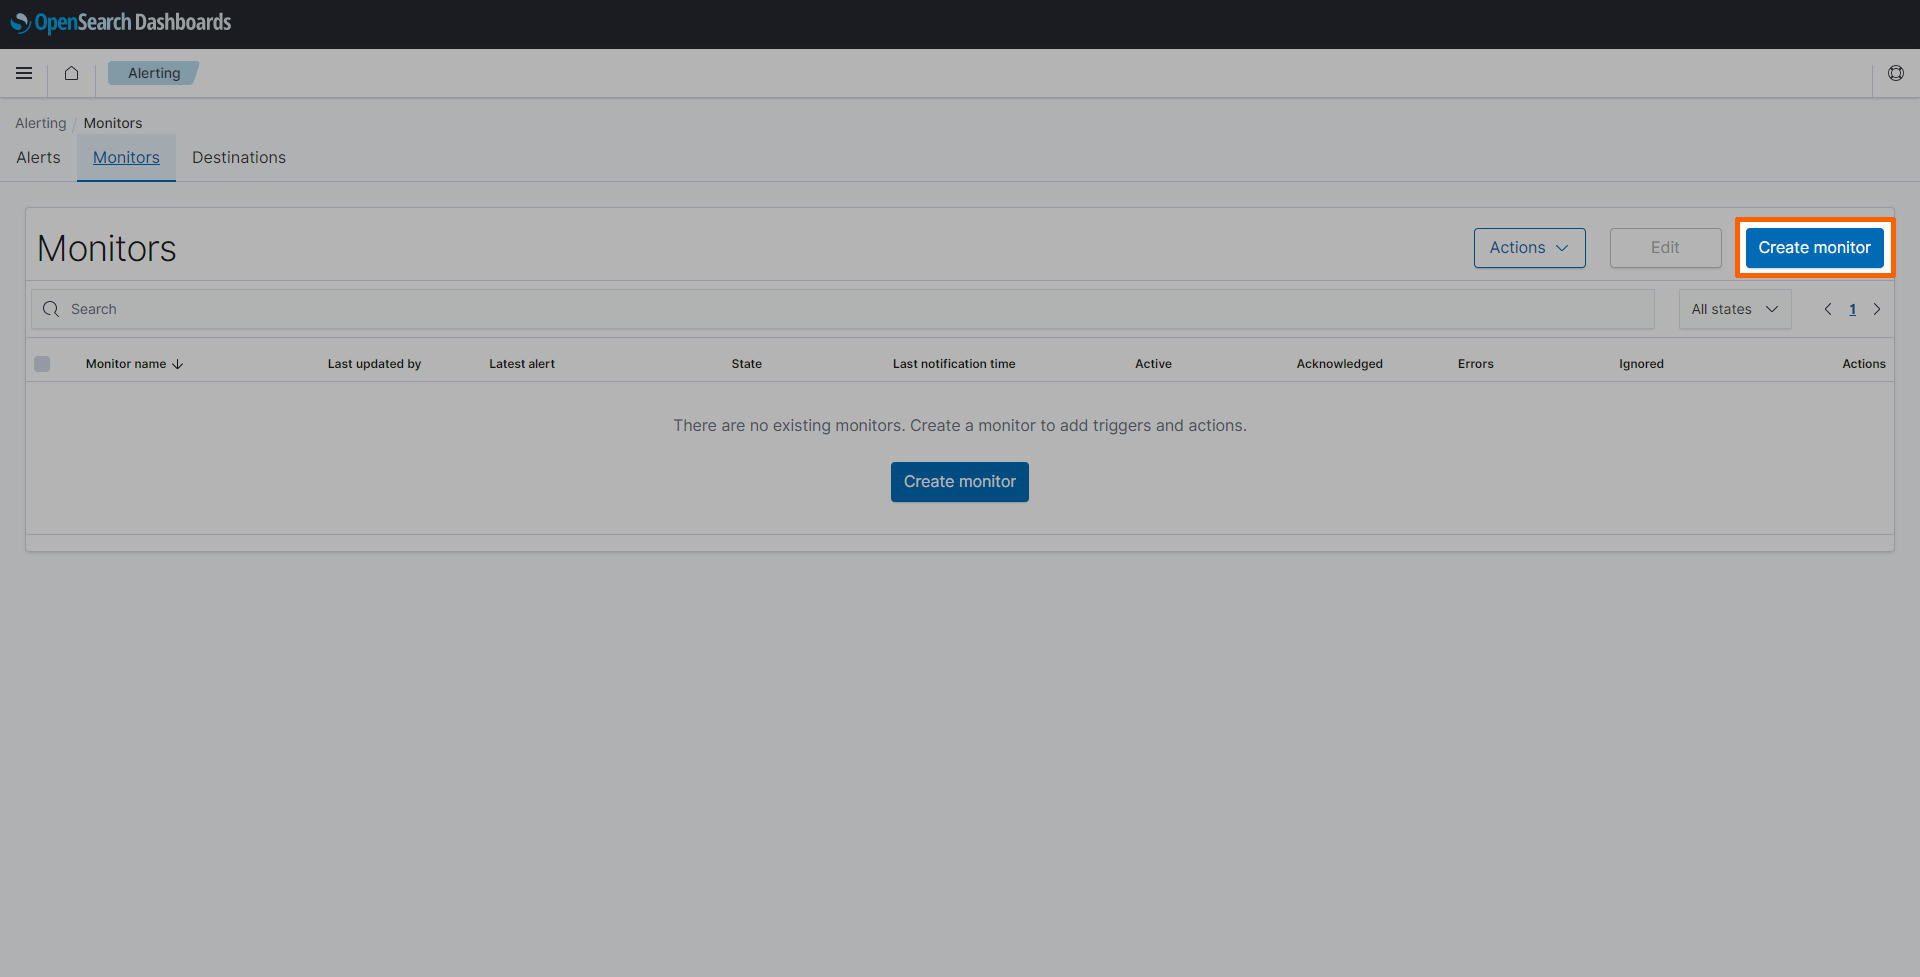
Select the Monitors tab.
-
Select Create monitor on the right.
-
Enter a Monitor name. This example uses
docs-monitor. - Select Per query monitor under Monitor type.
-
Select Extraction query editor under Monitor defining method.
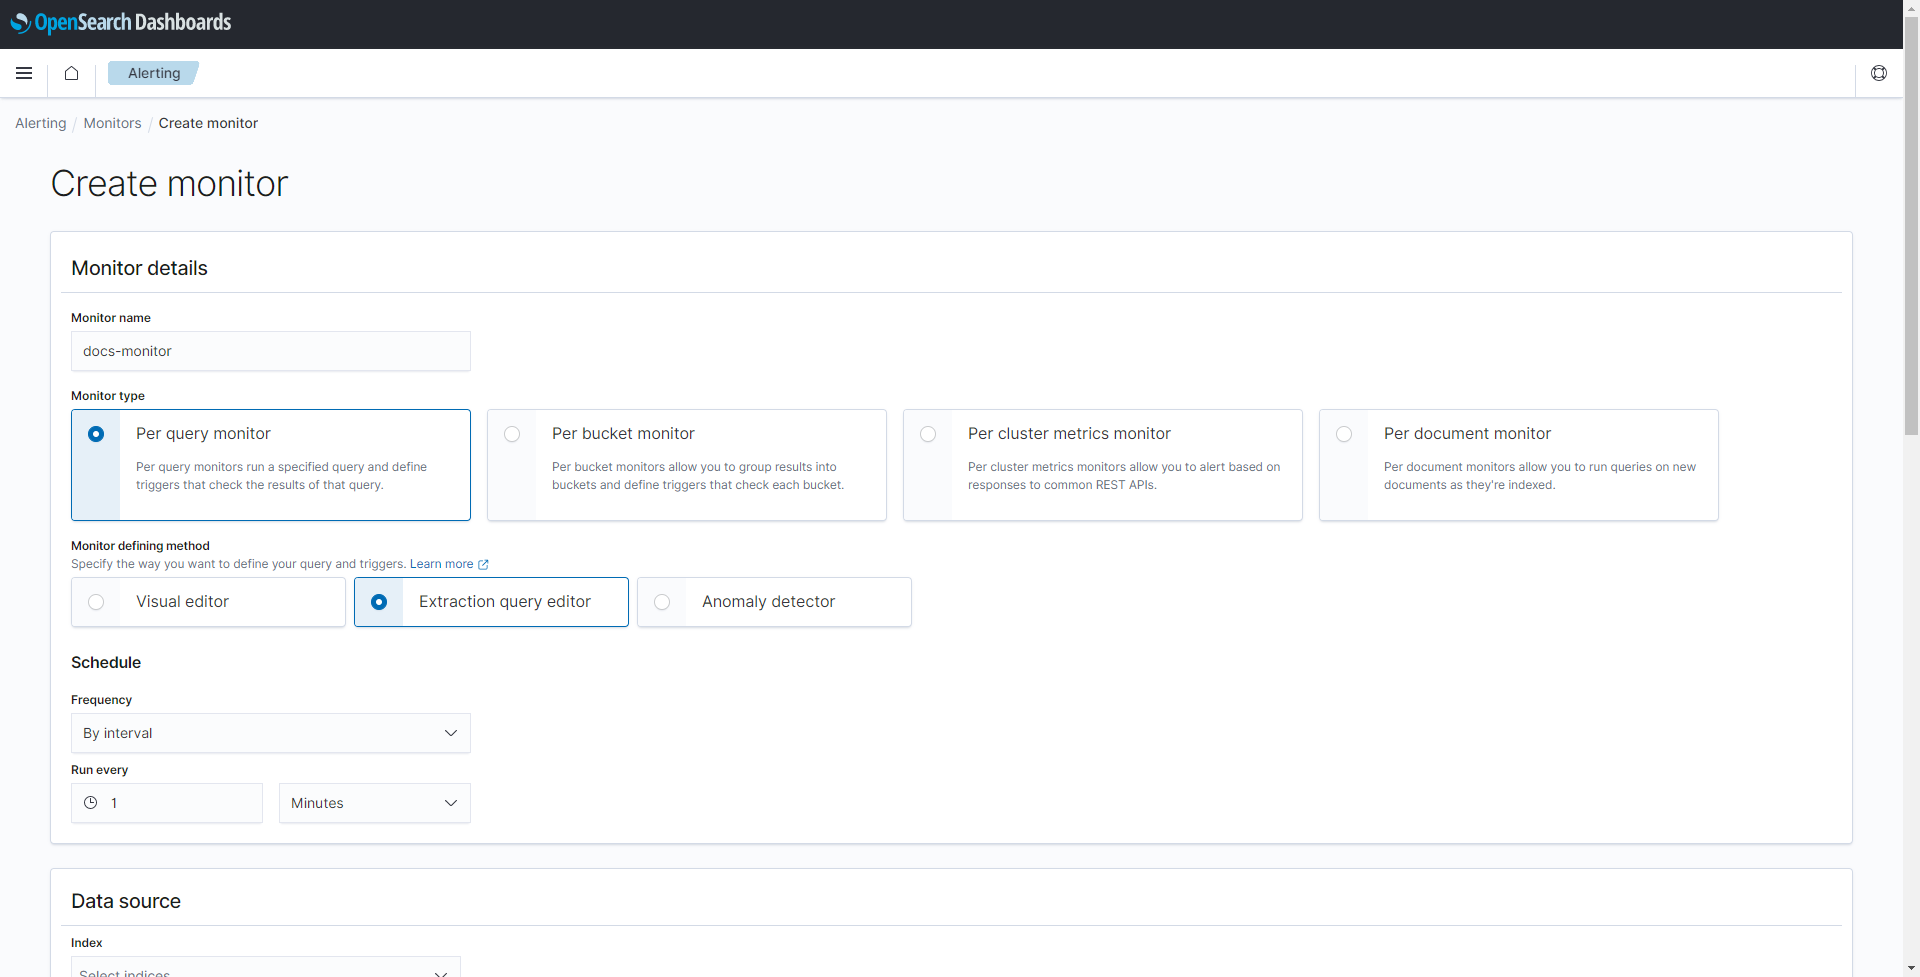
-
Enter
filebeat*under Data source to collect data stored in all filebeat indexes. -
Copy the following script into Define extraction query.
{
    "size": 1000,
    "query": {
        "bool": {
            "filter": [
                {
                    "range": {
                        "@timestamp": {
                            "from": "{{period_end}}||-1m",
                            "to": "{{period_end}}",
                            "include_lower": true,
                            "include_upper": true,
                            "format": "epoch_millis",
                            "boost": 1
                        }
                    }
                },
                {
                    "match_phrase": {
                        "message": {
                            "query": "ERROR",
                            "slop": 0,
                            "zero_terms_query": "NONE",
                            "boost": 1
                        }
                    }
                }
            ],
            "adjust_pure_negative": true,
            "boost": 1
        }
    },
    "aggregations": {}
}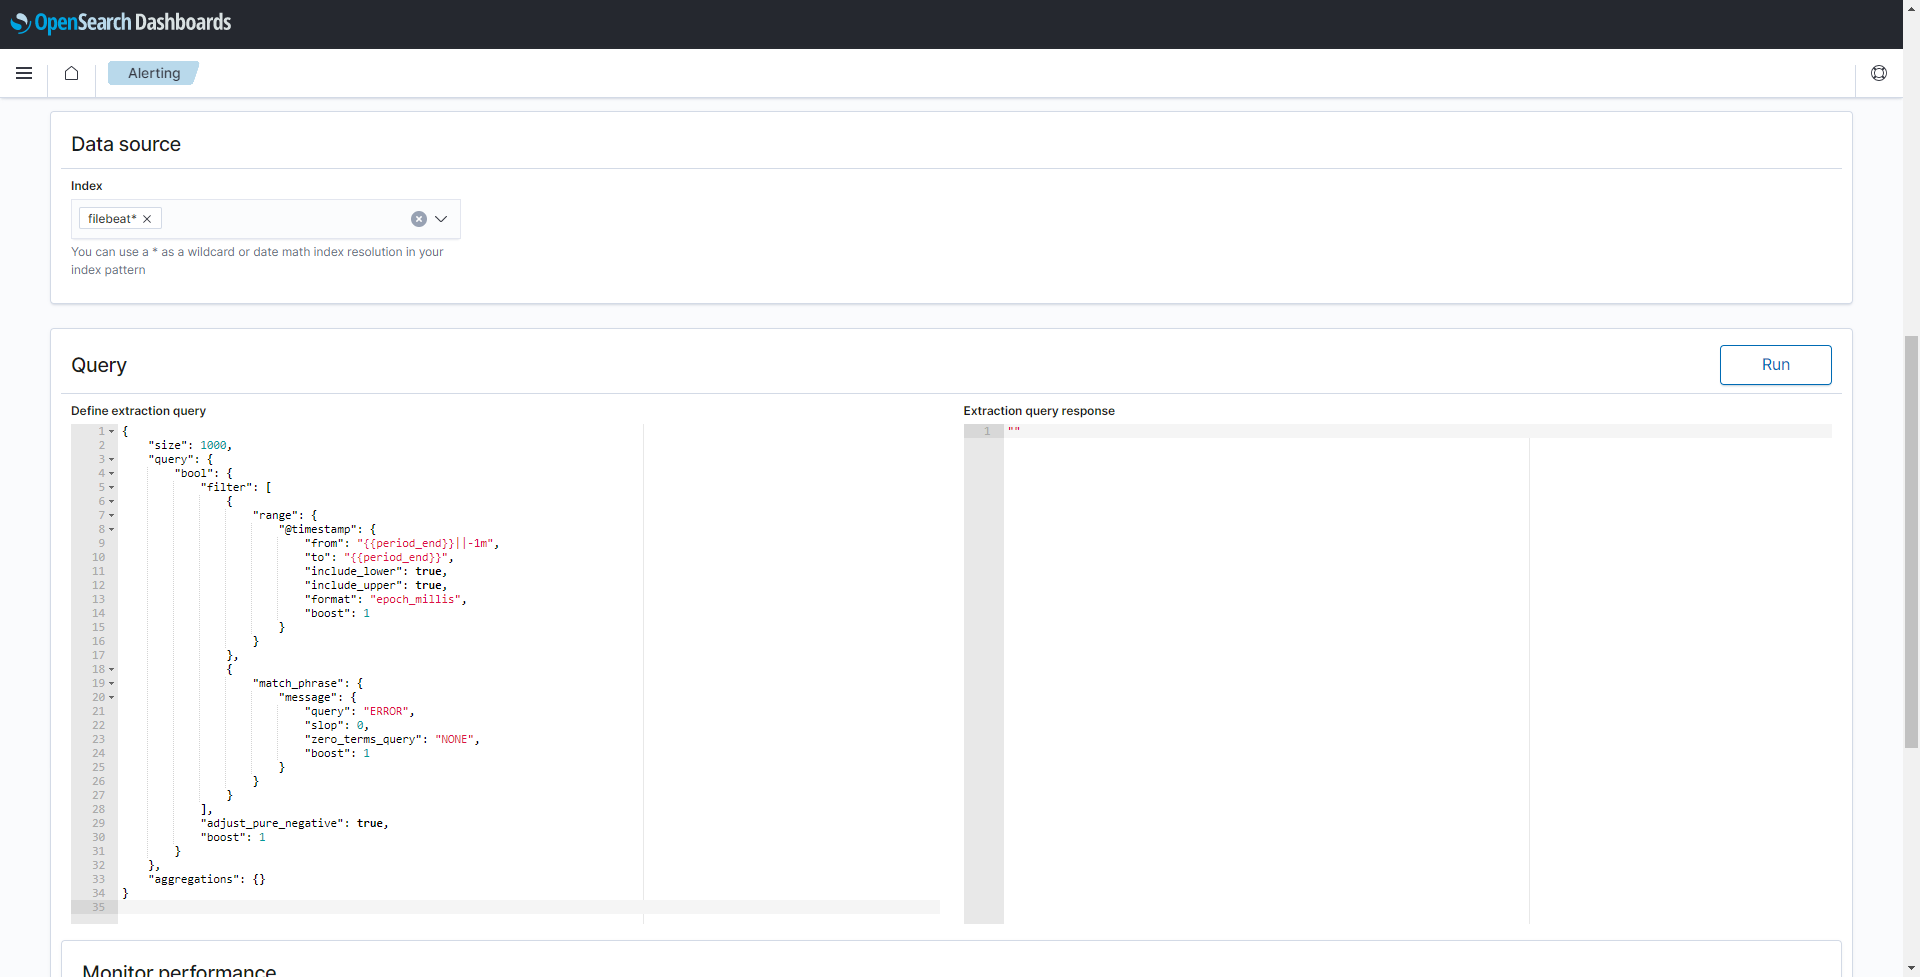
As mentioned above, the query detects log messages that contain the phrase ERROR in the last minute. Since it is executed every minute, it will detect each error only once. Continue with the next section to configure a trigger with a corresponding action.
Setting trigger and action
The trigger condition controls when notifications are sent through the notification channel. The condition is using the results of the query which was set up in Setting up a monitor above.
When the monitored event is triggered, an action is performed as a result. In this example, an e-mail is sent to the notification channel that was created in Setting up a notification channel above.
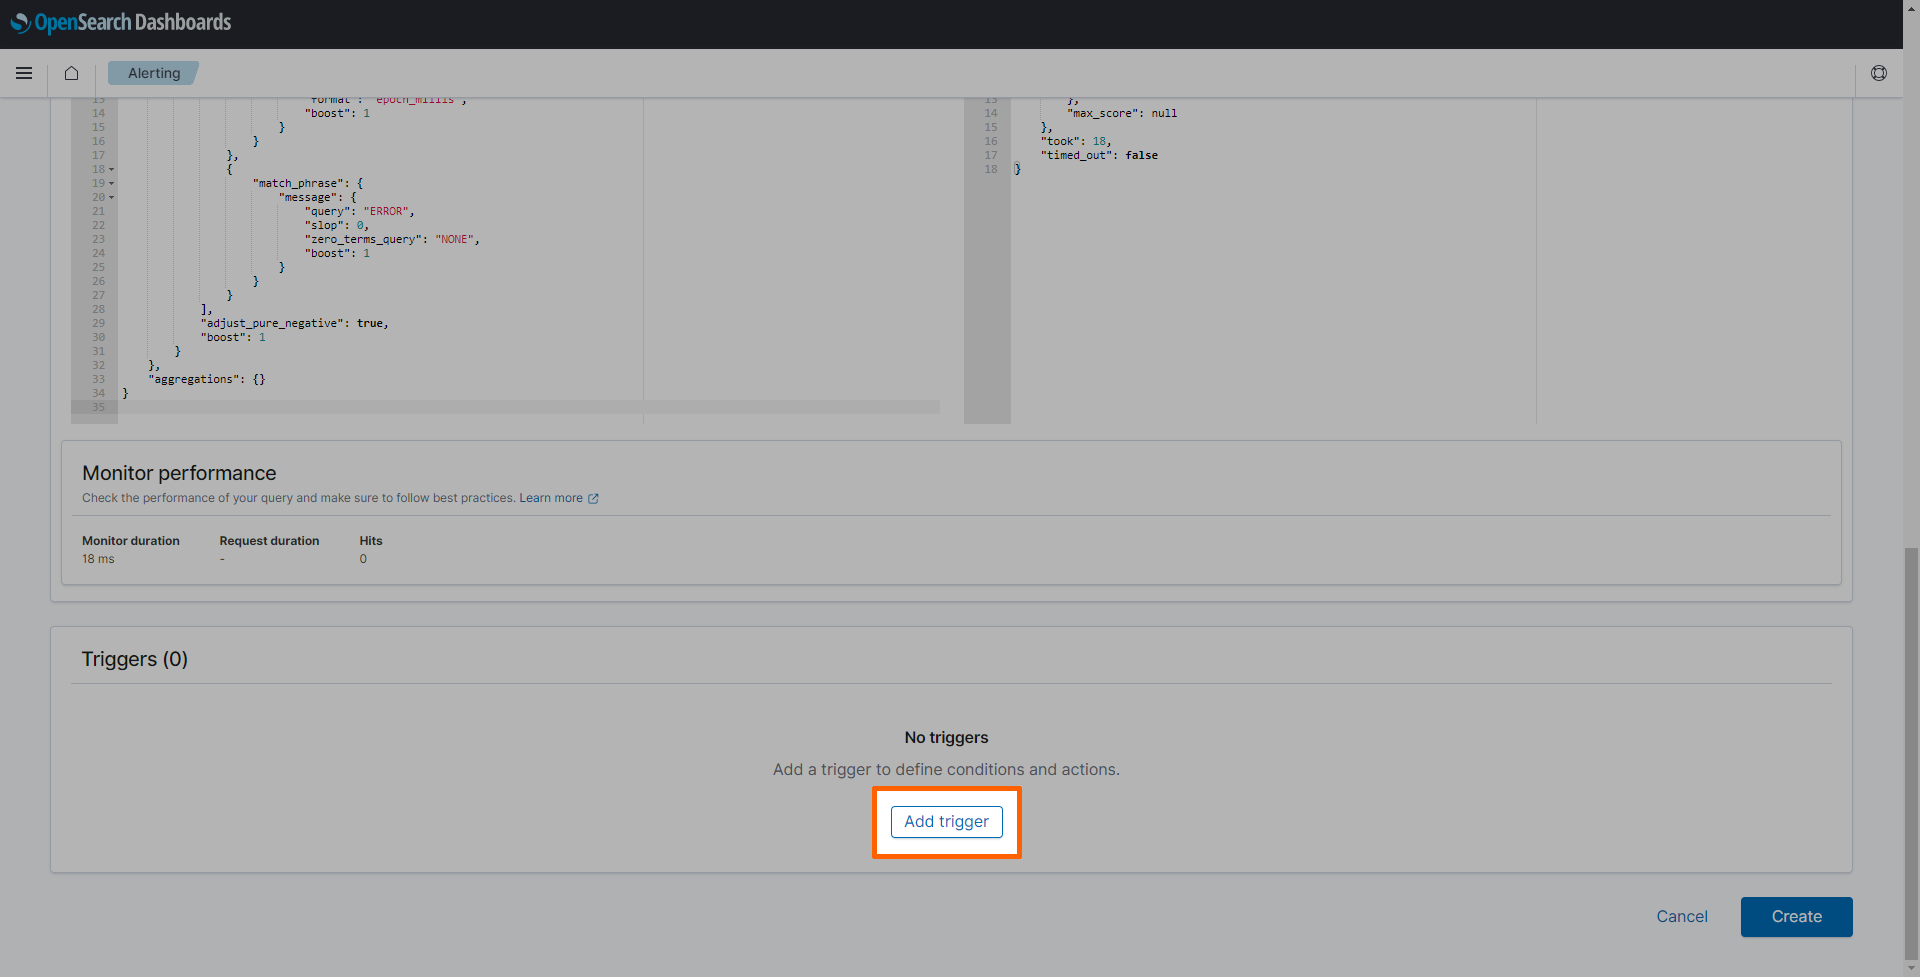
-
Select Add trigger.
-
Enter a Trigger name. This example uses
docs-trigger. - Select the desired Severity level from the drop-down menu.
-
Define a trigger condition. For this example, the condition is set to trigger if there are more than five errors detected in the last minute:
ctx.results[0].hits.total.value > 5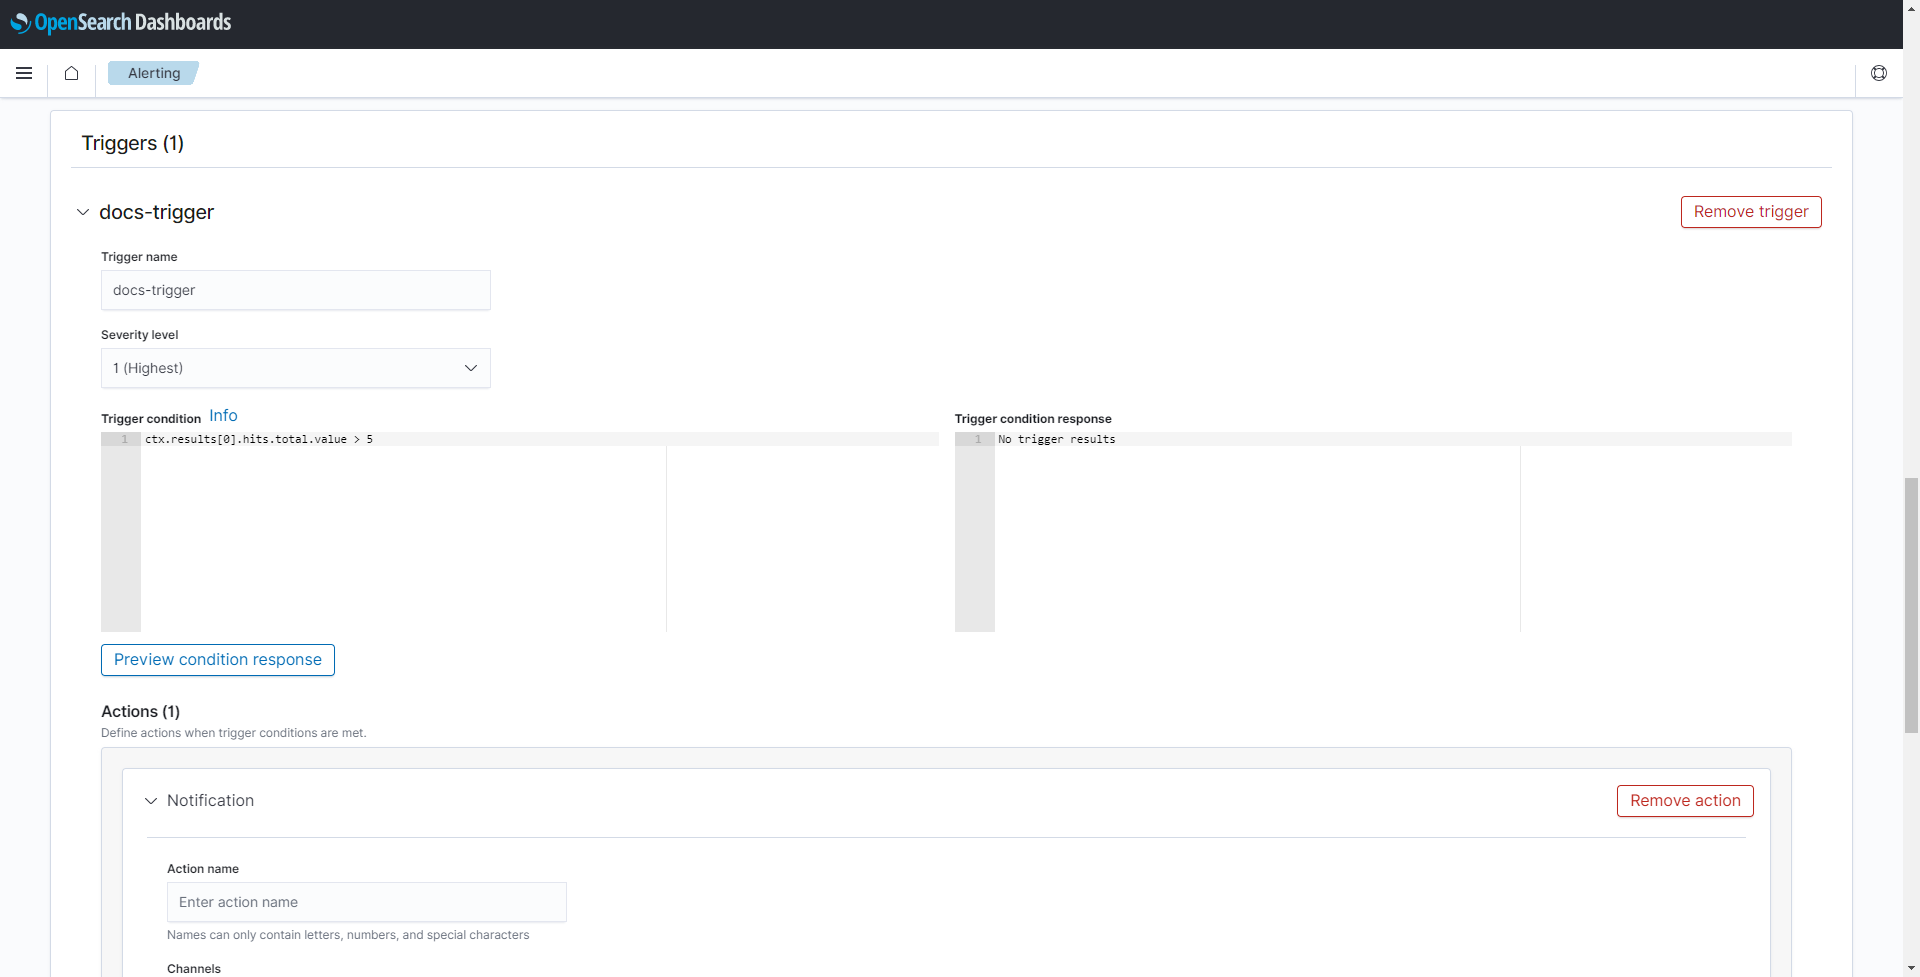
-
Scroll down to reach the Actions (1) section.
-
Enter the following information:
Setting Value and description Action name Enter a name for the action. This example uses alerting-action.Channels Select the channel that was created in Setting up a notification channel above. This example uses docs-channel.Message subject Enter a message subject that will be the subject of the e-mail notification. Message Enter a message in the Message field that will be the body of the e-mail notification. Some information using variables is already pre-filled. Refer to OpenSearch documentation for more information on how to use variables in the message. 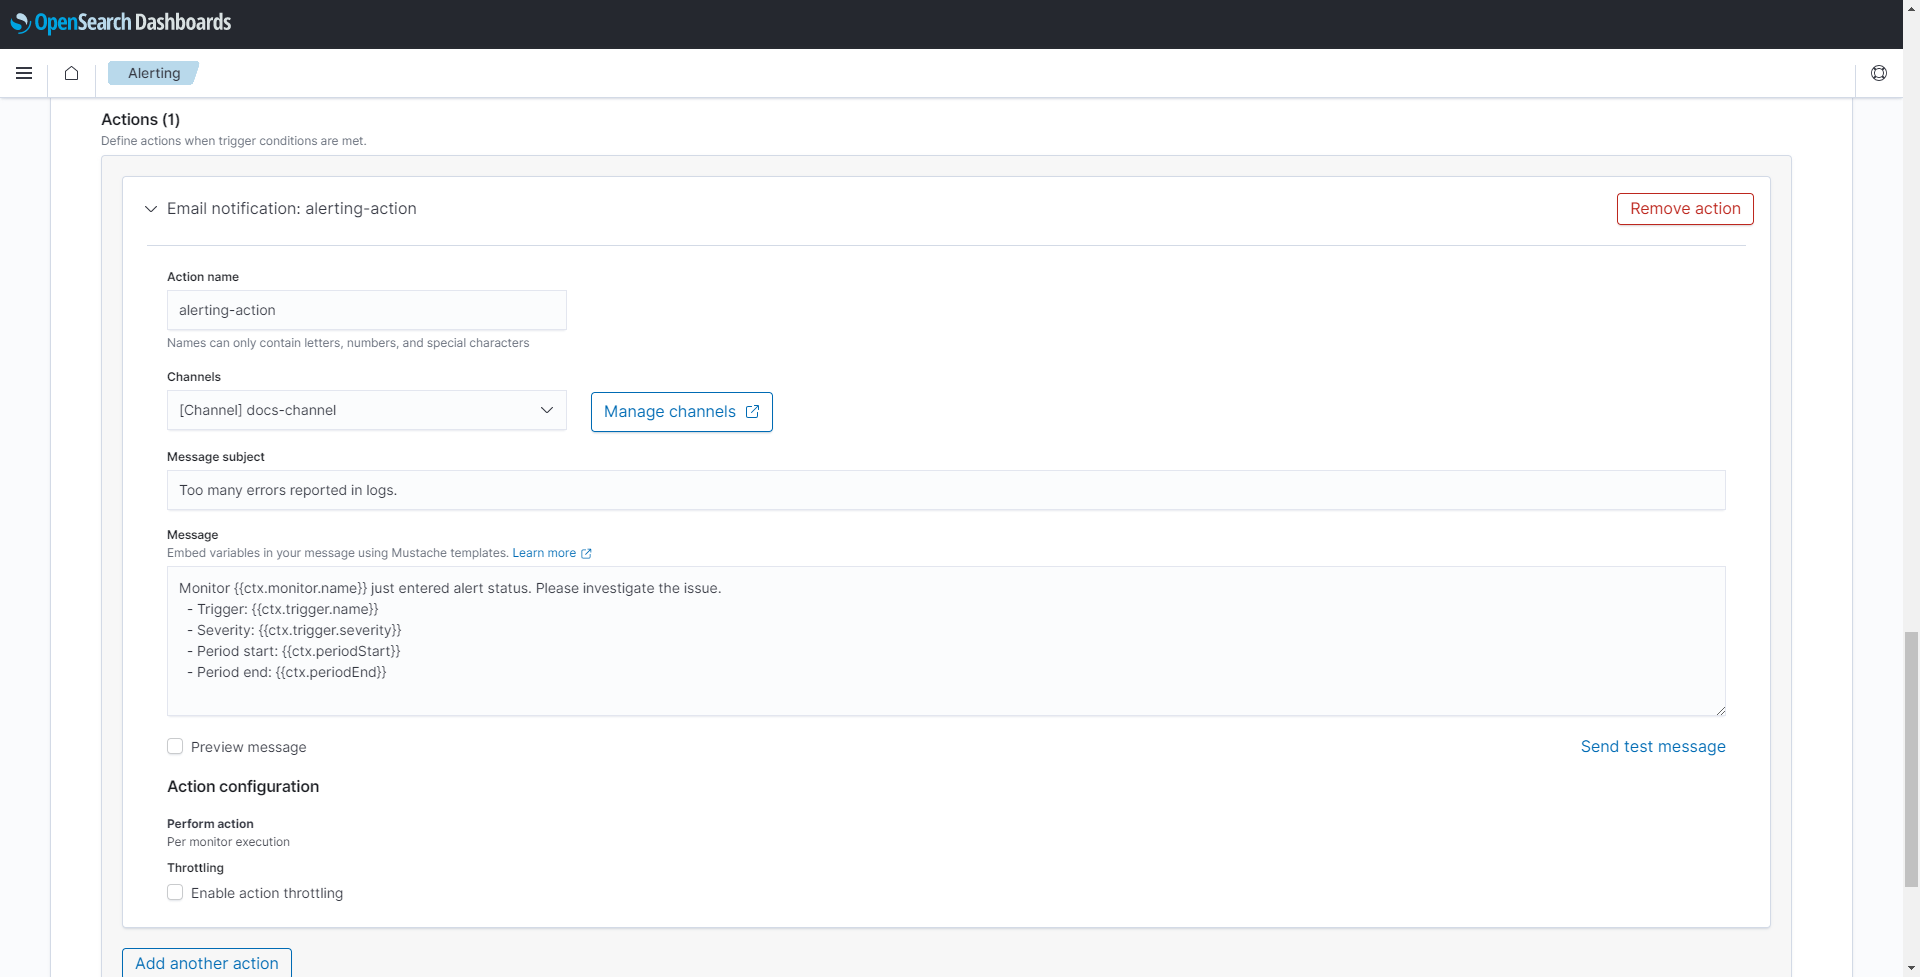
-
Select Create at the bottom of the page.
With this, a monitor based on a query is created that is executed every minute and detects all log messages containing a key word or phrase. An alarm is triggered if more than five messages per minute are detected and an e-mail with error details is sent to a recipient group.