Nerve Data Services
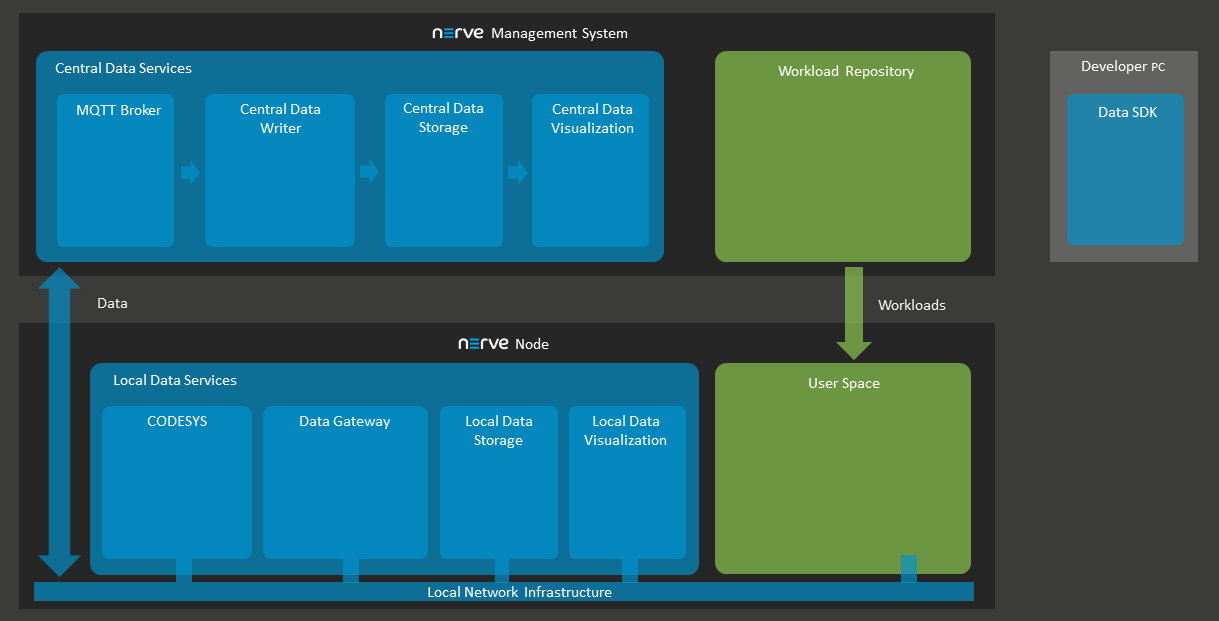
The Nerve Data Services are a collection of services and interfaces that allow to collect, store, analyze, visualize and distribute data. These services and interfaces are available on the Nerve node and in the Management System. Using Nerve Data Services, data can be collected at high speeds on the node and stored, processed or visualized locally at the Node or centrally in the Management System.
Elements of Nerve Data Services
Most of the above elements are individually configurable. This allows for an application in a large number of scenarios and use cases. However, this also implies deeper knowledge of the elements and their possible interactions. Further explanations of the elements can be found in separate chapters.
Features
The table below provides an overfiew of features in the Nerve Data Services.
| Feature | Description |
|---|---|
| Nerve Data Services Gateway | The Gateway is the central application of the Data Services. Its purpose is receiving data from a source via a certain protocol on an input interface and forwarding it to a destination using a different protocol on an output interface. This behavior is reflected in the user configuration as well. In general, the configuration consists of inputs, outputs and connections between them. |
| Graphical configuration tool | The Gateway is configured through a graphical user interface. Inputs, outputs and connections have custom options available, where mandatory fields are marked. The configuration interface also allows the export of existing configurations and the import on the same node or different nodes. |
| Supported protocols | The Nerve Data Services can collect data from multiple protocols and formats. This also includes multiple Ethernet-based fieldbus protocols. Data can also be distributed again in different formats via multiple protocols. Fieldbus protocols are read through the I/O port (if available, depending on the Nerve Device) while other inputs can be read through external inputs or installed workloads on the node. Here is a list of supported protocols: Fieldbus protocols
|
| Continuous data transfer | The Gateway can, under certain circumstances, ensure continuous operation for existing inputs and outputs when new configurations are applied. This is done through the application of a smart connection creation mechanism. When adding new data connections in the Gateway, existing inputs and outputs that are not affected by the changes will continue their operation uninterrupted while the Gateway creates the data connections. When applying the updated Gateway configuration, the configuration UI will give a warning message, including a list of connections affected by the update that will experience a short data flow interruption. |
| Data buffering | Data buffering is a guarantee that data will always reach the Management System even when a node is connected to an unstable network. When this feature is enabled, data is buffered into persistent local storage first and then sent to the Management System in chunks. Once the connection to the Management System is restored, all locally stored data is sent to the Management System. This slows down the insert rate for very fast data sources but in exchange provides a strong guarantee that no data is lost. Refer to NerveDB with data buffering for an example on how to use the data buffering feature. |
| NerveDB | The NerveDB is a custom TimescaleDB that is pre-configured for use with Nerve. As such, it has minimal need for configuration. An instance of the NerveDB is available locally on the node and centrally in the Management System. |
| Visualization | Data stored in the Data Services can be visualized via Grafana, an open source web application which provides charts, graphs and alerts for data visualization. An instance of Grafana is available on each node and in the Management System to visualize data stored in databases on the node or in the Management System. |
| Sending data to third party clouds | The Nerve Data Services are designed to seamlessly communicate with other third party cloud environments. Microsoft Azure IoT Hub is supported out-of-the-box. It is also possible to configure the Nerve Data Services to provide data to other third party cloud providers. |
| High data ingestion | The Nerve Data Services allow a data ingestion rate into the local storage of up to 100,000 data points per second. |
| Custom JSON format | The Nerve Data Services Gateway supports receiving user defined JSON data formats on all receiving interfaces. Similarly, data can also be sent in custom JSON formats. |
| Data Services SDK | The Nerve Data Services SDK enables users to create applications that can be deployed as workloads on Nerve nodes. The implementation of the application is up to the user and can range from data analytics to protocol conversion or any other application implemented in Python. The SDK provides a command-line tool that allows creating, building, pushing and provisioning applications as Docker containers. It also includes an API implemented in Python that simplifies accessing data collected by the Nerve Data Services Gateway or inserting new data into the Nerve Data Services. |
Workflow
The following section gives an overview of a typical workflow, presenting what can be done with the Nerve Data Services on a high level:
- Setting up data sources
- Configuring the Gateway to collect data and defining where to distribute it
- Configuring Grafana on the node for local data visualization
- Configuring Grafana in the Management System for central data visualization
- Implementing an analytics app and configuring the Gateway again to send data to the analytics app
- Reconfiguring Grafana to visualize the result of the processing performed by the analytics app
The paragraphs below give short explanations to each step.
Ingesting data on the node
When ingesting data on the node, the data is received by the Gateway which then distributes to various destinations. For data received from a fieldbus protocol, CODESYS will be used to translate it into OPC UA format. The Gateway then gets configured to collect the data from CODESYS and distribute it further.
Distributing data on the node
Data is distributed by the local Gateway to user defined consumers. Unless the respective protocol of a Gateway output defines a specific data format, all data received by the Gateway is normalized to the Nerve Data Services data format. Typical consumers of data are the local data storage on the node or the central data storage in the Management System, third party MQTT brokers or applications, or providing the data as OPC UA Server. To enable reuse of local Gateway configurations across multiple nodes, keywords can be used to abstract node specific information from the configuration.
Storage on the node
Data is stored in the NerveDB on the node, a dedicated TimescaleDB database. Any application running on the node can access data stored in there. A time window (data retention time) can be configured for how long data shall be kept before deleting it. For application development, a Python API is provided in the Data Services SDK that simplifies reading and writing data.
Visualization on the node
Visualization is available via Grafana which is pre-configured to allow access to data stored in the local data storage. It is also possible to configure access from Grafana to other user defined data sources without any restrictions, meaning that data not stored in the local database of the Data Services can also be visualized.
Using Data in analytics
A Python SDK is available for creating custom analytics applications. The API of the SDK simplifies reading data from the local storage or receiving it directly from the Gateway when it arrives there. The API also allows to write back analytics results to the local storage for visualization or send it to an MQTT broker to distribute it to other consumers. It is also possible to use third party applications such as NodeRed or Crosser for analytics together with the Nerve Data Services.
Storing and visualizing in the Management System
Data received on the Node can be forwarded to the Management for visualization. To allow this, the local Gateway and the central visualization must be configured. Each node is represented as a separate data source in the central visualization (Grafana).
Data Services UI
The Data Services are present on both the node and the Management System. However, the instance on the node is the single point of configuration. Connections to the Management System components of the Data Services are configured automatically.
On the node, the UI consists of the Gateway configuration tool, the database configuration and the local visualization (Grafana). In the Management System, the Data Services UI includes the database configuration and the central visualization (Grafana).
Also, note that by default, the permission to access to Data Services in the Management System is not granted. Users that have the permission to create user roles can enable the Data Services entry in the navigation by adding the UI_NAV_DATA_SERVICES:VIEW permission to a user role. Refer to Users for information on how to create new users and to Roles and permissions for information on how to add a new role.
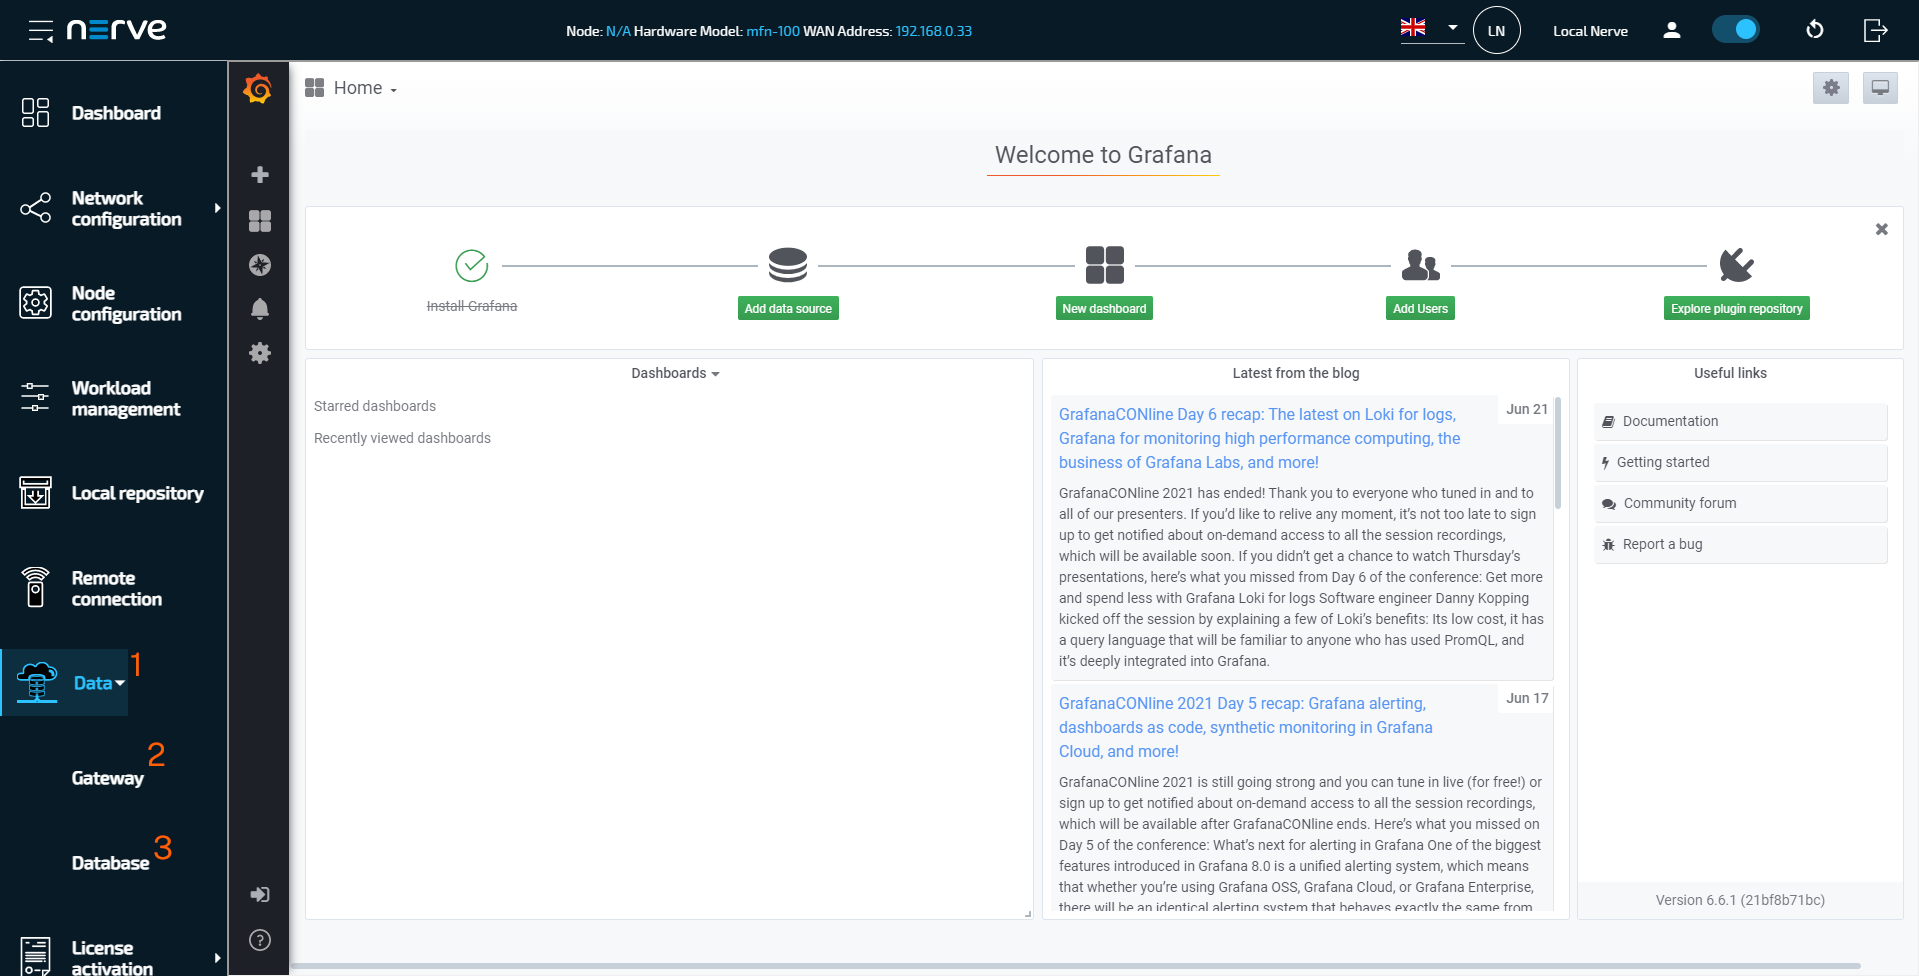
On the node, select the arrow next to Data in the navigation on the left to reach the Data Services UI. This will show the following items:
Note
Note that the navigation on the left collapses when Data is selected. Select the burger menu in the top-left corner to expand the navigation menu again.
| Item | Description |
|---|---|
| Data (1) | Clicking here opens the visualization component of the Data Services and the Grafana landing page is displayed. For more information on visualization, refer to Data Visualization. |
| Gateway (2) | Select this to reach the Gateway configuration tool. The Gateway is the single point of configuration for data connectivity in the Nerve Data Services. Configure inputs, outputs and connections here. Refer to Nerve Data Services Gateway for more information. |
| Database (3) | Data from the Nerve Data Services database can be previewed here. Every node has a local NerveDB database. In the Management System, the NerveDB databases of the nodes are discerned by the serial numbers of the nodes. This view allows to get a basic preview of the data in the Nerve Data Services storage. It also allows to configure the data retention time for the data stored there. Refer to Database for more information. |
Since the single point of configuration in the Data Services is the instance on the node, the Data Services UI in the Management System does not show the configuration menu item.