Logging and monitoring
Data is gathered for Docker workloads and system parameters regarding resource usage. Metrics are then sent to OpenSearch in the Management System and visualized in OpenSearch Dashboard. Logging and monitoring options can be configured for each node in the node details screen in the Management System:
- Log in to the Management System.
- Select Nodes in the navigation on the left.
- Select the node tree tab.
- Select a node in the node tree.
-
Select LOGS AND METRICS.
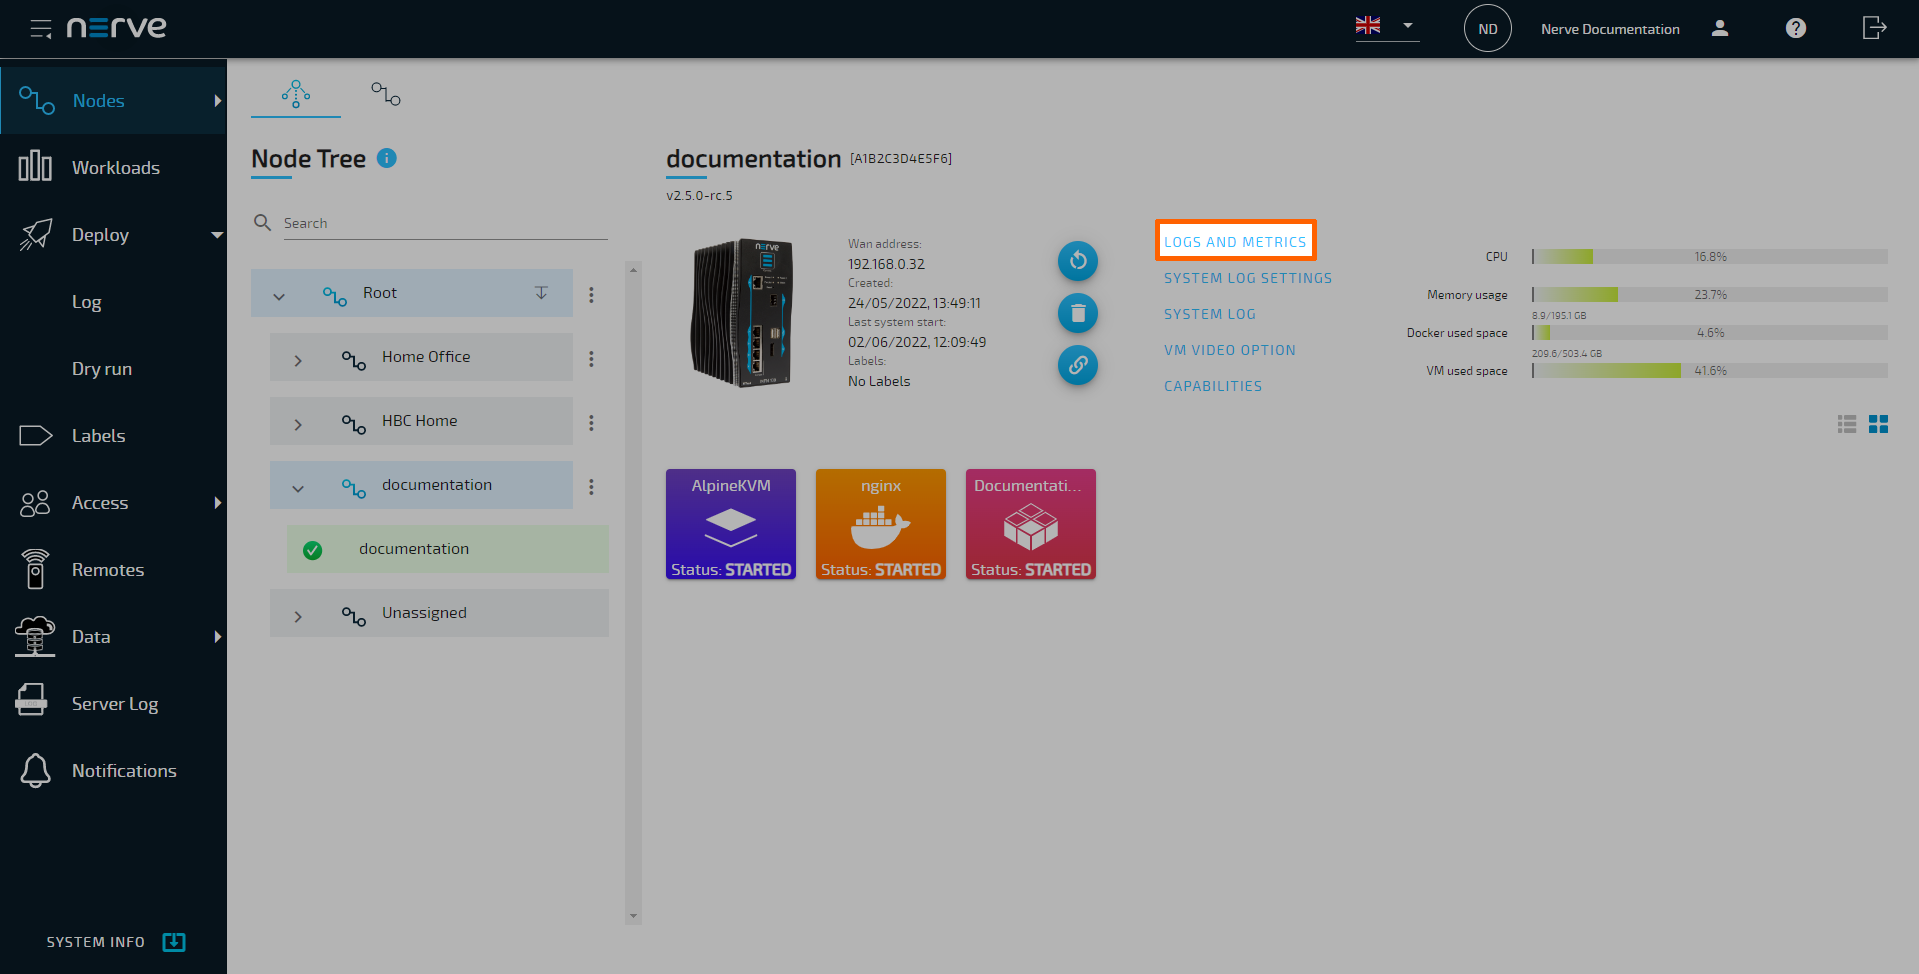
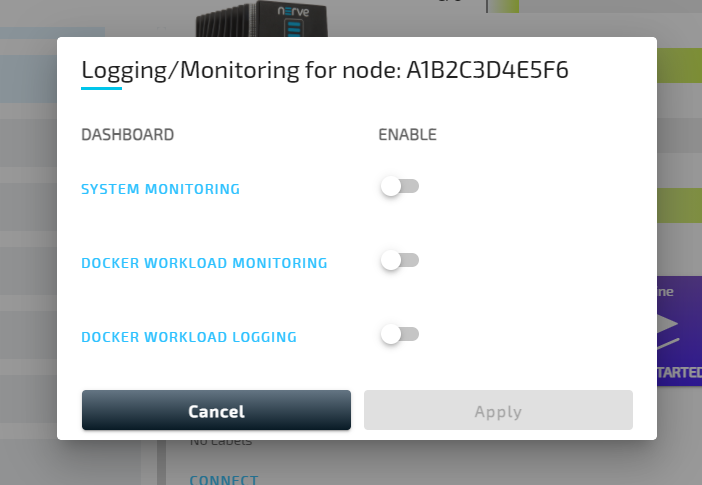
From here, toggle the corresponding slider of a dashboard on the right and select Apply to enable logging or monitoring on that node. The dashboards can be accessed by selecting the dashboard name on the left. A new browser tab opens, displaying the selected dashboard. Note that all dashboards are also available if the node is offline.
Note
Some OpenSearch knowledge could be beneficial when working with the dashboards. Refer to the official OpenSearch documentation for more information on OpenSearch.
System monitoring
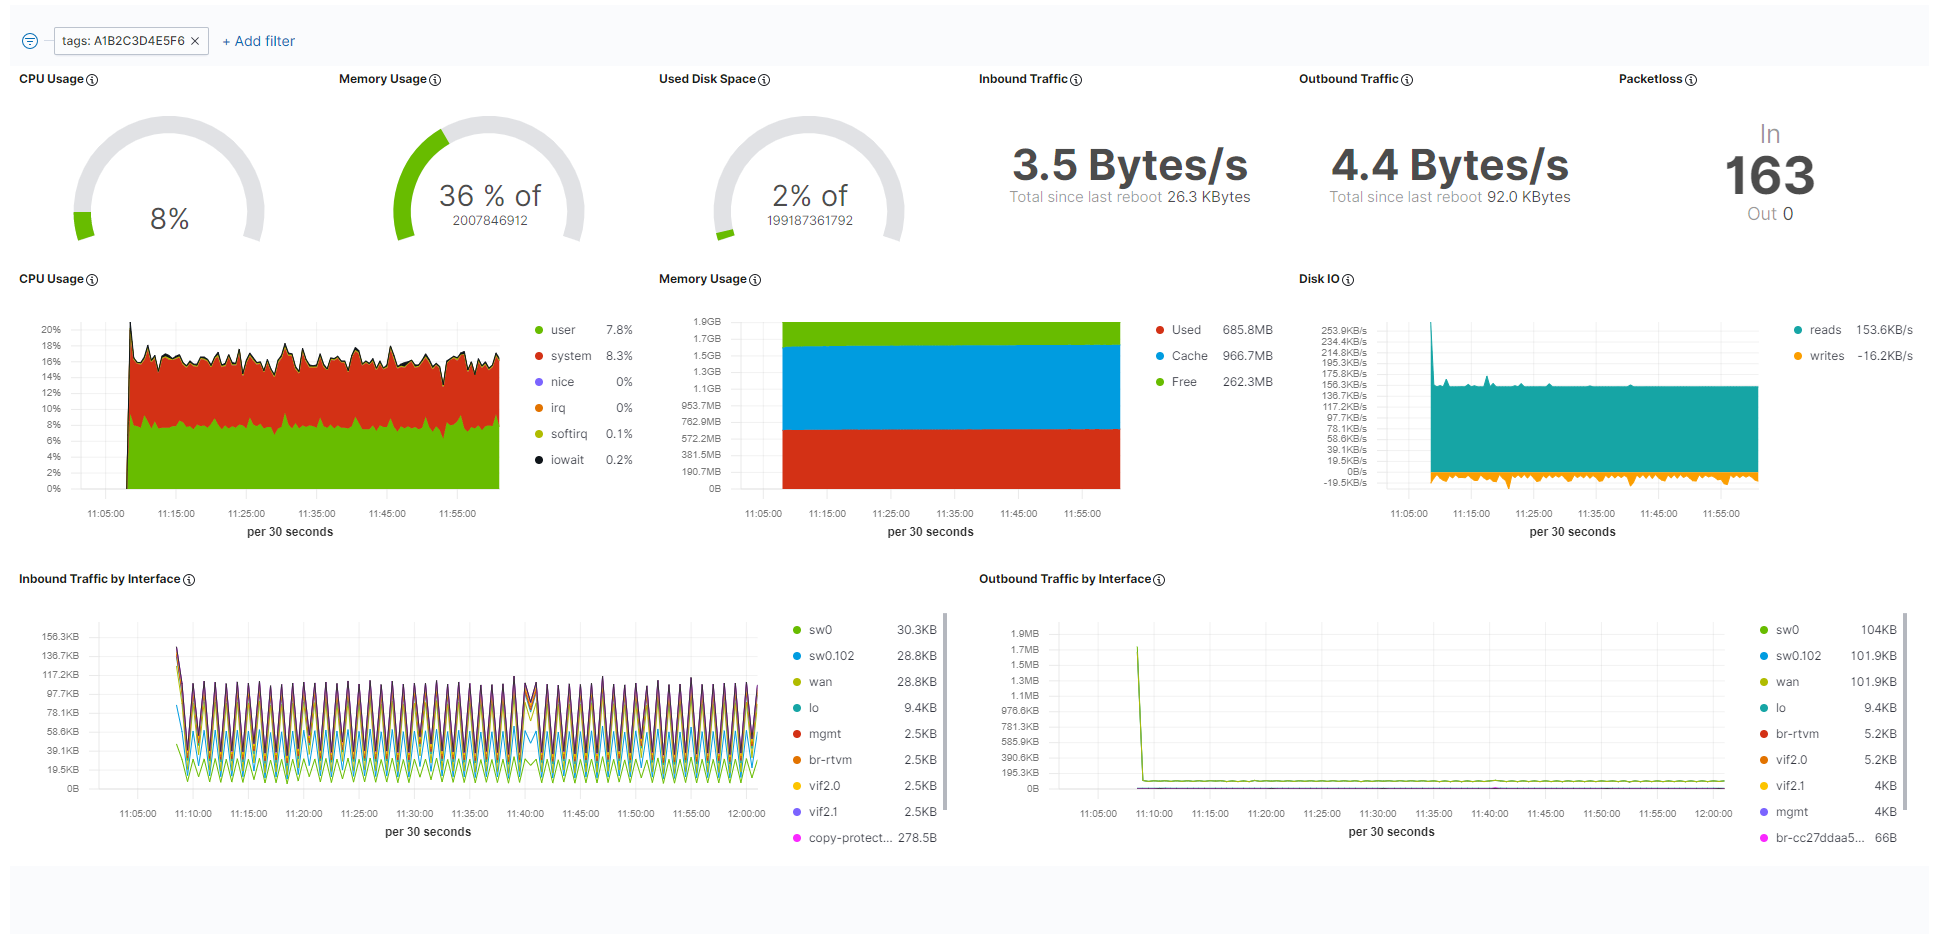
Resource utilization of the system as a whole is tracked when system monitoring is enabled. Refer to the screenshot and the table below for more information on the data that is gathered and displayed. Toggle the SYSTEM MONITORING slider to enable the tracking of system data.
| Item | Description |
|---|---|
| CPU Usage | Gauge chart This chart displays the currently used total percentage of the CPU. Line graph The line graph displays the CPU usage in percent over time. Data is displayed scaled over time. In general, the data displayed here is according to how CPU usage is understood in Linux. For an explanation on how CPU usage is handled in Linux, refer to this link. |
| Memory Usage | Gauge chart This chart displays the currently used total percentage of memory, as well as the total memory available in byte. Memory used for virtualization is not included. Line graph The line graph displays the total amount of memory used over time. Data is displayed scaled over time. Memory used for virtualization is not included. |
| Used Disk Space | This graph displays the currently used total percentage of disk space on the host, as well as the total disk space available in byte. |
| Inbound Traffic | This is the current amount of incoming data, as well as the total amount of data transferred since the last reboot. |
| Outbound Traffic | This is the current amount of outgoing data, as well as the total amount of data transferred since the last reboot. |
| Packetloss | Here the number of lost incoming packets and lost outgoing packets is displayed. |
| Disk IO | This graph displays the amount of reads and writes on the disk. Reads show how much data per second has been read while writes show the amount of data that has been saved or deleted. |
| Inbound Traffic by Interface | This is the amount of incoming data over time. The list to the right of the graph shows the average amount of traffic per interface. Note that this list also includes internal interfaces in this version. |
| Outbound Traffic by Interface | This is the amount of outgoing data over time. The list to the right of the graph shows the average amount of traffic per interface. Note that this list also includes internal interfaces in this version. |
Docker workload monitoring
Metadata of the overall state of Docker workloads is gathered in the Management System. A list of installed containers and their resource utilization is displayed in this dashboard. Toggle the DOCKER WORKLOAD MONITORING slider to enable the tracking of Docker workload data.
| Item | Description |
|---|---|
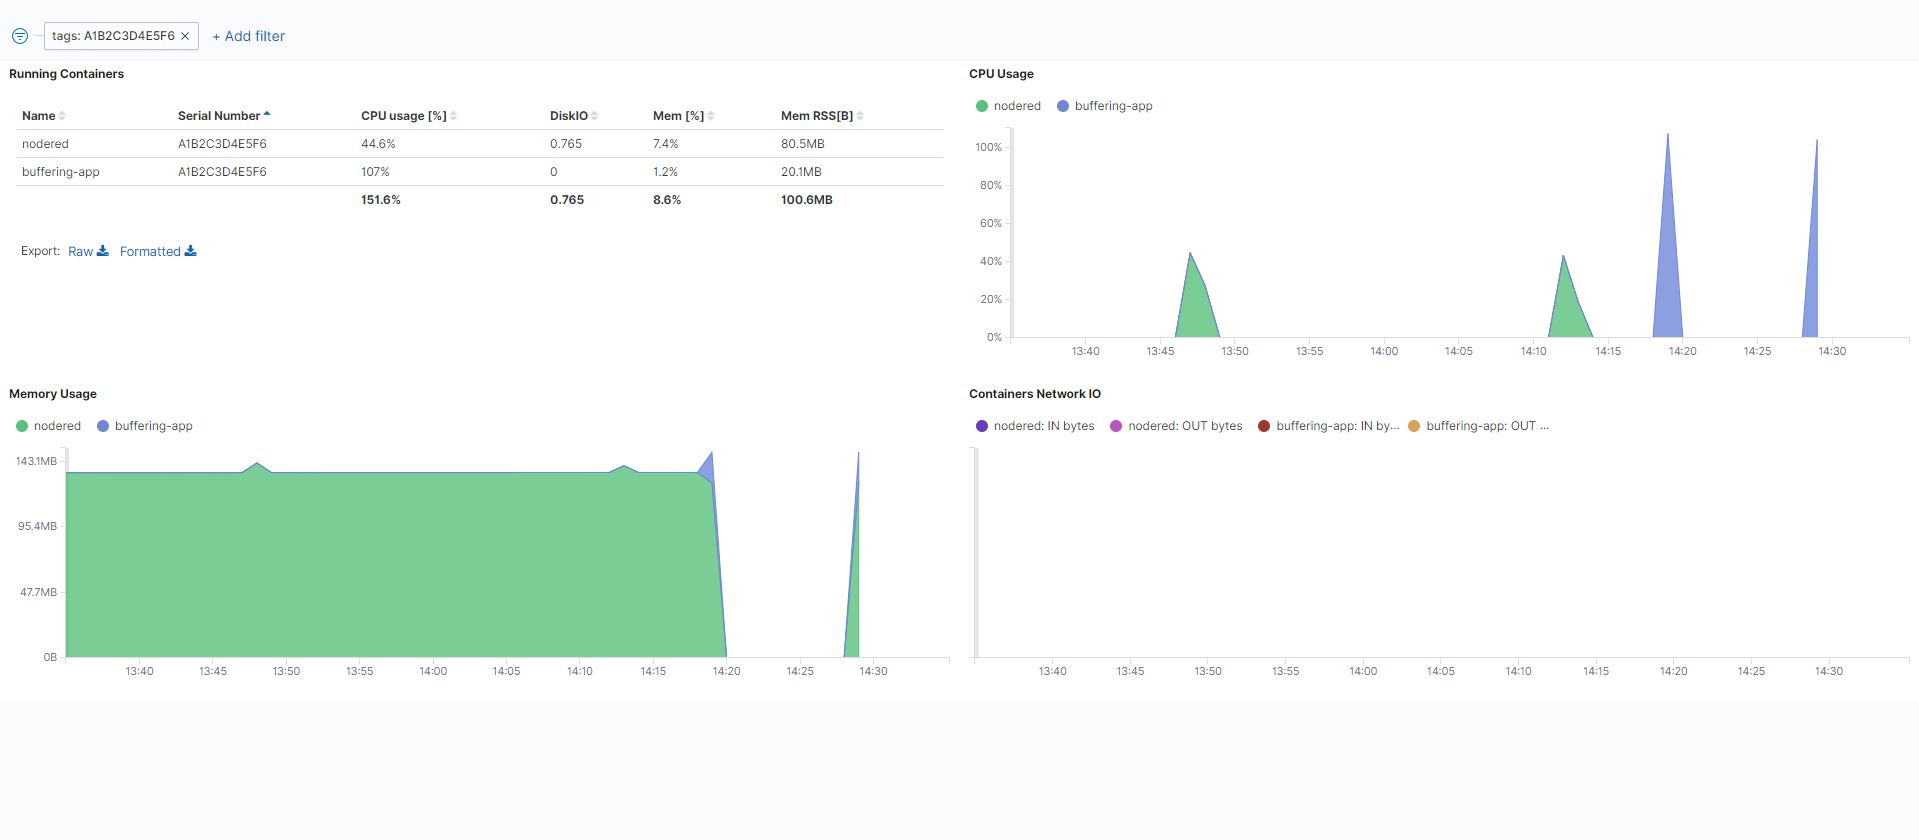
| Running Containers | This is a list of user-installed Docker containers with details. Name This is the name of the Docker container as defined with the Container name setting when provisioning the workload. Serial Number This is the serial number of the current node. CPU usage [%] This is an average value of how much of the total CPU a Docker workload has used. DiskIO This is the sum of reads and writes over the defined timespan. Mem [%] This is an average percentage of how much of the total memory a Docker workload has used. Mem RSS[B] This is an average value of how much resident set size (RSS) memory a Docker workload has used. Refer to this link for a general explanation on RSS. |
| CPU Usage | This is a graph of CPU usage in percentage over time. Note that the percentages here are in relation to the total amount of available CPU. Also, the display behaves according to standard OpenSearch Dashboard behavior, meaning that CPU usage might be displayed as being at zero even though the CPU is busy. This is due to the graph showing only new data coming in and disregarding values that stay constant over a certain amount of time. |
| Containers Network IO | This is a graph showing the incoming and outgoing data for each container over time. Inbound and outbound traffic are marked separately per container. |
| Memory Usage | This is a graph of the total amount of memory used over time. |
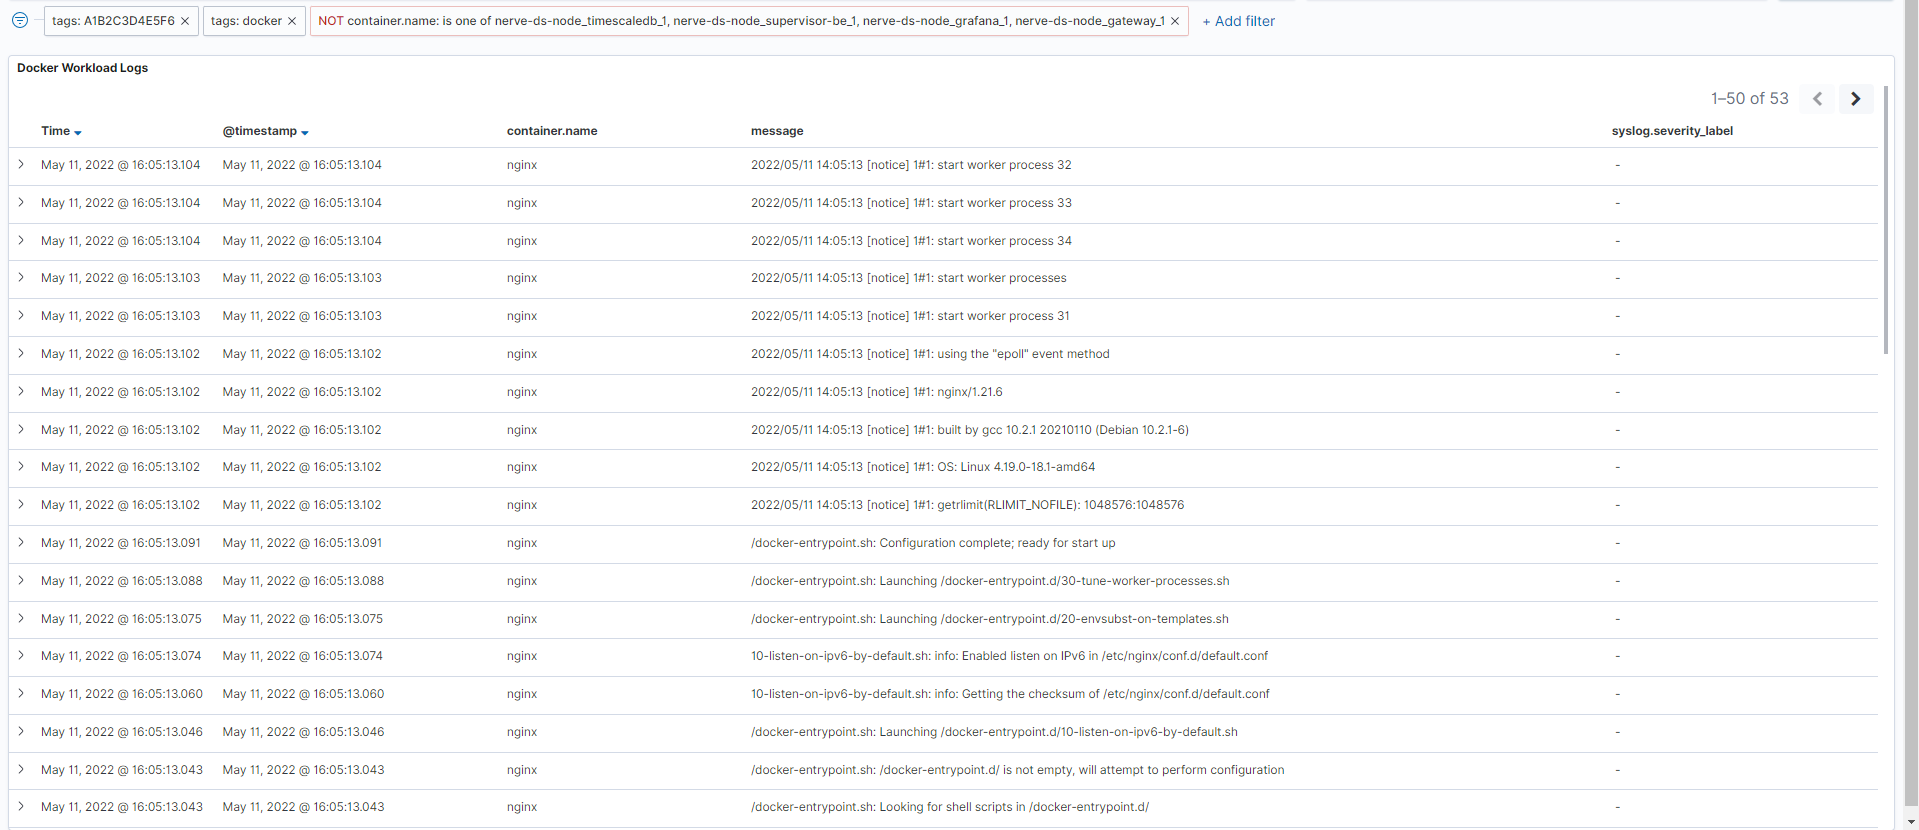
Docker workload logging
The logs of the Docker workloads on a node are collected in the centralized logging system, allowing the analysis of logs from multiple workloads and nodes. Logs are collected from the standard Linux streams stdout (for debug messages) and stderr (for error messages). So for user created workloads this means that logs need to be sent to these streams to be collected. Note that the logs are most suitable to be read by developers with expert knowledge and should also be configured by developers. Toggle the DOCKER WORKLOAD LOGGING slider to enable the tracking of Docker workload logs.
To display logs of a certain workload, collected logs can be filtered in the Docker workload logging dashboard in OpenSearch.