Data Visualization
Data stored in the Data Services can be visualized via Grafana, an open source web application which provides charts, graphs and alerts for data visualization. An instance of Grafana is available on each node and in the Management System to visualize data stored in databases on the node or in the Management System. This chapter describes only how Grafana is configured and how it can be accessed. Refer to the Grafana documentation for general information on how to use Grafana.
Note
To use Grafana, the user must be logged in to the Local UI or the Management System respectively. When logged out, Grafana is no longer able to perform its internal operations and reports random errors. To continue working with Grafana, close the browser tab, log in again at either the Local UI or the Management System, depending on which Grafana instance is being accessed, and re-open Grafana.
Central Data Visualization in the Management System
In the Management System, each registered node is represented as a separate data source in Grafana. The data source is created during the registration of a node. A data source is named after the node it represents, formatted as <nodename> (<serialnumber>). When creating a new panel, select the node which sent the data to be displayed as the data source. The name of the table must match the name provided in the Gateway configuration file.
- Log in to the Management System.
-
Select Data in the navigation on the left.
Note
If the menu item Data is not available, make sure the logged in user has the permission to access the Data Services. Refer to Assigning a role to a user for more information.
The navigation on the left collapses to show the home screen of Grafana. Here dashboards can be created as described below. Select the burger menu in the top-left to expand the navigation again. Note that the Grafana UI theme is set to light by default.
Access levels for Data Visualization in the Management System
Management System users are assigned Grafana permissions when they receive permissions to access the Data Services. The roles can be either viewer, editor or admin:
- Viewers can view dashboards in Grafana.
- Editors can view, create and edit dashboards.
- Admins can manage data sources and users.
Note that this is not recommended to do as Nerve components do this automatically.
Note
Users with the GRAFANA:ADMIN permission shall not delete the default admin user, as the system relies on it. If the default admin user is deleted, the assigned roles from the Management System will not work.
The Grafana Viewer role is given by default. To give a user the editor or admin role:
- Log in to the Management System.
-
Select Access > Roles in the navigation on the left.
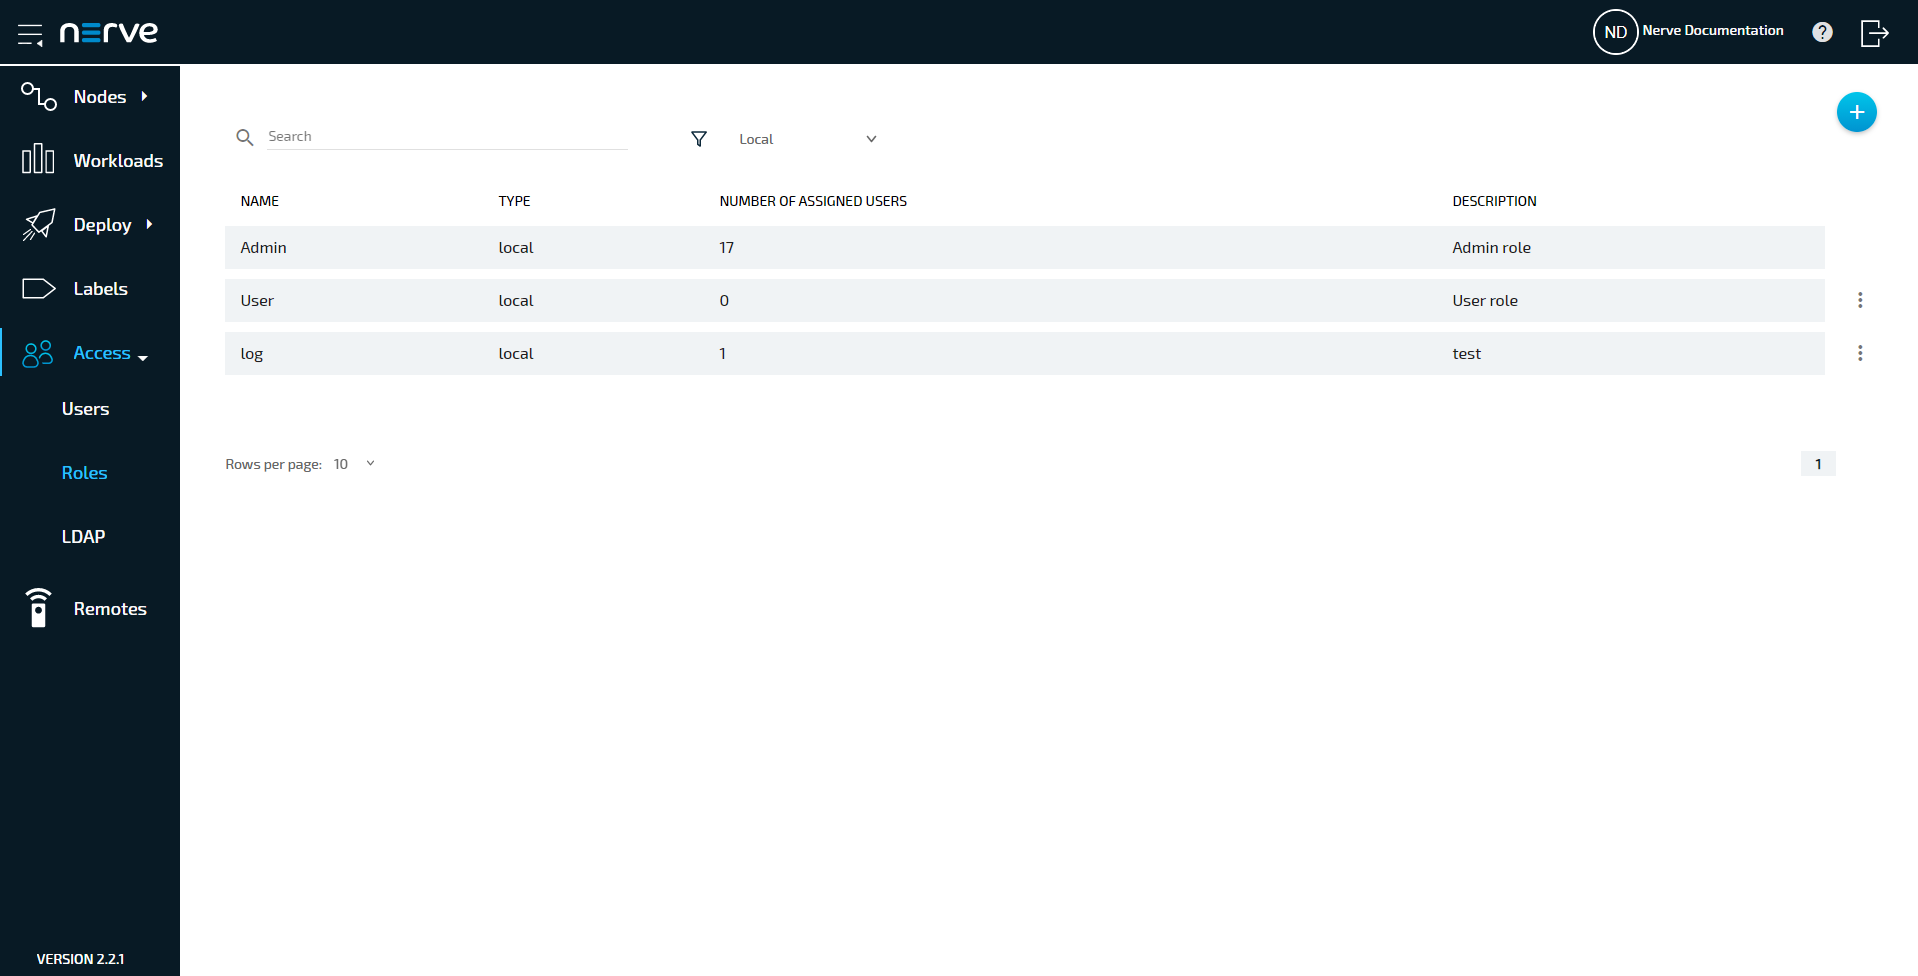
-
Select the role that has permission to access the Data Services.
-
Make sure that Access Data services Feature Preview is checked.
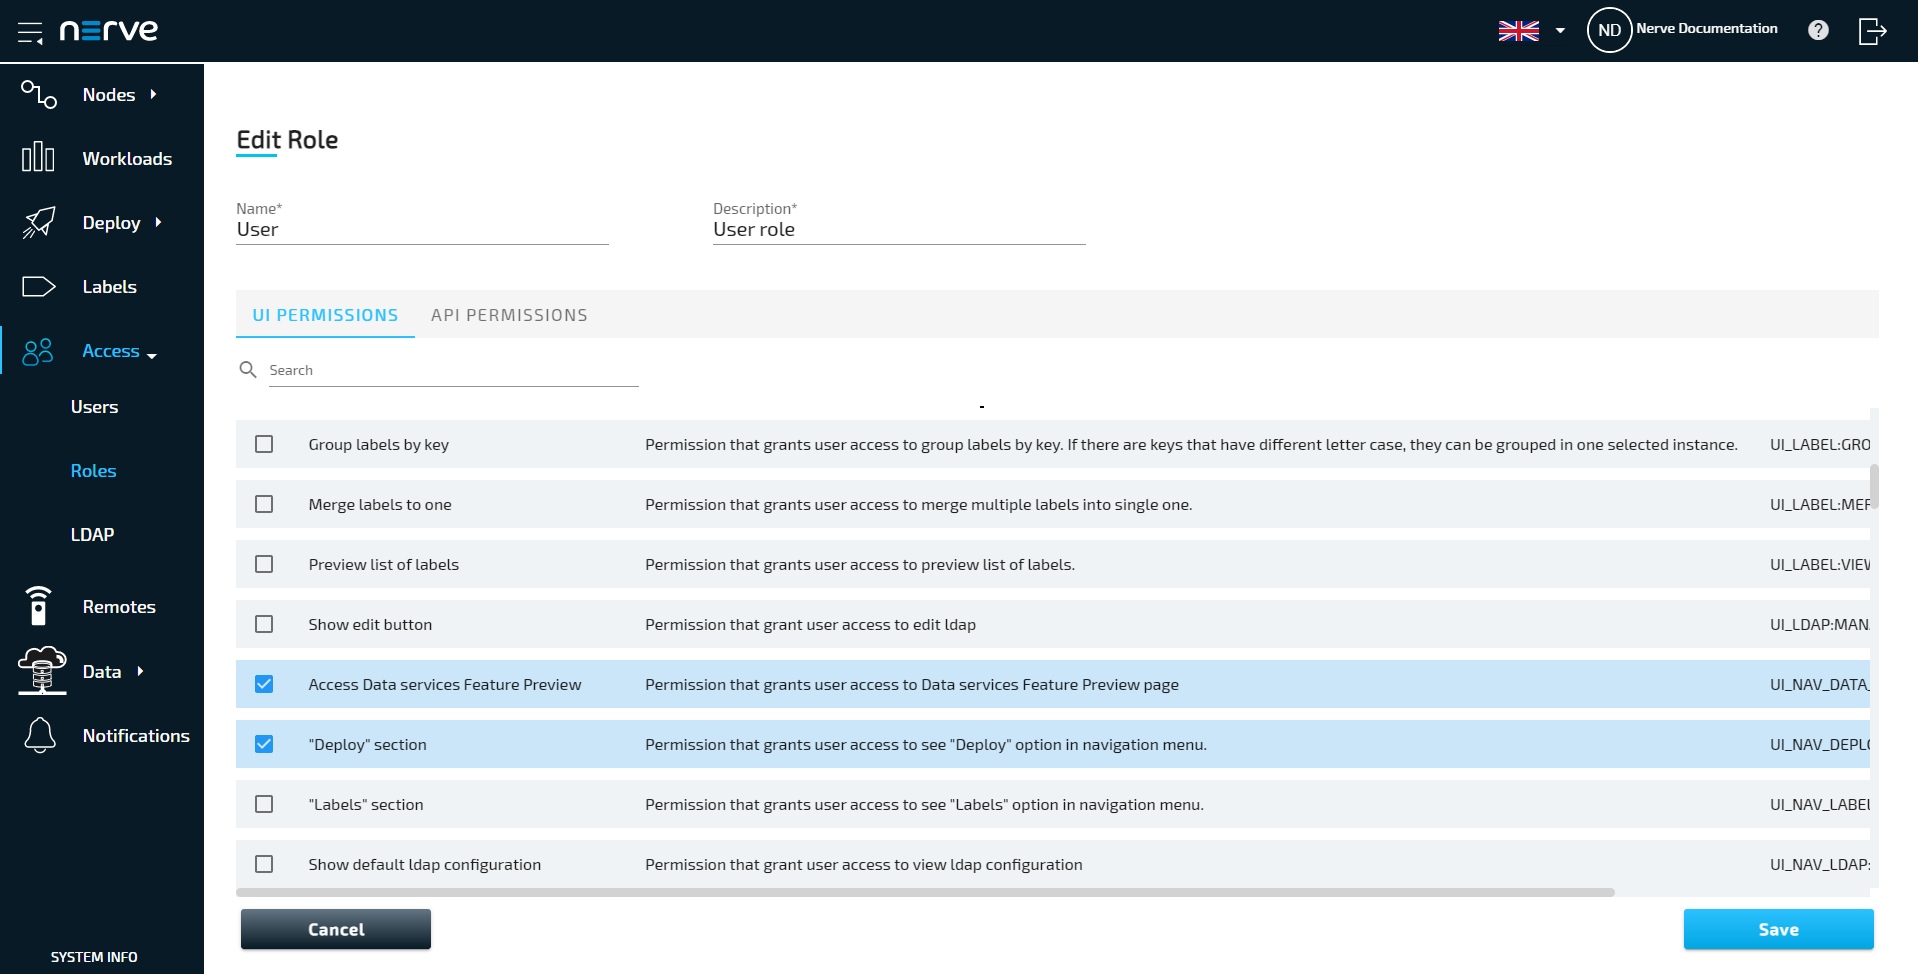
-
Select the API PERMISSIONS tab.
-
Look for GRAFANA:ADMIN and GRAFANA:EDITOR
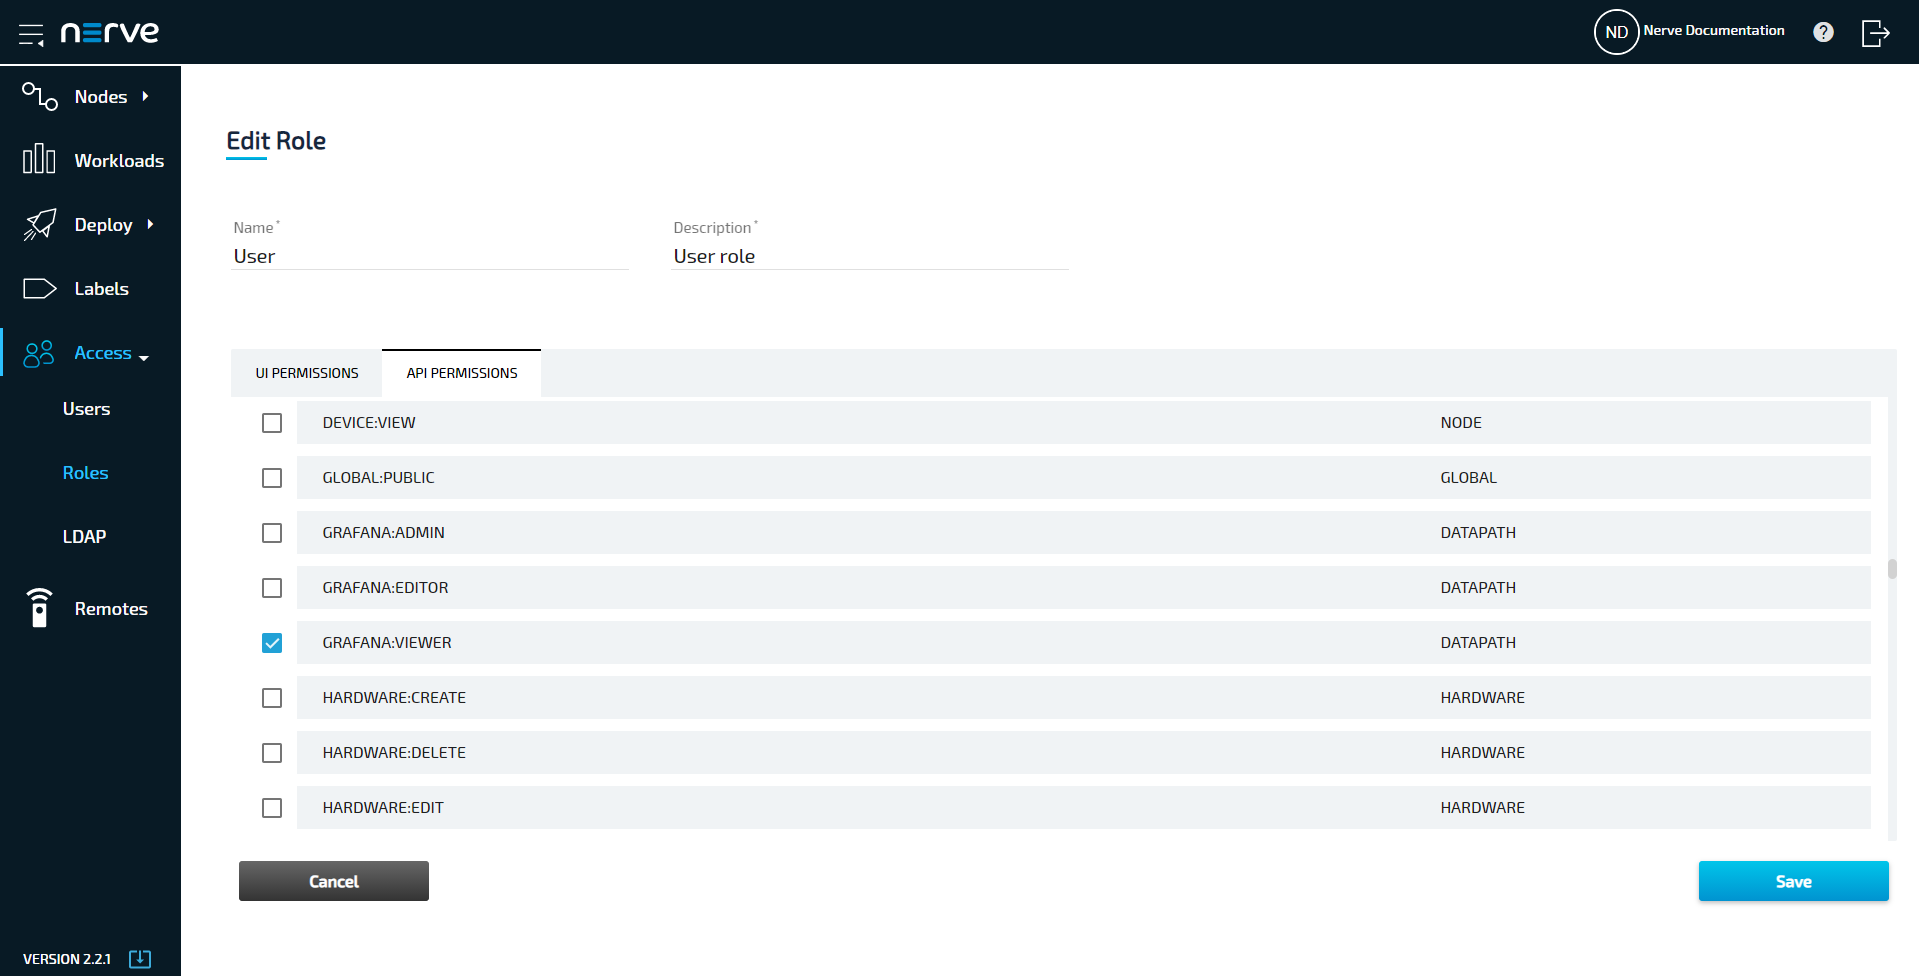
-
Select the desired permission.
- Select Save
Local Data Visualization on the node
On the node, only a single data source exists in Grafana, formatted as <serialnumber>. Use this data source in all panels to visualize data received by the Data Services.
-
Access the Local UI on the node. This is Nerve Device specific. Refer to the table below for device specific links to the Local UI. The initial login credentials to the Local UI can be found in the customer profile.
Nerve Device Physical port Local UI MFN 100 P1 http://172.20.2.1:3333 Kontron KBox A-150-APL LAN 1 <wanip>:3333
To figure out the IP address of the WAN interface, refer to Finding out the IP address of the device in the Kontron KBox A-150-APL chapter of the device guide.Kontron KBox A-250 ETH 2 <wanip>:3333
To figure out the IP address of the WAN interface, refer to Finding out the IP address of the device in the Kontron KBox A-250 chapter of the device guide.Maxtang AXWL10 LAN1 <wanip>:3333
To figure out the IP address of the WAN interface, refer to Finding out the IP address of the device in the Maxtang AXWL10 chapter of the device guide.Siemens SIMATIC IPC127E X1 P1 http://172.20.2.1:3333 Siemens SIMATIC IPC427E X1 P1 http://172.20.2.1:3333 Supermicro SuperServer E100-9AP-IA LAN1 <wanip>:3333
To figure out the IP address of the WAN interface, refer to Finding out the IP address of the device in the Supermicro SuperServer E100-9AP-IA chapter of the device guide.Supermicro SuperServer 1019D-16C-FHN13TP LAN3 http://172.20.2.1:3333 Supermicro SuperServer 5029C-T LAN1 <wanip>:3333
To figure out the IP address of the WAN interface, refer to Finding out the IP address of the device in the Supermicro SuperServer 5029C-T chapter of the device guide.Toshiba FA2100T-700 First rear port http://172.20.2.1:3333 Vecow SPC-5600-i5-8500 LAN 1 http://172.20.2.1:3333 Winmate EACIL20 LAN1 <wanip>:3333
To figure out the IP address of the WAN interface, refer to Finding out the IP address of the device in the Winmate EACIL20 chapter of the device guide. -
Select Data in the navigation on the left.
The navigation on the left collapses to show the home screen of Grafana. Here dashboards can be created as described below. Select the burger menu in the top-left to expand the navigation again. Note that the Grafana UI theme is set to light by default.
Creating a dashboard
The instructions below cover the general workflow of creating a dashboard. Refer to Examples for specific use cases.
- Access the visualization element on either the node or in the Management System.
-
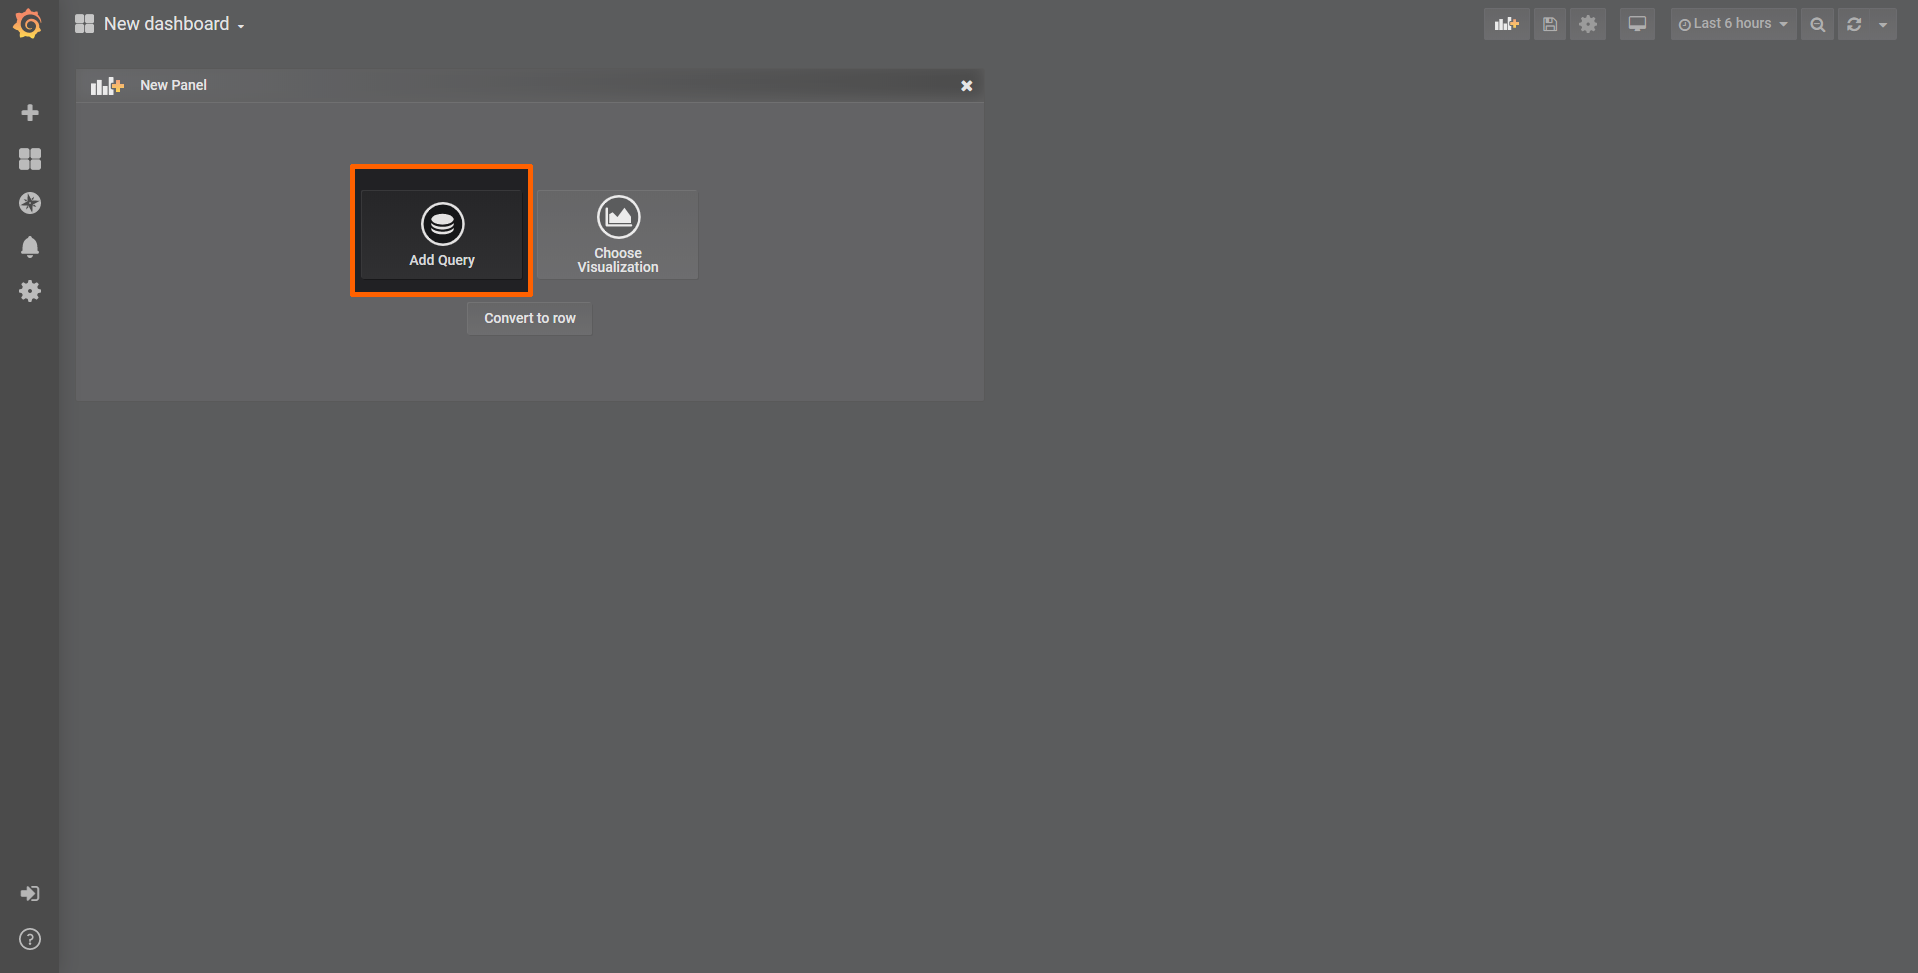
Select + > Dashboard in the navigation on the left. A box will appear.
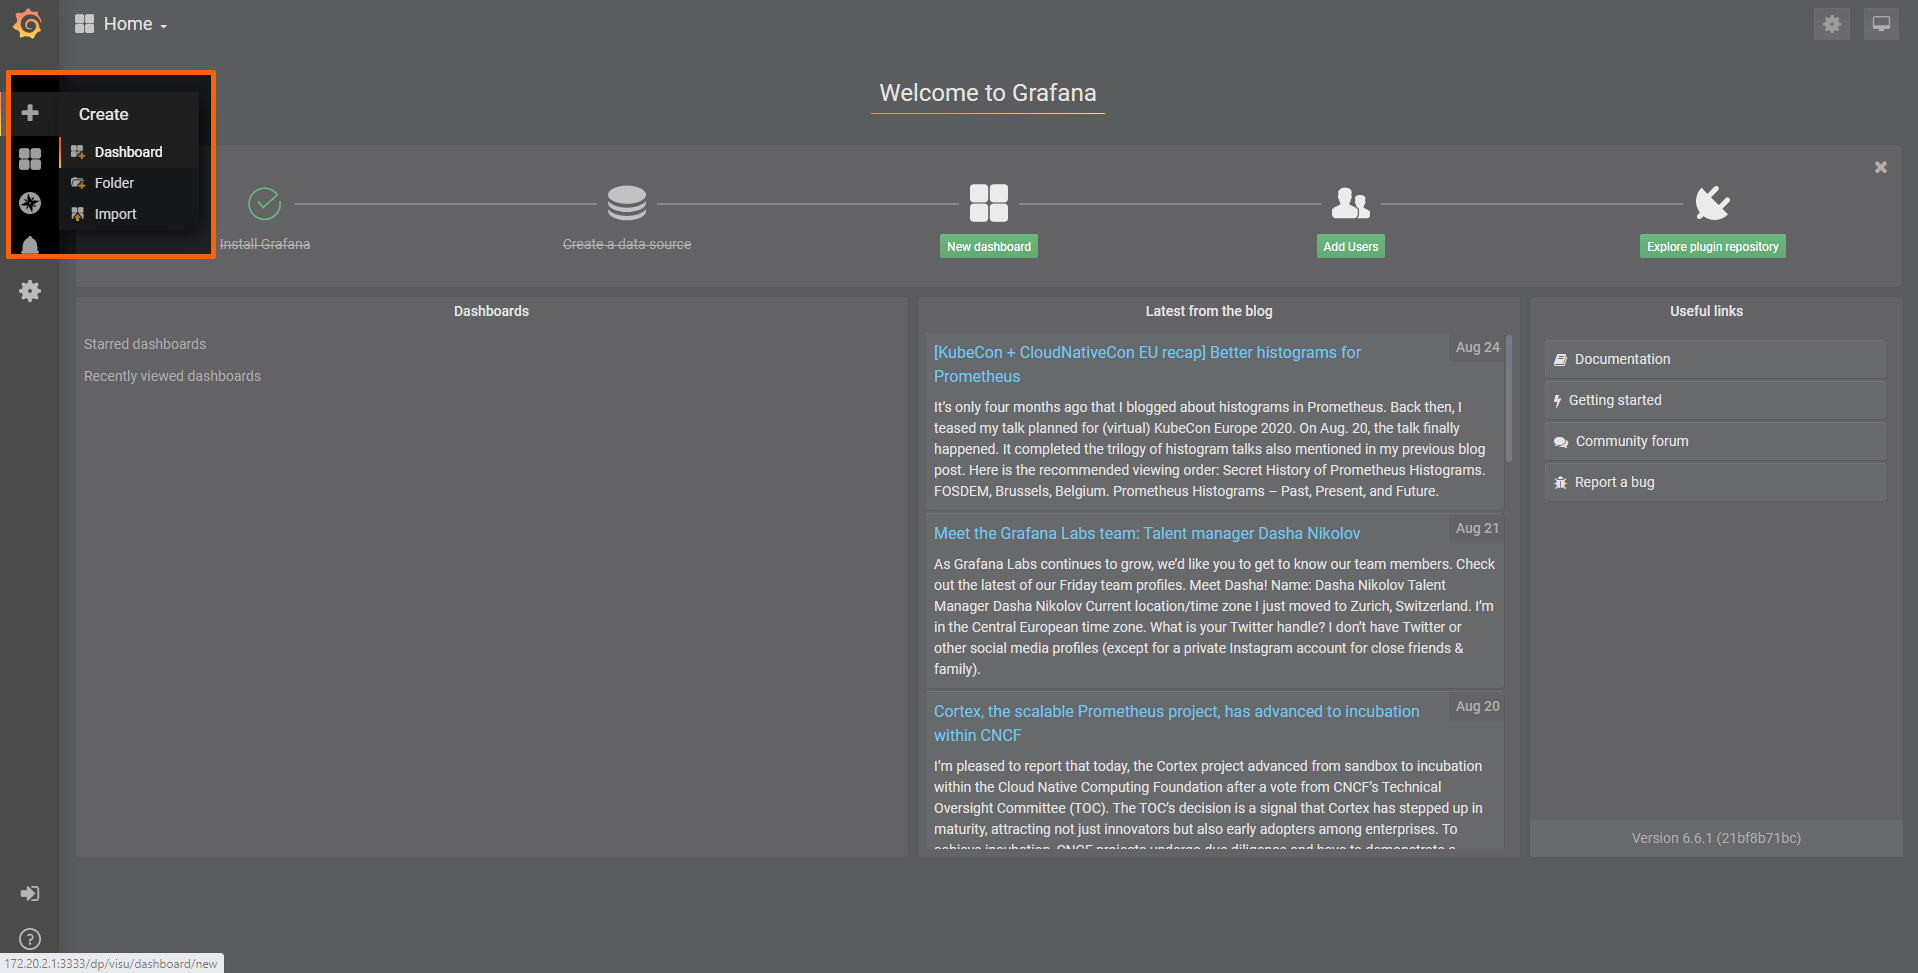
-
Select Add Query in the New Panel box.
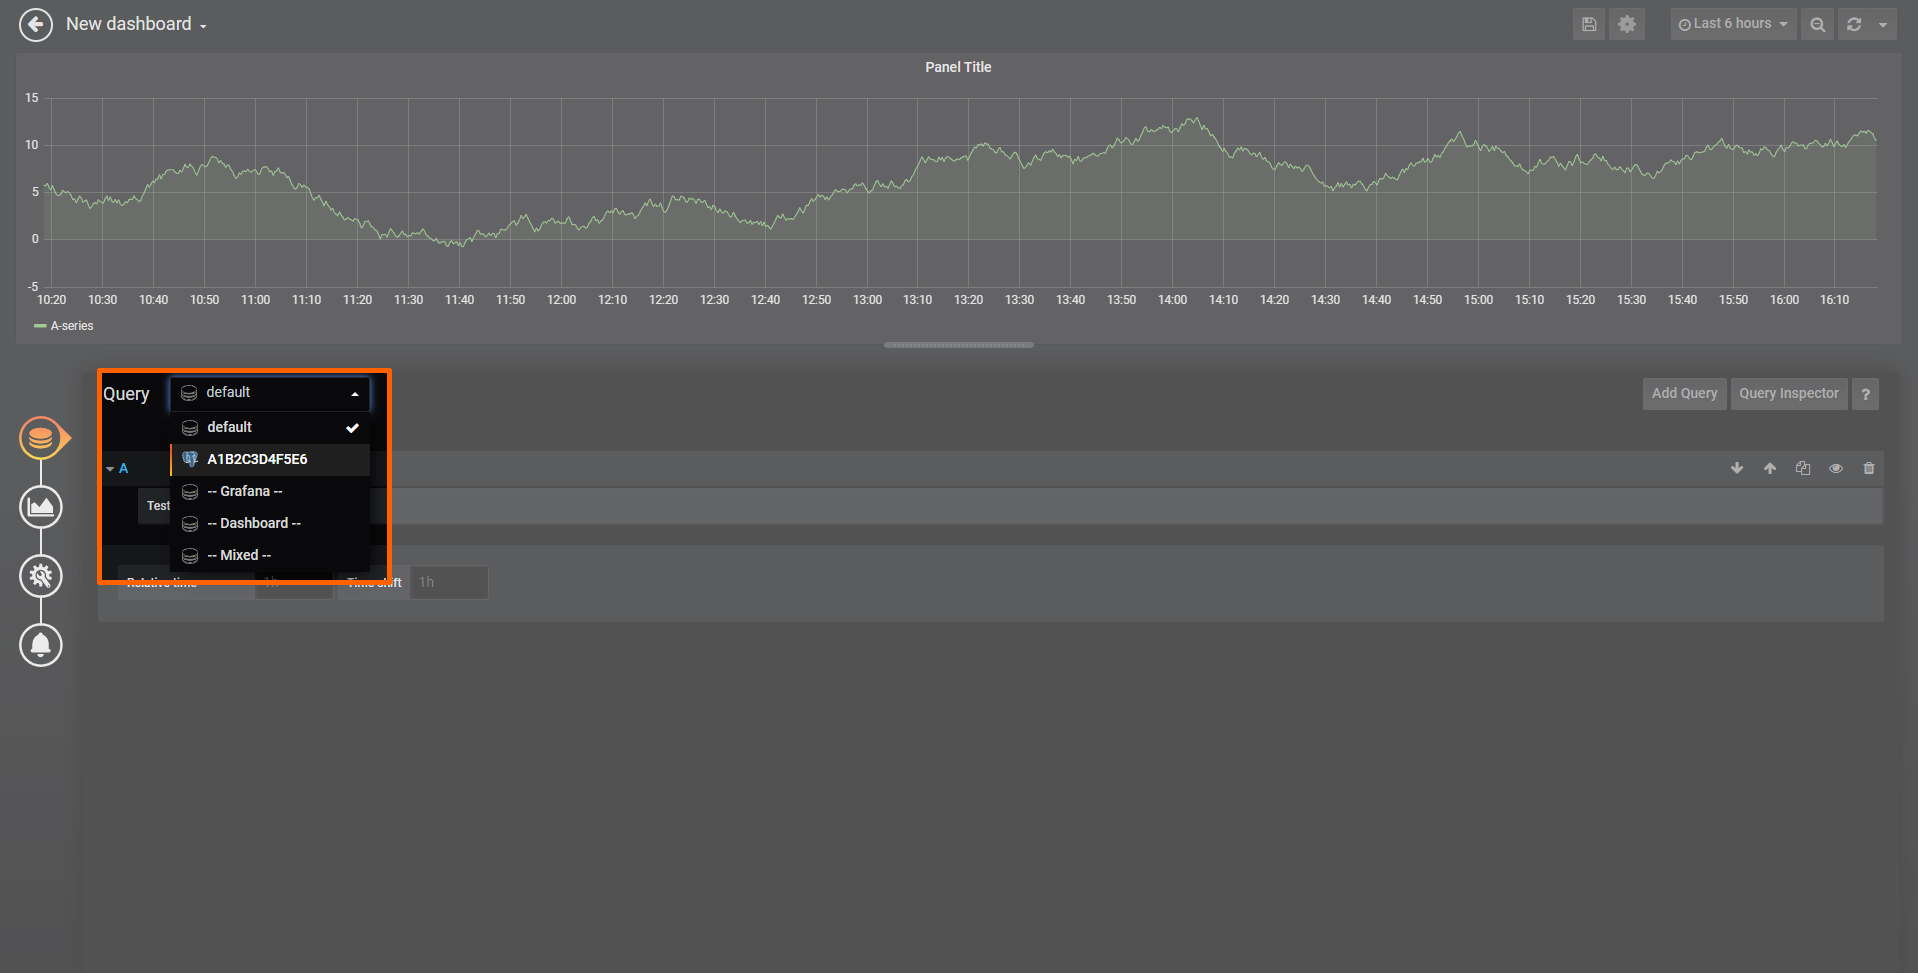
-
Select the data source from the drop-down menu. The name of the data source is the serial number of the node.
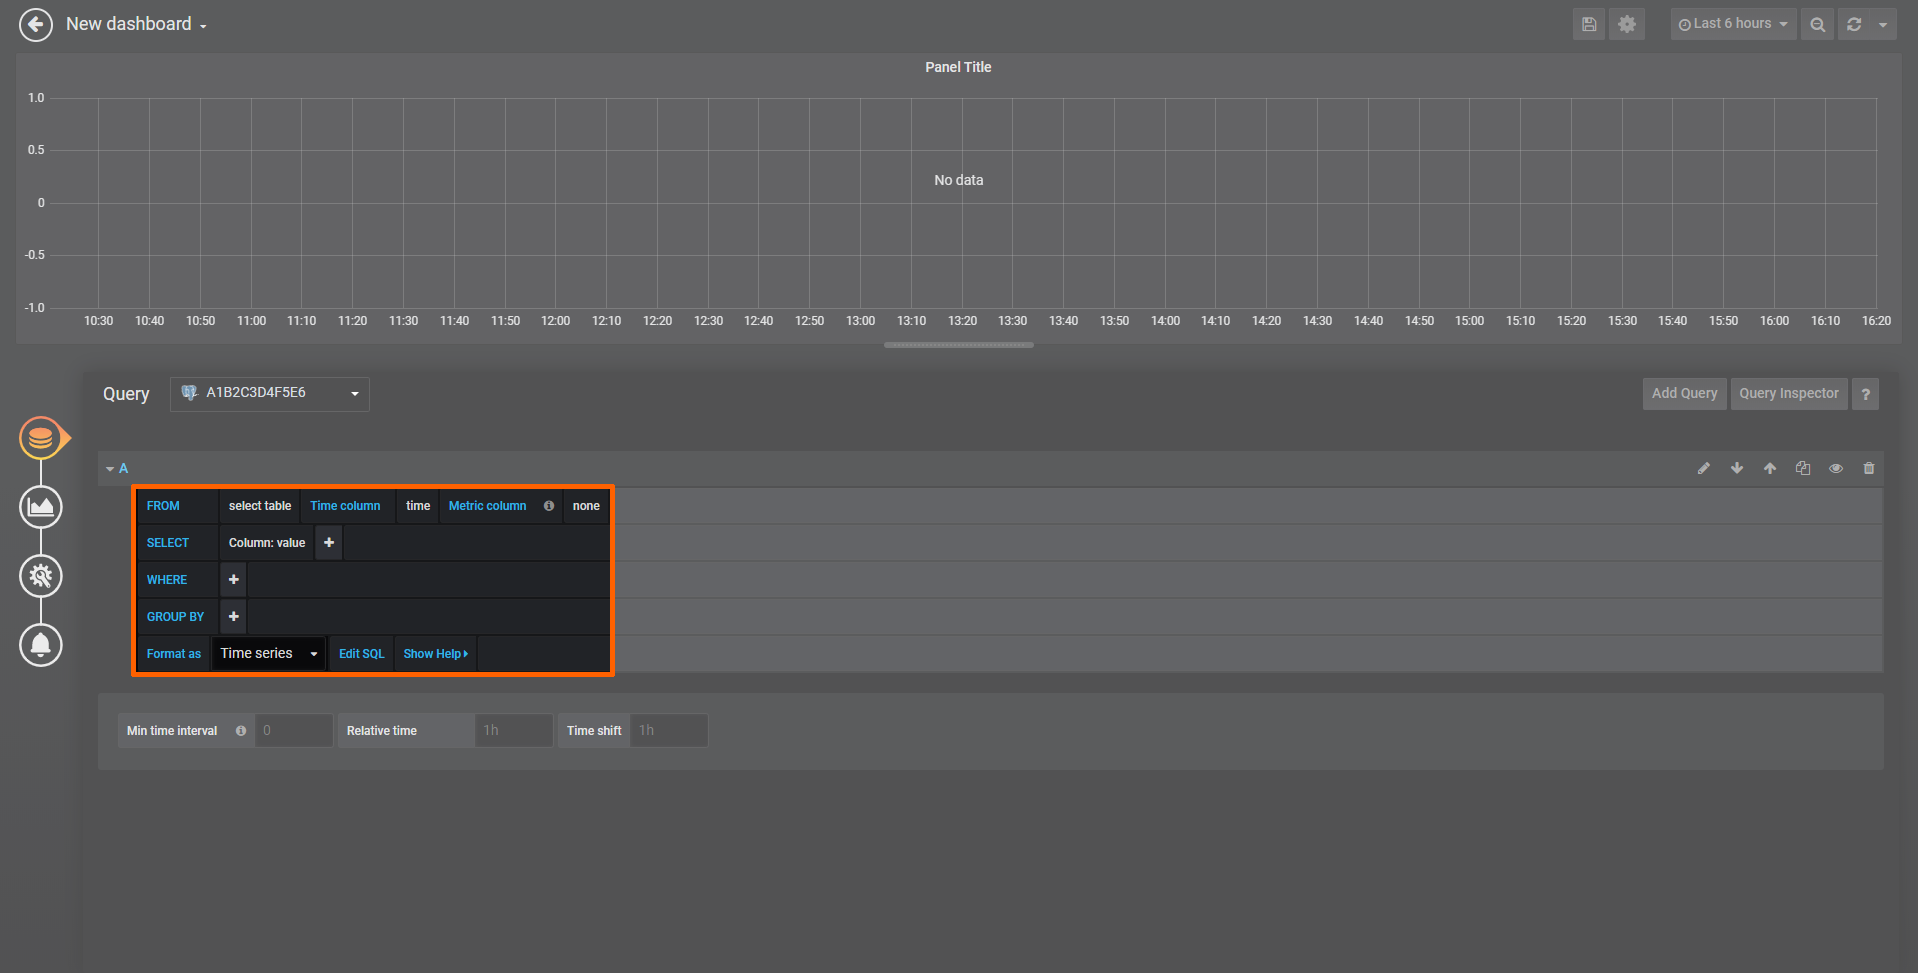
-
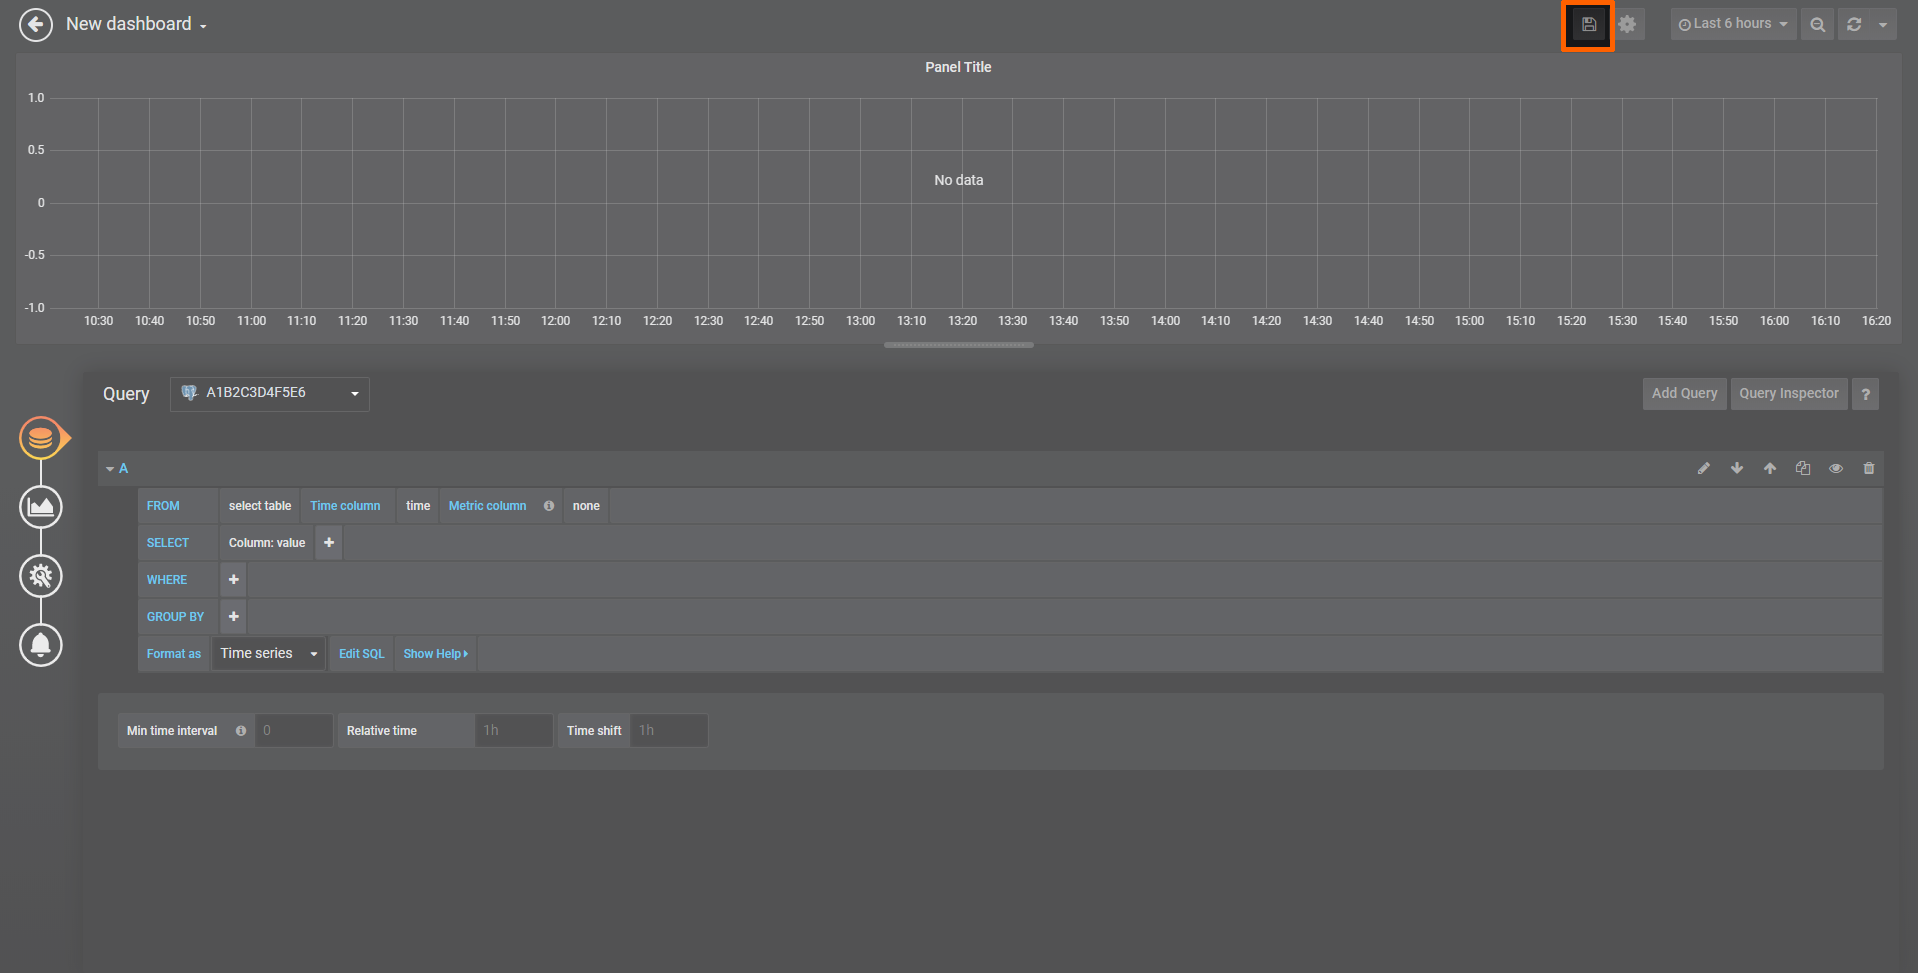
Fill in the query information below that appears below. This information depends on the use case and the Gateway configuration.
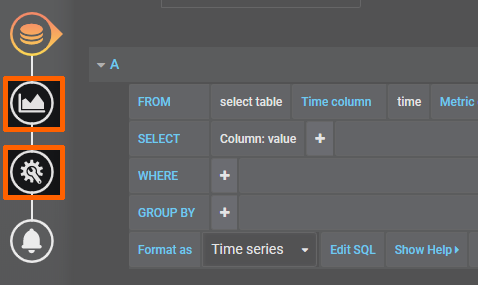
Note
Customize general settings and visualization settings by selecting General and Data in the navigation on the left. Refer to the Grafana documentation for more information.
-
Select the save icon in the upper-right corner to save the dashboard.
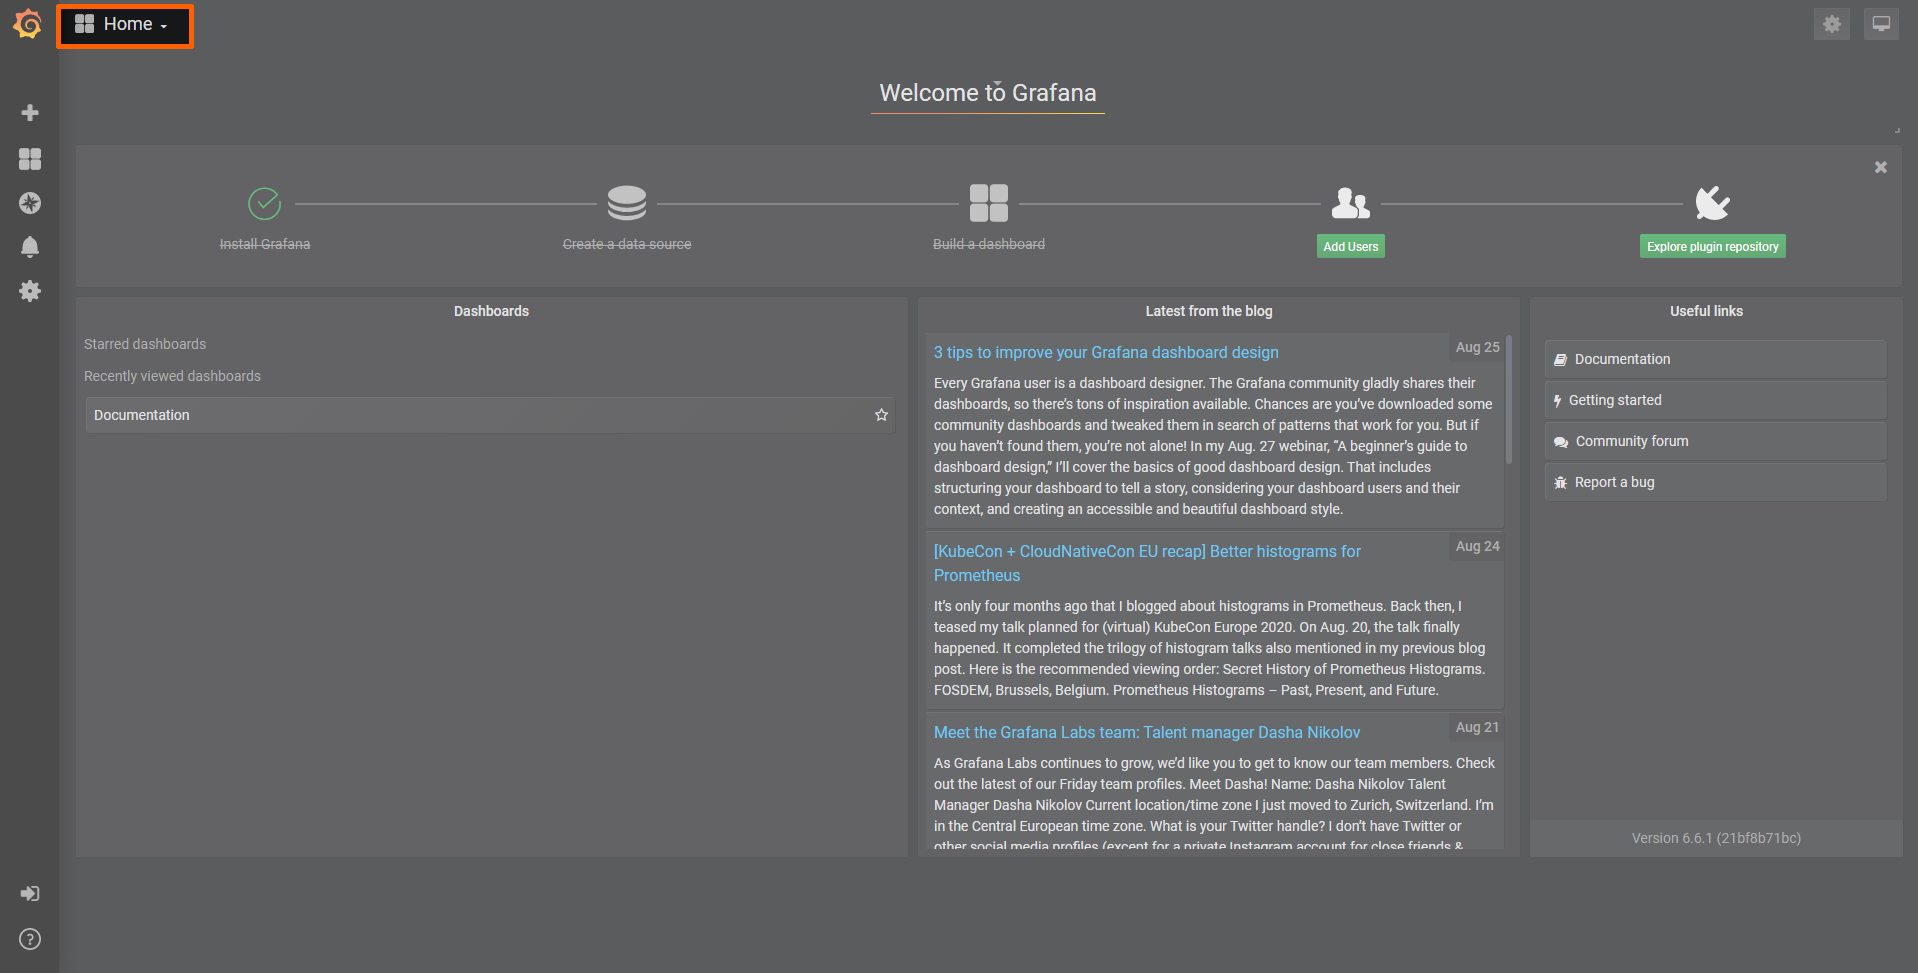
Access the dashboard from the home menu.
For specific examples on how to use Grafana with Nerve Data Services, refer to Examples.
Setting a home dashboard
According to Grafana default behavior, the Grafana instance in the Nerve system displays the Grafana landing page when Data is selected in the navigation on the left. A dashboard can be set to be the landing page instead. This requires dashboards that have been created before. Also note that this setting is only available on the node for the local data visualization in the Local UI.
-
Access the Local UI on the node. This is Nerve Device specific. Refer to the table below for device specific links to the Local UI. The initial login credentials to the Local UI can be found in the customer profile.
Nerve Device Physical port Local UI MFN 100 P1 http://172.20.2.1:3333 Kontron KBox A-150-APL LAN 1 <wanip>:3333
To figure out the IP address of the WAN interface, refer to Finding out the IP address of the device in the Kontron KBox A-150-APL chapter of the device guide.Kontron KBox A-250 ETH 2 <wanip>:3333
To figure out the IP address of the WAN interface, refer to Finding out the IP address of the device in the Kontron KBox A-250 chapter of the device guide.Maxtang AXWL10 LAN1 <wanip>:3333
To figure out the IP address of the WAN interface, refer to Finding out the IP address of the device in the Maxtang AXWL10 chapter of the device guide.Siemens SIMATIC IPC127E X1 P1 http://172.20.2.1:3333 Siemens SIMATIC IPC427E X1 P1 http://172.20.2.1:3333 Supermicro SuperServer E100-9AP-IA LAN1 <wanip>:3333
To figure out the IP address of the WAN interface, refer to Finding out the IP address of the device in the Supermicro SuperServer E100-9AP-IA chapter of the device guide.Supermicro SuperServer 1019D-16C-FHN13TP LAN3 http://172.20.2.1:3333 Supermicro SuperServer 5029C-T LAN1 <wanip>:3333
To figure out the IP address of the WAN interface, refer to Finding out the IP address of the device in the Supermicro SuperServer 5029C-T chapter of the device guide.Vecow SPC-5600-i5-8500 LAN 1 http://172.20.2.1:3333 Winmate EACIL20 LAN1 <wanip>:3333
To figure out the IP address of the WAN interface, refer to Finding out the IP address of the device in the Winmate EACIL20 chapter of the device guide. -
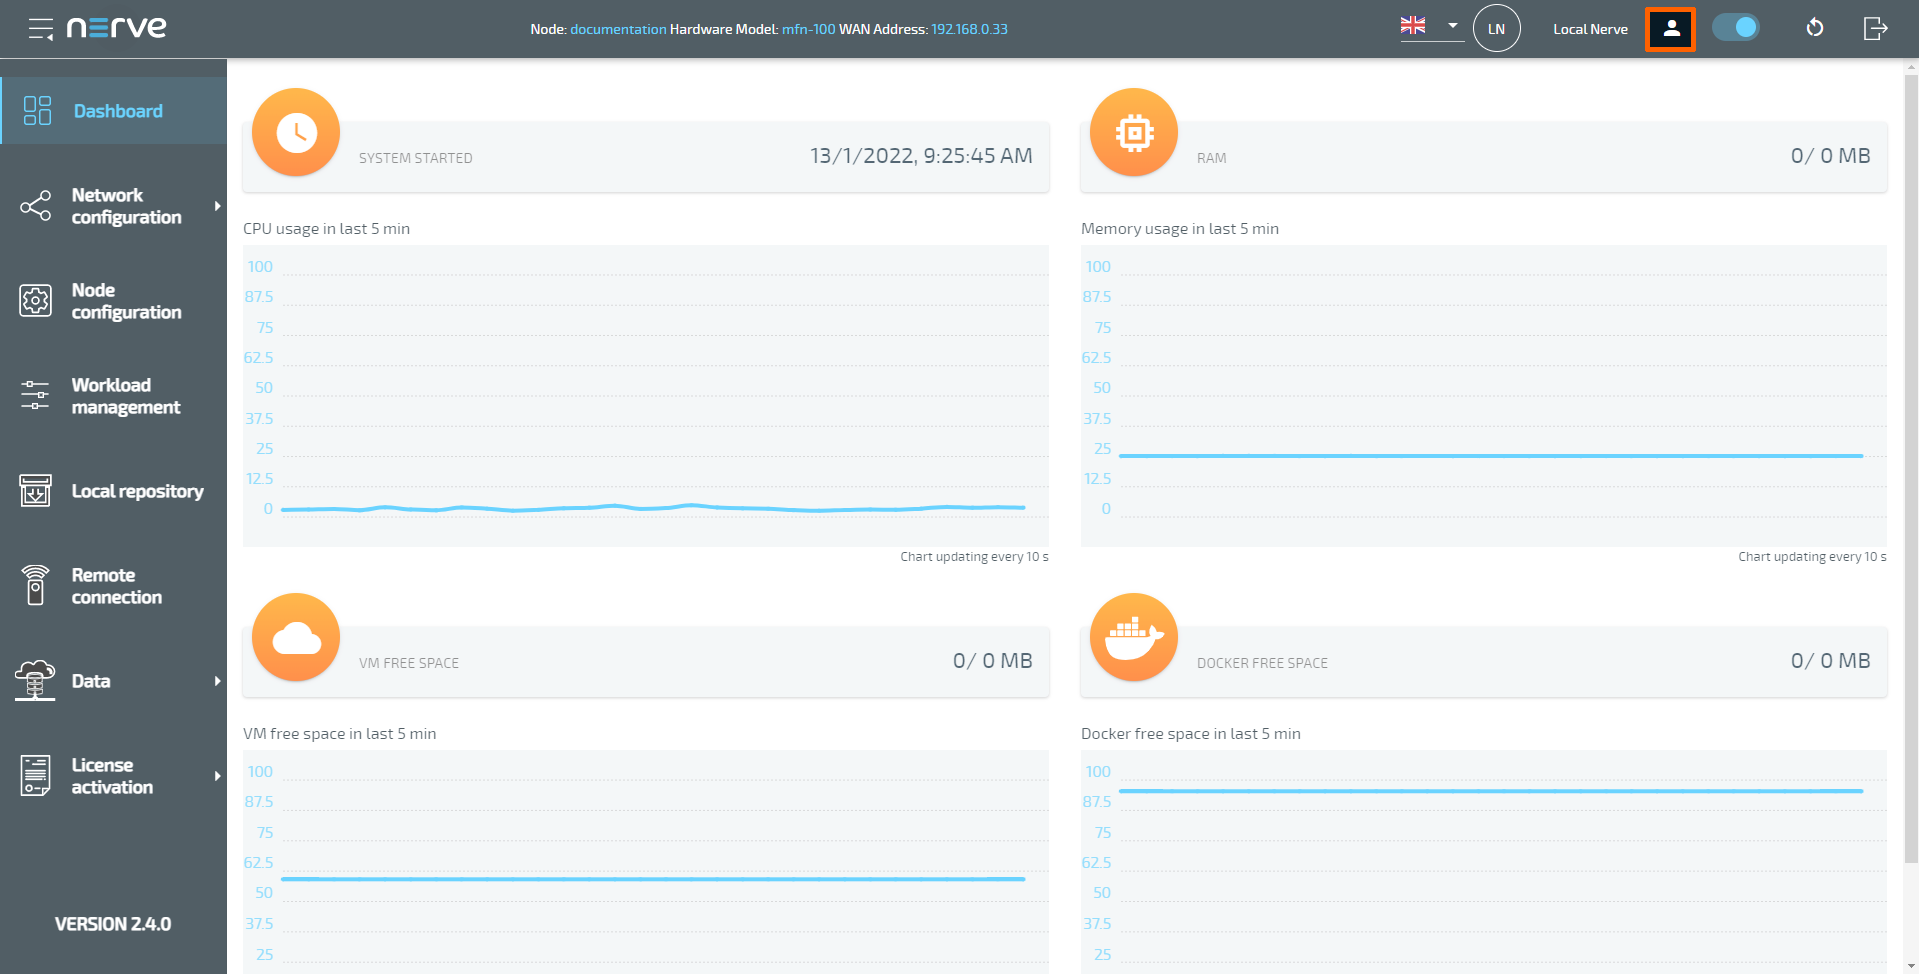
Select the User settings symbol in the upper-right.
-
Select the Set Grafana home dashboard tab.
-
Select a dashboard from the Grafana home dashboard drop-down menu. All created dashboards will be shown in the list.
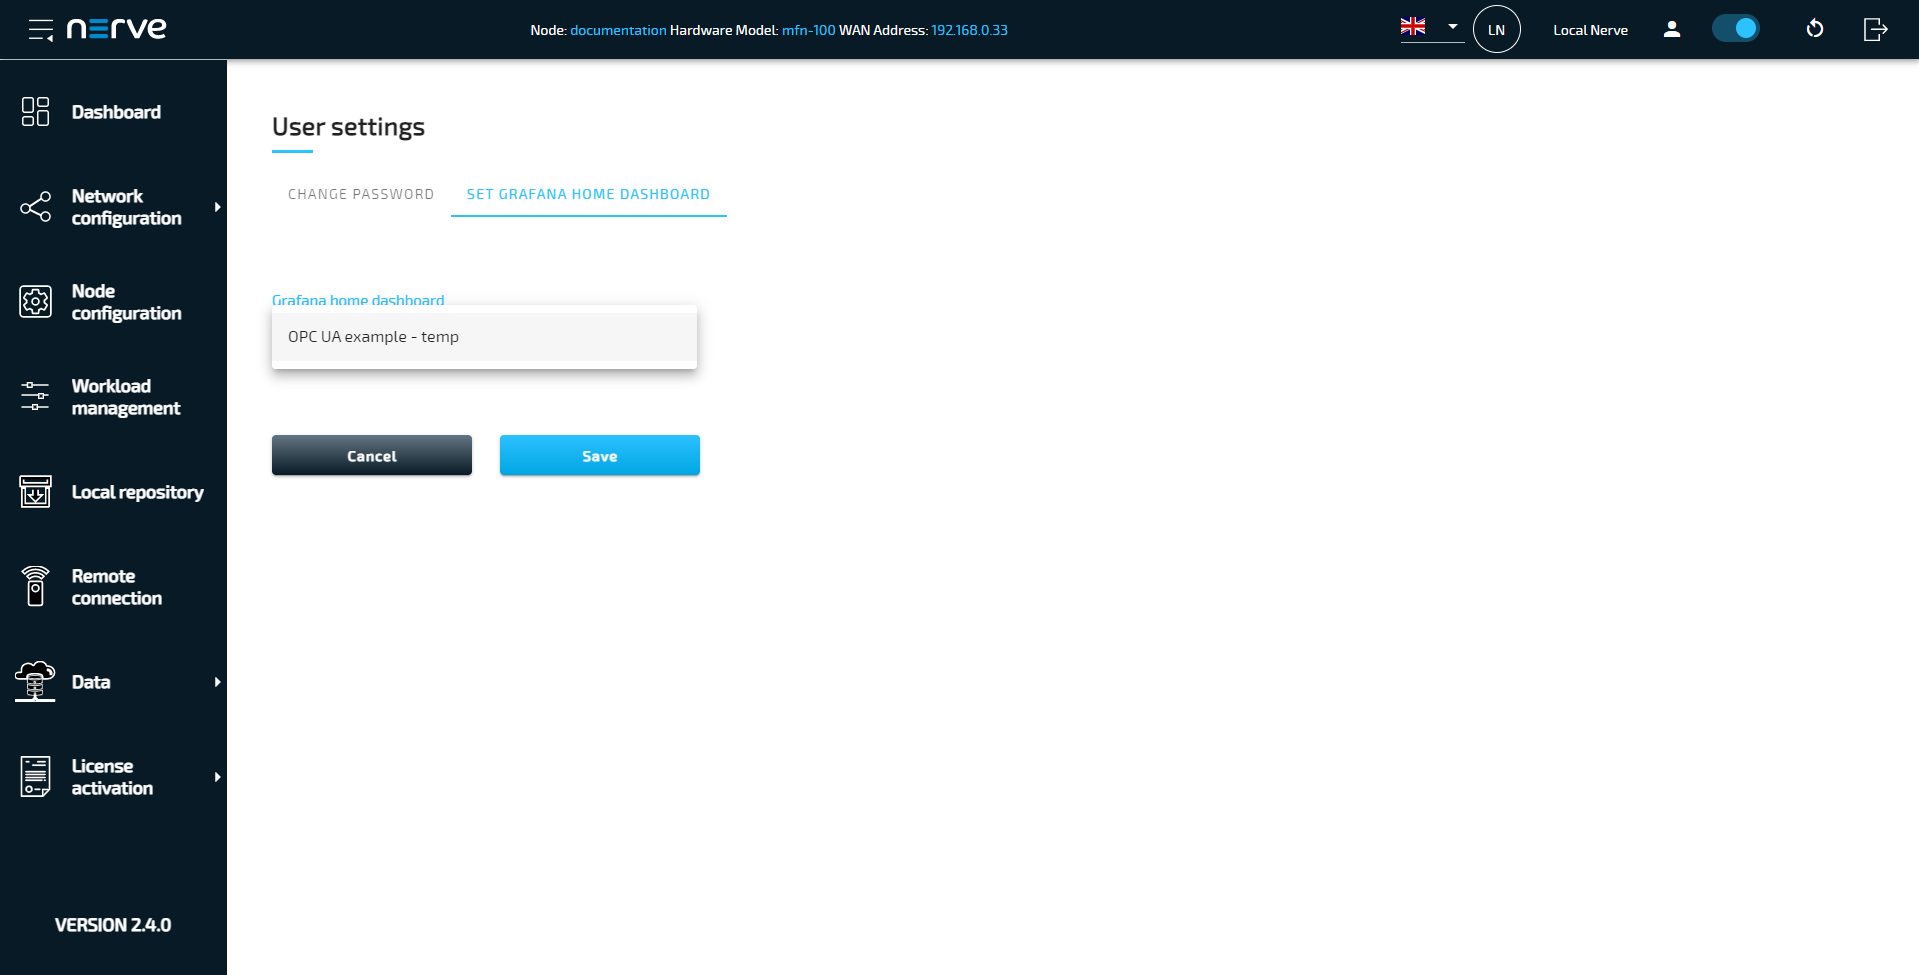
-
Select Save.
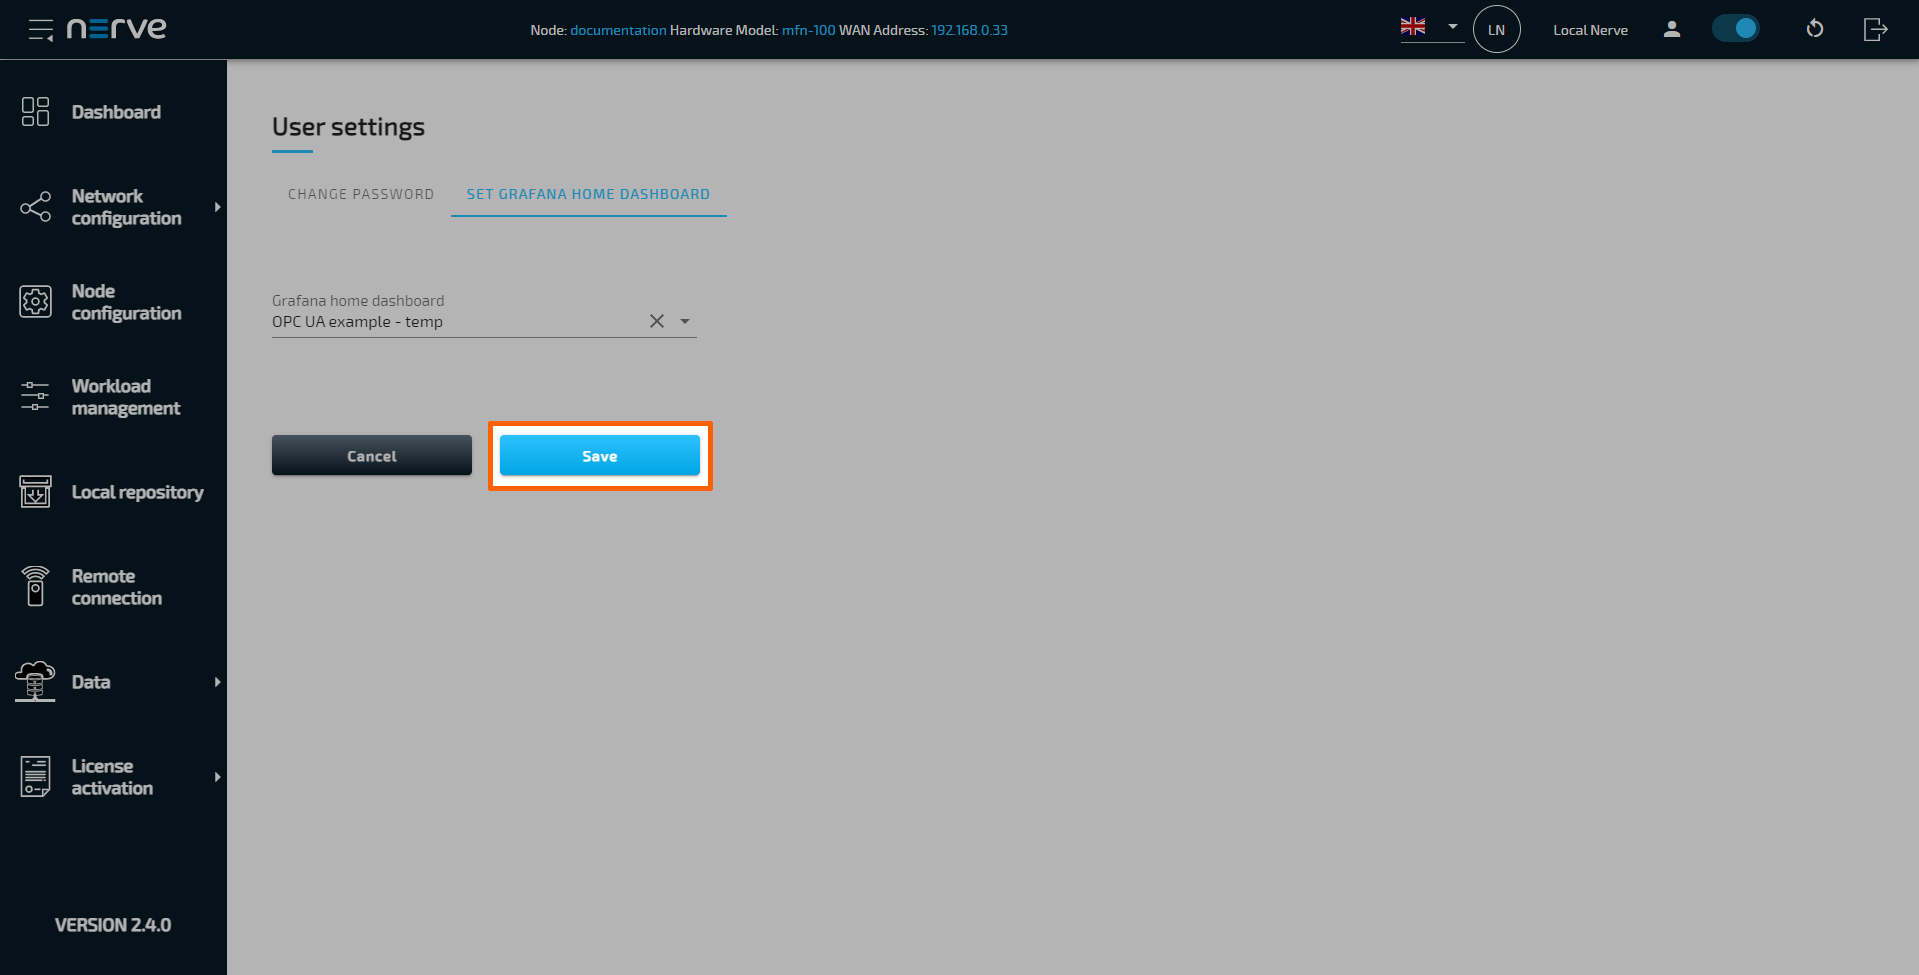
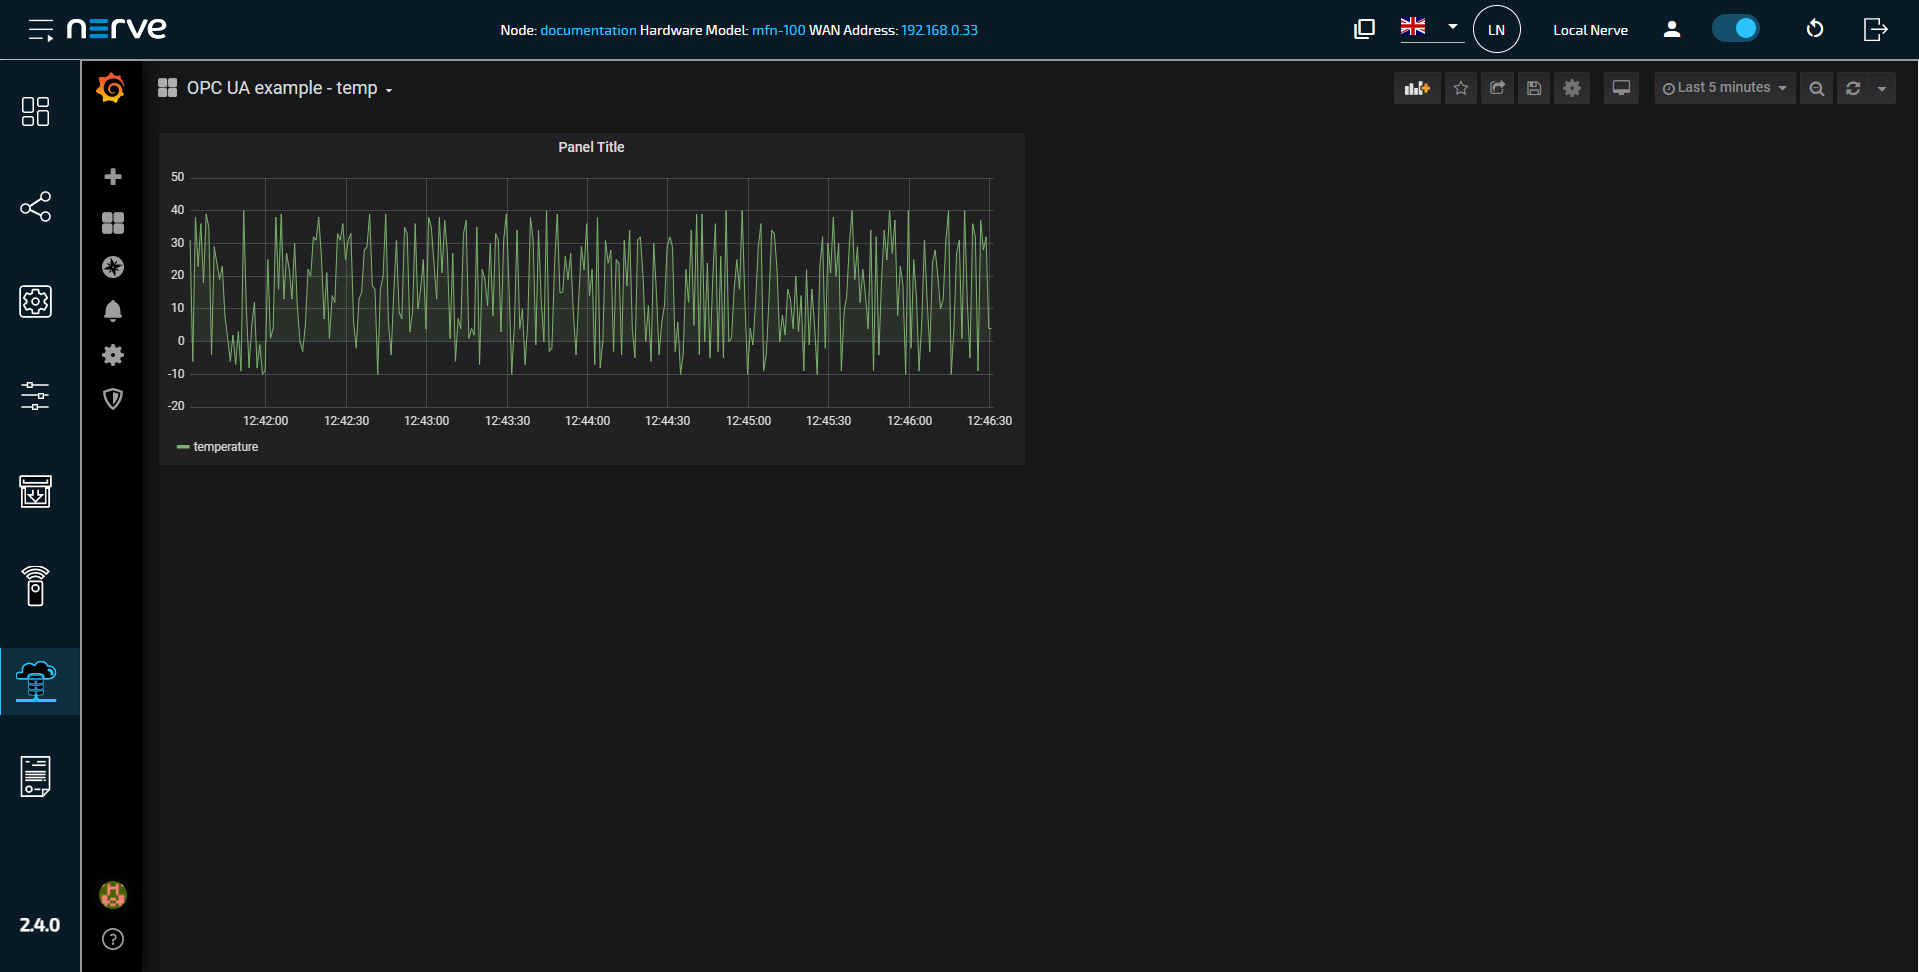
A green pop-up message will confirm the successful application of the Grafana home dashboard settings. Select Data in the navigation on the left to confirm that the landing page has been set to display the selected Grafana dashboard.
Detaching Grafana in kiosk mode
Grafana can be detached from the Local UI. This means that Grafana can be displayed and viewed without being subject to the timeout mechanism of the Local UI. Note that this setting is not available in the Management System.
-
Access the Local UI on the node. This is Nerve Device specific. Refer to the table below for device specific links to the Local UI. The initial login credentials to the Local UI can be found in the customer profile.
Nerve Device Physical port Local UI MFN 100 P1 http://172.20.2.1:3333 Kontron KBox A-150-APL LAN 1 <wanip>:3333
To figure out the IP address of the WAN interface, refer to Finding out the IP address of the device in the Kontron KBox A-150-APL chapter of the device guide.Kontron KBox A-250 ETH 2 <wanip>:3333
To figure out the IP address of the WAN interface, refer to Finding out the IP address of the device in the Kontron KBox A-250 chapter of the device guide.Maxtang AXWL10 LAN1 <wanip>:3333
To figure out the IP address of the WAN interface, refer to Finding out the IP address of the device in the Maxtang AXWL10 chapter of the device guide.Siemens SIMATIC IPC127E X1 P1 http://172.20.2.1:3333 Siemens SIMATIC IPC427E X1 P1 http://172.20.2.1:3333 Supermicro SuperServer E100-9AP-IA LAN1 <wanip>:3333
To figure out the IP address of the WAN interface, refer to Finding out the IP address of the device in the Supermicro SuperServer E100-9AP-IA chapter of the device guide.Supermicro SuperServer 1019D-16C-FHN13TP LAN3 http://172.20.2.1:3333 Supermicro SuperServer 5029C-T LAN1 <wanip>:3333
To figure out the IP address of the WAN interface, refer to Finding out the IP address of the device in the Supermicro SuperServer 5029C-T chapter of the device guide.Vecow SPC-5600-i5-8500 LAN 1 http://172.20.2.1:3333 Winmate EACIL20 LAN1 <wanip>:3333
To figure out the IP address of the WAN interface, refer to Finding out the IP address of the device in the Winmate EACIL20 chapter of the device guide. -
Select Data in the navigation on the left. A symbol will appear in the upper-right, next to the language selector.
-
Select the Detach Grafana symbol in the upper-right.
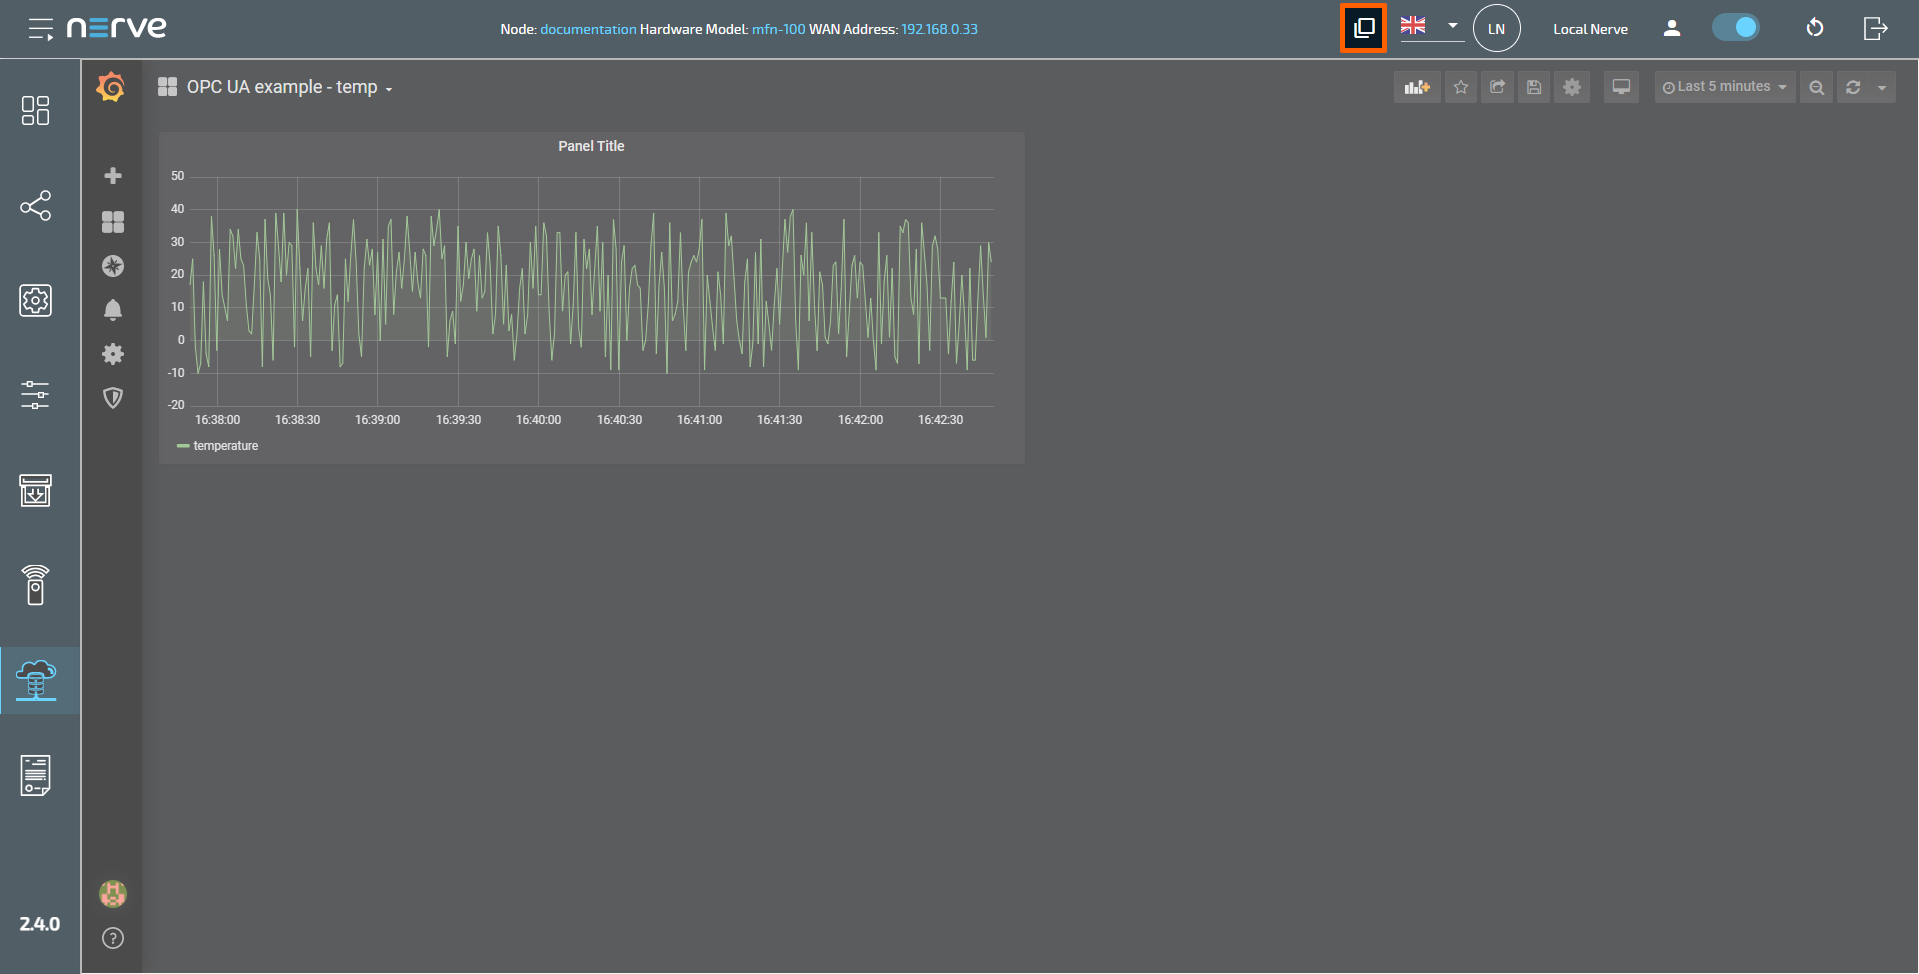
A detached Grafana window will open in a new browser tab. Note that Grafana will be in admin mode when first detached. It will stay in admin mode as long as the Grafana window is not refreshed and a user is logged into the Local UI. If the active user is logged out of the Local UI and the Grafana browser tab is refreshed, Grafana will then be in viewer mode.
Accessing Grafana outside of the Local UI
Grafana can also be accessed without logging into the Local UI. Open a new browser tab and enter http://<localui-ip>:3333/dp/visu/ to access Grafana outside of the Local UI. Note that Grafana will be in viewer mode when opening Grafana this way and will not be subjected to any session timeout. To have Grafana in admin mode, a user needs to be logged in to the Local UI and the Grafana browser tab needs to be refreshed.
As a reminder, take a look at the table below on how to access the Local UI according to the Nerve Device used:
| Nerve Device | Physical port | Local UI |
|---|---|---|
| MFN 100 | P1 | http://172.20.2.1:3333 |
| Kontron KBox A-150-APL | LAN 1 | <wanip>:3333To figure out the IP address of the WAN interface, refer to Finding out the IP address of the device in the Kontron KBox A-150-APL chapter of the device guide. |
| Kontron KBox A-250 | ETH 2 | <wanip>:3333To figure out the IP address of the WAN interface, refer to Finding out the IP address of the device in the Kontron KBox A-250 chapter of the device guide. |
| Maxtang AXWL10 | LAN1 | <wanip>:3333To figure out the IP address of the WAN interface, refer to Finding out the IP address of the device in the Maxtang AXWL10 chapter of the device guide. |
| Siemens SIMATIC IPC127E | X1 P1 | http://172.20.2.1:3333 |
| Siemens SIMATIC IPC427E | X1 P1 | http://172.20.2.1:3333 |
| Supermicro SuperServer E100-9AP-IA | LAN1 | <wanip>:3333To figure out the IP address of the WAN interface, refer to Finding out the IP address of the device in the Supermicro SuperServer E100-9AP-IA chapter of the device guide. |
| Supermicro SuperServer 1019D-16C-FHN13TP | LAN3 | http://172.20.2.1:3333 |
| Supermicro SuperServer 5029C-T | LAN1 | <wanip>:3333To figure out the IP address of the WAN interface, refer to Finding out the IP address of the device in the Supermicro SuperServer 5029C-T chapter of the device guide. |
| Vecow SPC-5600-i5-8500 | LAN 1 | http://172.20.2.1:3333 |
| Winmate EACIL20 | LAN1 | <wanip>:3333To figure out the IP address of the WAN interface, refer to Finding out the IP address of the device in the Winmate EACIL20 chapter of the device guide. |