Modbus server data to InfluxDB for visualization
This example shows how to set up Modbus as an input for the Gateway. It uses a Modbus simulation server that holds temperature and humidity data inside its holding registers. This server is provided as a Docker container. Data is then written into an InfluxDB that is also provided as a Docker container and visualized at the node.
Note
Note that InfluxDB version 1.X is supported by the Data Services. In this version, InfluxDB 2.0 is not supported.
Provisioning and deploying the simulation server and the InfluxDB
In the instructions below two Docker workloads will be provisioned and deployed:
A Modbus simulation server is deployed to the node that holds temperature and humidity data inside its holding registers. The simulation server is provided as a Docker container.
After that an InfluxDB that gathers data from the Modbus simulation server is deployed to the node. The InfluxDB is also provided as a Docker container.
- Log in to the Management System. Make sure that the user has the permissions to access the Data Services.
-
Provision a Docker workload for the server simulation by following Provisioning a Docker workload. Use the following workload version settings:
Setting Value Name Enter any name for the workload version. Release name Enter any release name. DOCKER IMAGE Select Upload to add the Docker image of the server simulation that has been downloaded before. Container name modbus-demo-serverNetwork name host -
Provision a Docker workload for the InfluxDB by following Provisioning a Docker workload. Use the following workload version settings:
Setting Value Name Enter any name for the workload version. Release name Enter any release name. DOCKER IMAGE Select From registry and enter influxdb:1.8.3.Docker volumes for persistent storage influxdb:/var/lib/influxdbContainer name influxdbNetwork name host -
Deploy both provisioned Docker workloads above by following Deploying a workload.
Creating a database over a remote connection
A database needs to be created first that will receive data from the Modbus simulation server. In this example this is done with a remote tunnel for port 8086. The connection is then established through the Nerve Connection Manager so that an HTTP requests can be sent to the InfluxDB.
-
Configure a remote tunnel by following Configuring a remote tunnel to a workload. Use the following settings:
Setting Value Name Enter any name for the remote connection. Local acknowledgment Select Yes or No from the drop-down menu. Port on node 8086Port on PC Enter a free port on the local workstation. -
Use the remote tunnel by following Using a remote tunnel to a workload. Make sure to select the InfluxDB Docker workload.
- Open a command-line interface.
-
Enter the following command to create a database in the InfluxDB. Note that this command requires cURL to be installed.
curl -POST http://localhost:8086/query --data-urlencode "q=CREATE DATABASE data"
Configuring the Data Services Gateway on the node
The configuration below defines the Modbus simulation as an input that delivers humidity and temperature data. The InfluxDB is defined as the output.
-
Access the Local UI on the node. This is Nerve Device specific. Refer to the table below for device specific links to the Local UI. The initial login credentials to the Local UI can be found in the customer profile.
Nerve Device Physical port Local UI MFN 100 P1 http://172.20.2.1:3333 Kontron KBox A-150-APL LAN 1 <wanip>:3333
To figure out the IP address of the WAN interface, refer to Finding out the IP address of the device in the Kontron KBox A-150-APL chapter of the device guide.Kontron KBox A-250 ETH 2 <wanip>:3333
To figure out the IP address of the WAN interface, refer to Finding out the IP address of the device in the Kontron KBox A-250 chapter of the device guide.Maxtang AXWL10 LAN1 <wanip>:3333
To figure out the IP address of the WAN interface, refer to Finding out the IP address of the device in the Maxtang AXWL10 chapter of the device guide.Siemens SIMATIC IPC127E X1 P1 http://172.20.2.1:3333 Siemens SIMATIC IPC427E X1 P1 http://172.20.2.1:3333 Supermicro SuperServer E100-9AP-IA LAN1 <wanip>:3333
To figure out the IP address of the WAN interface, refer to Finding out the IP address of the device in the Supermicro SuperServer E100-9AP-IA chapter of the device guide.Supermicro SuperServer 1019D-16C-FHN13TP LAN3 http://172.20.2.1:3333 Supermicro SuperServer 5029C-T LAN1 <wanip>:3333
To figure out the IP address of the WAN interface, refer to Finding out the IP address of the device in the Supermicro SuperServer 5029C-T chapter of the device guide.Vecow SPC-5600-i5-8500 LAN 1 http://172.20.2.1:3333 Winmate EACIL20 LAN1 <wanip>:3333
To figure out the IP address of the WAN interface, refer to Finding out the IP address of the device in the Winmate EACIL20 chapter of the device guide. -
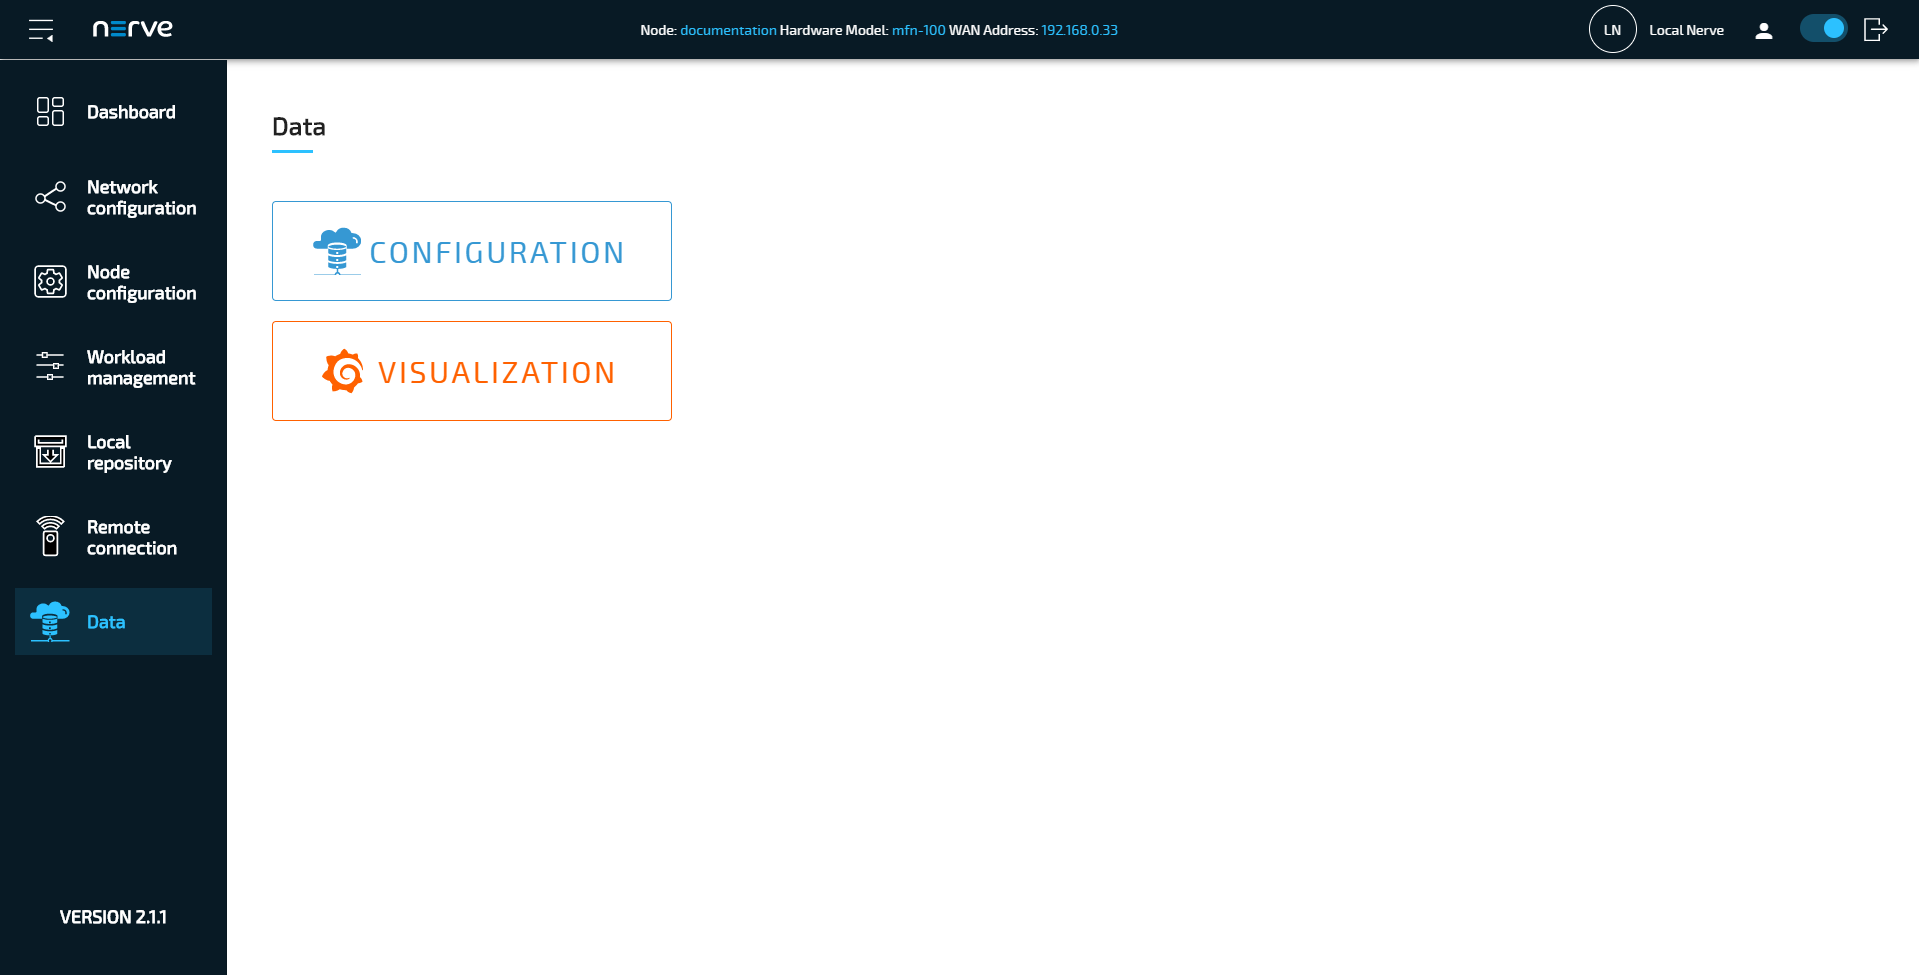
Select Data in the navigation on the left.
-
Select CONFIGURATION.
-
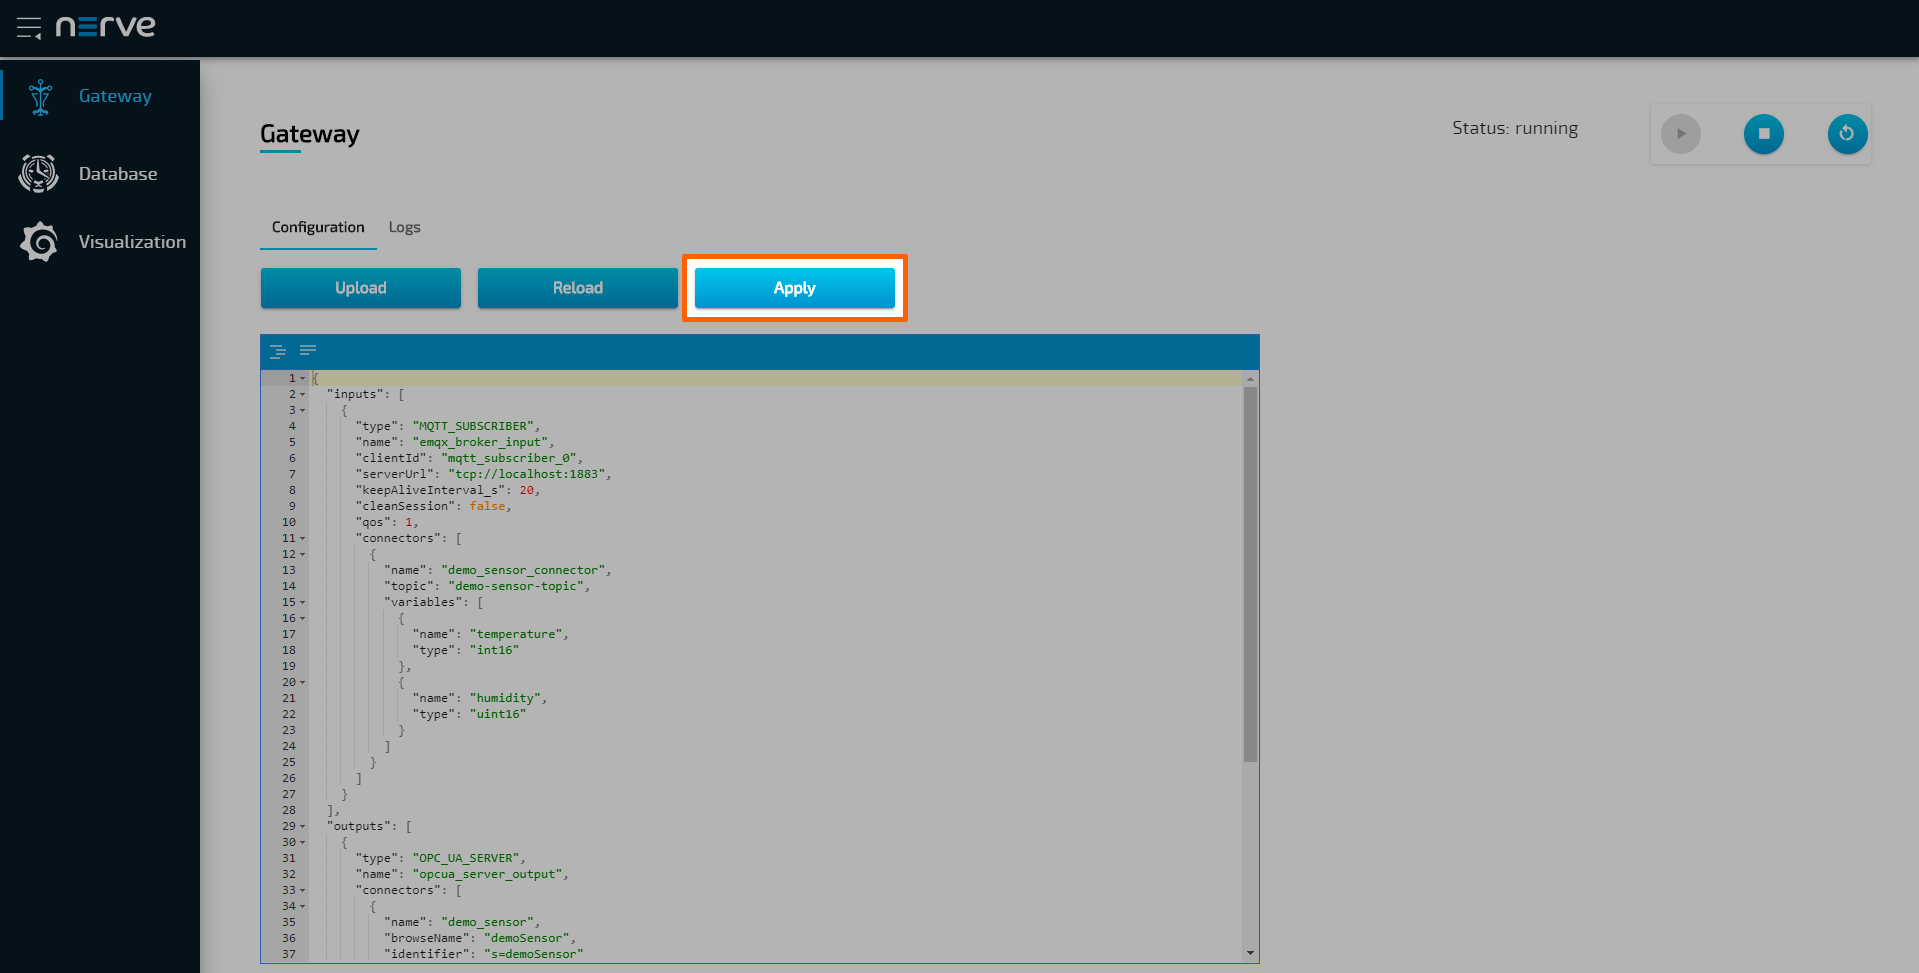
Enter the following configuration into the configuration editor of the Gateway:
{
    "inputs": [
        {
            "type": "MODBUS_CLIENT",
            "name": "modbus_client",
            "serverUrl": "127.0.0.1",
            "port": 10503,
            "pollingInterval_ms": 1000,
            "connectors": [
                {
                    "name": "modbus_connector_0",
                    "holdingRegisters": [
                        {
                            "name": "temperature",
                            "address": 0,
                            "type": "int16"
                        },
                        {
                            "name": "humidity",
                            "address": 4,
                            "type": "int16"
                        }
                    ]
                }
            ]
        }
    ],
    "outputs": [
        {
            "type": "DB_INFLUX",
            "name": "influxdb_output",
            "url": "localhost",
            "port": 8086,
            "connectors": [
                {
                    "name": "modbus_data",
                    "dbName": "data"
                }
            ]
        }
    ],
    "connections" : [
        {
            "name": "connection_0",
            "input": { "index" : 0, "connector" : 0 },
            "output": { "index" : 0, "connector" : 0 }
        }
    ]
}
-
Select Apply to save the Gateway configuration. The Gateway will restart automatically.
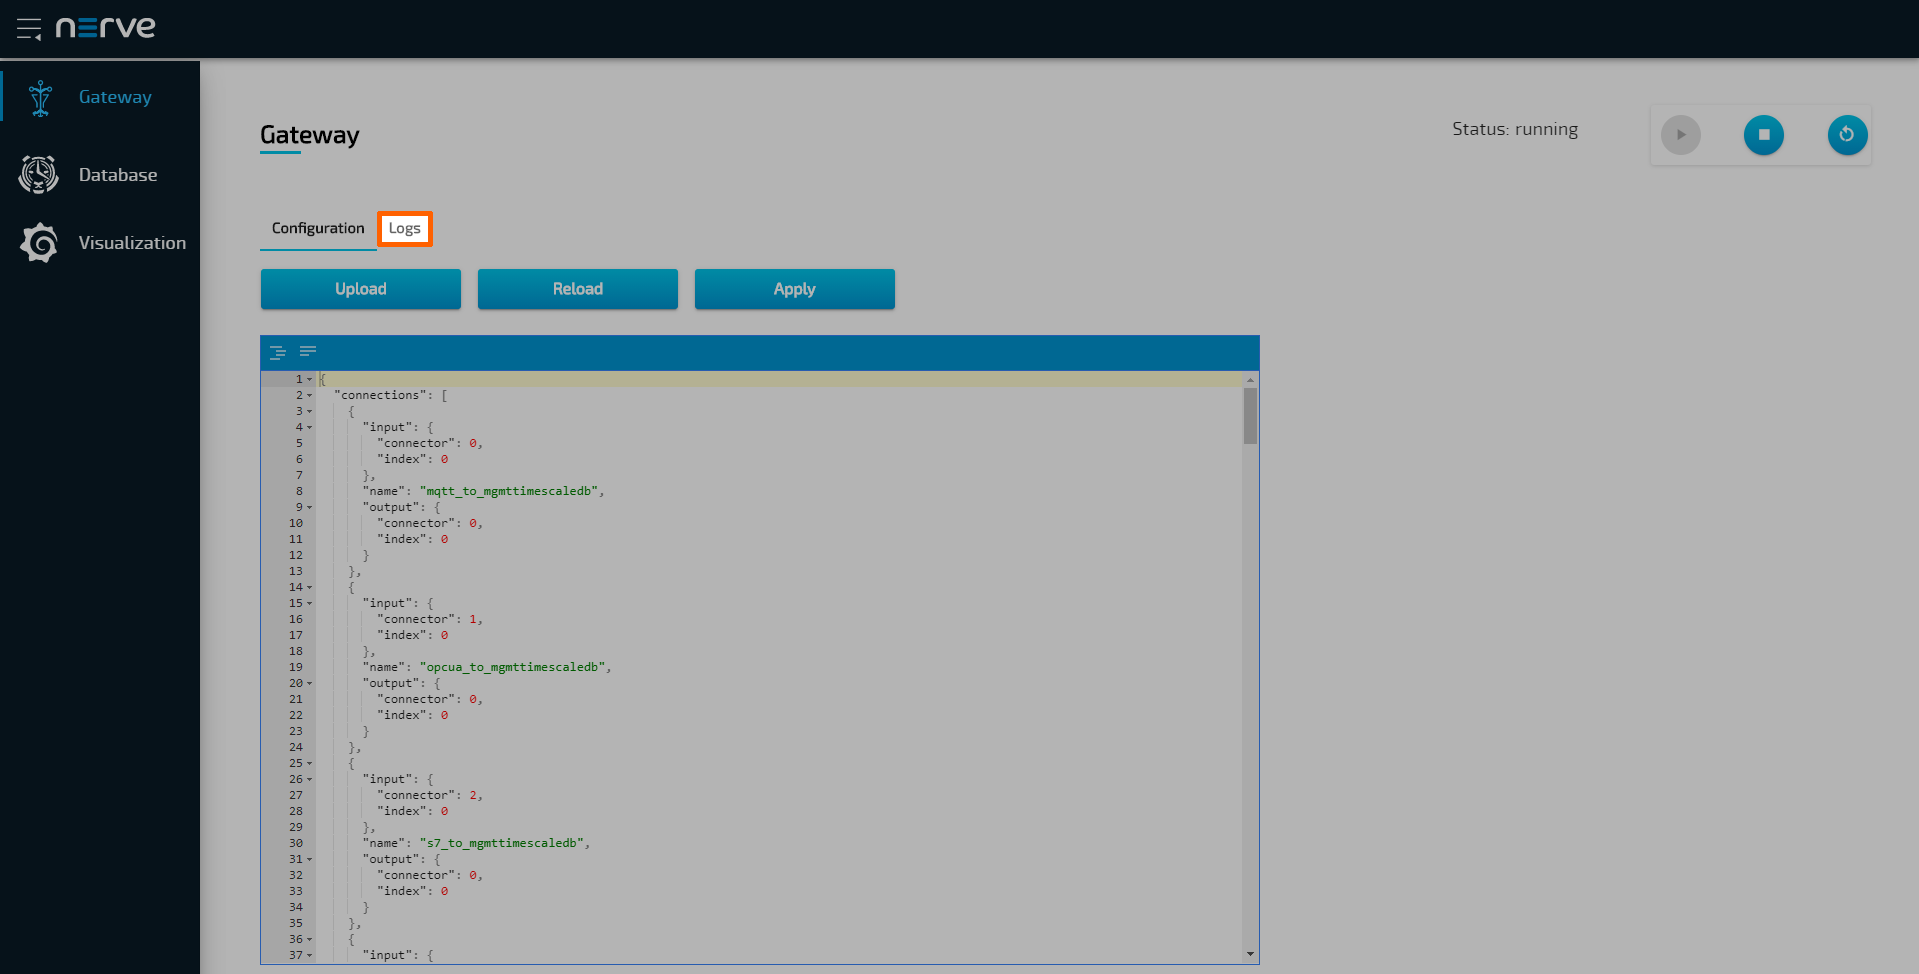
A success notification pops up in the upper-right to confirm that the Gateway has accepted the configuration and everything works as expected. Select the Logs tab to view the Gateway logs for more information.
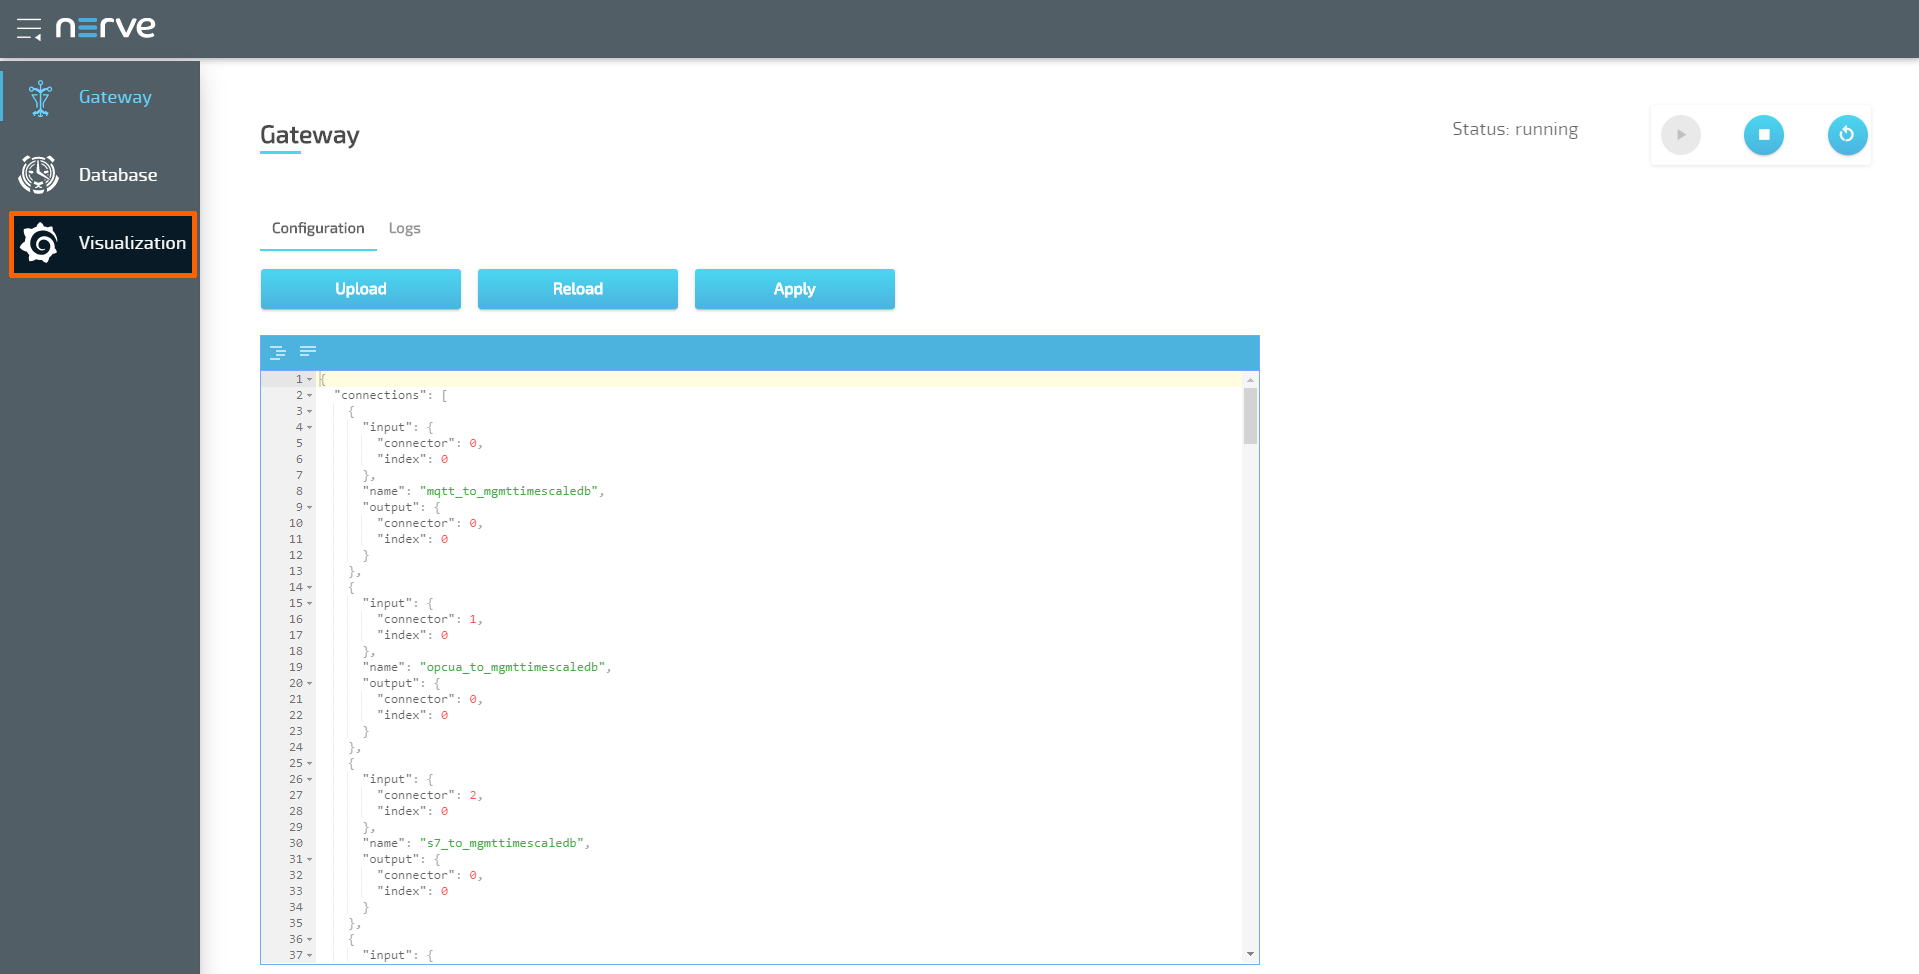
Local data visualization at the node
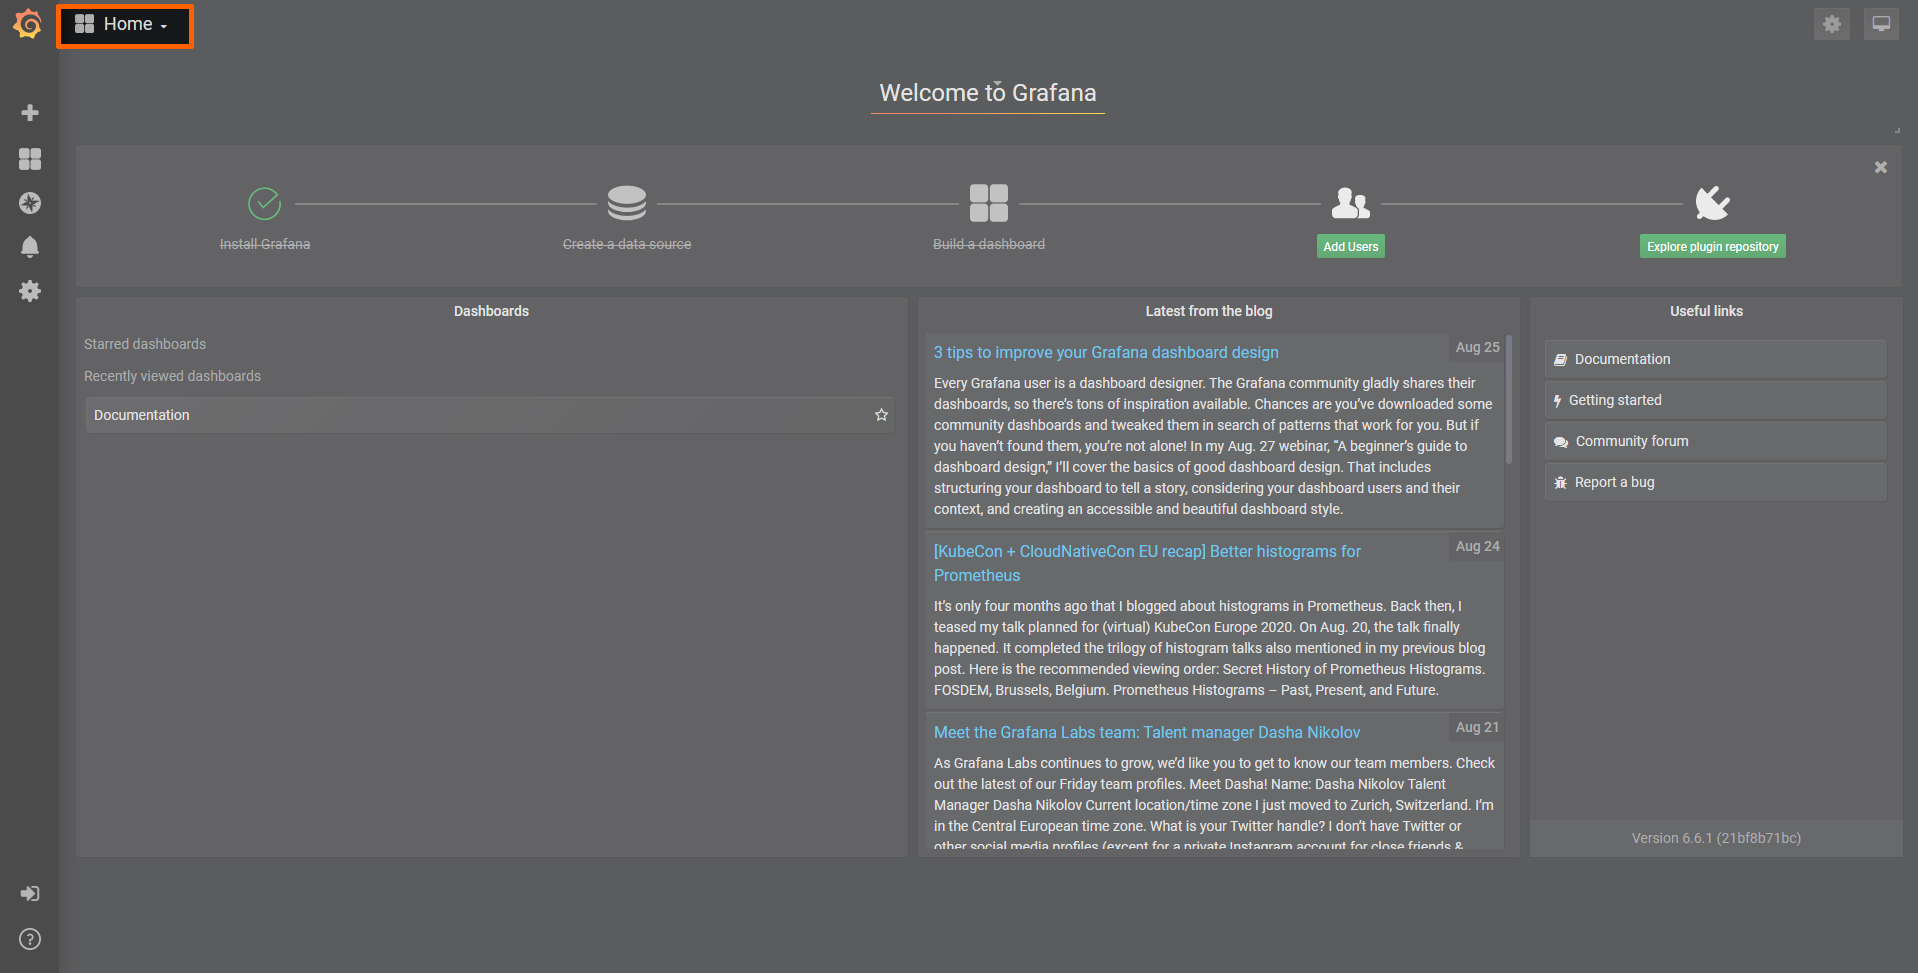
The Gateway collects data from the Modbus simulation server and stores it inside the InfluxDB. The data can now be visualized at the node. Open the local data visualization element through the Data Services UI on the node by selecting Visualization on the left.
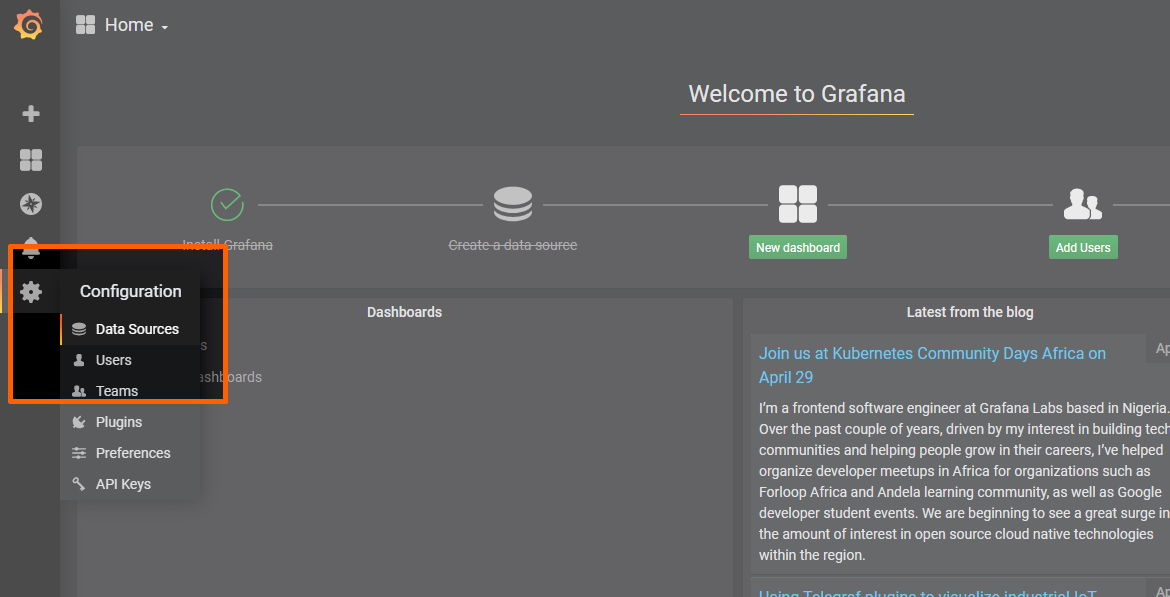
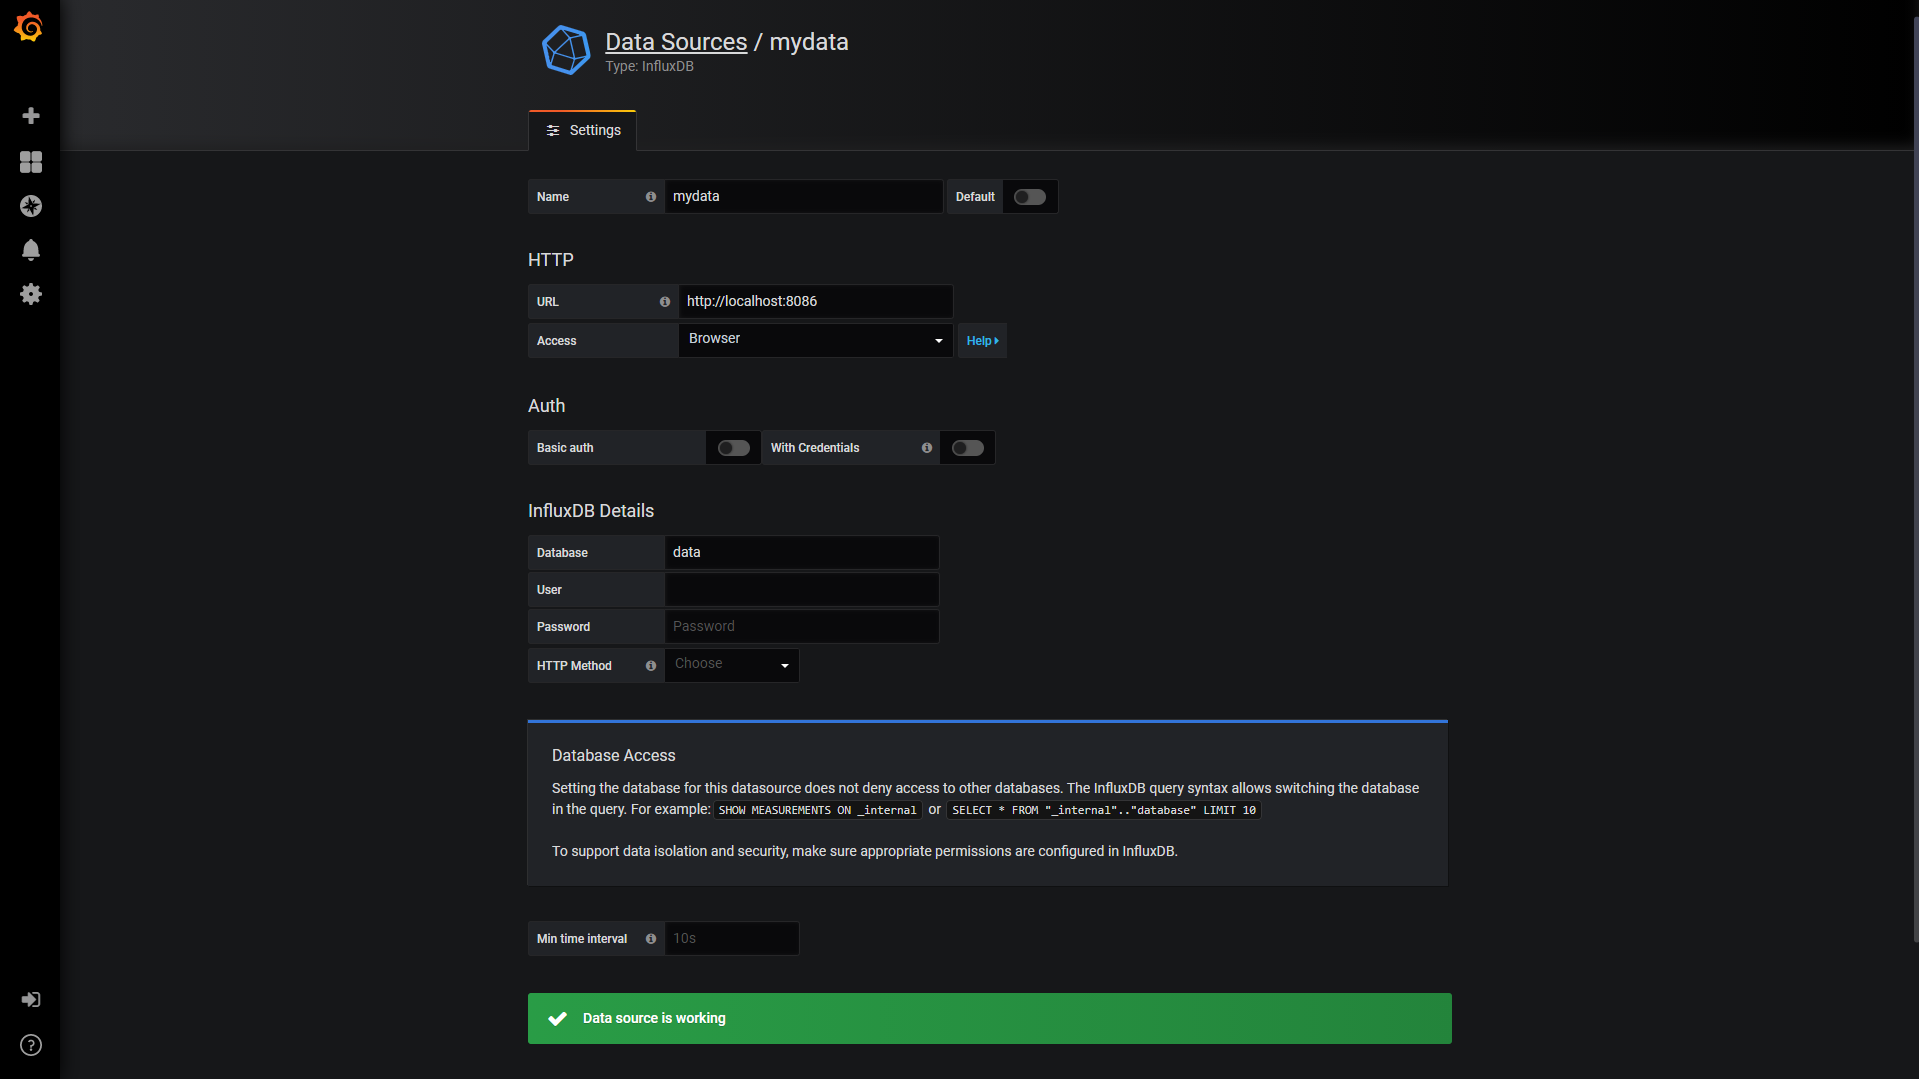
Configuring the InfluxDB as a data source
First, a new data source needs to be created since the data is collected into an InfluxDB.
- Select the gear symbol in the navigation on the left.
-
Select Data Source.
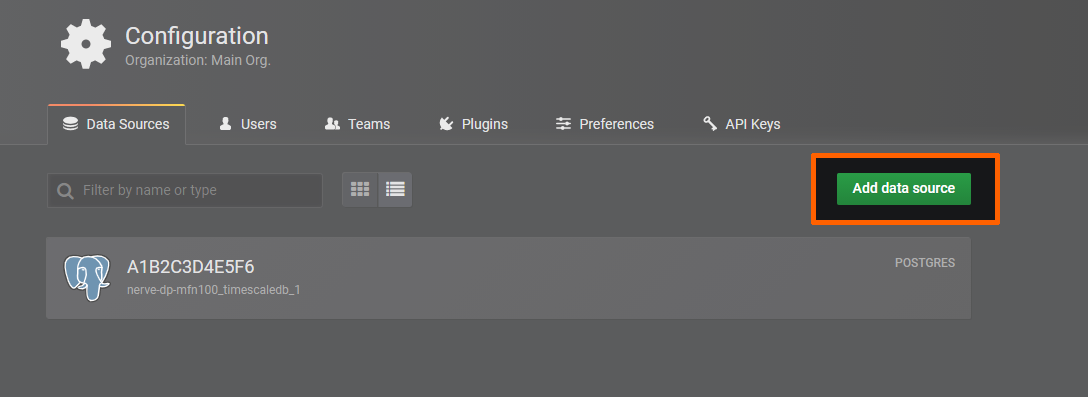
-
Select Add data source on the right.
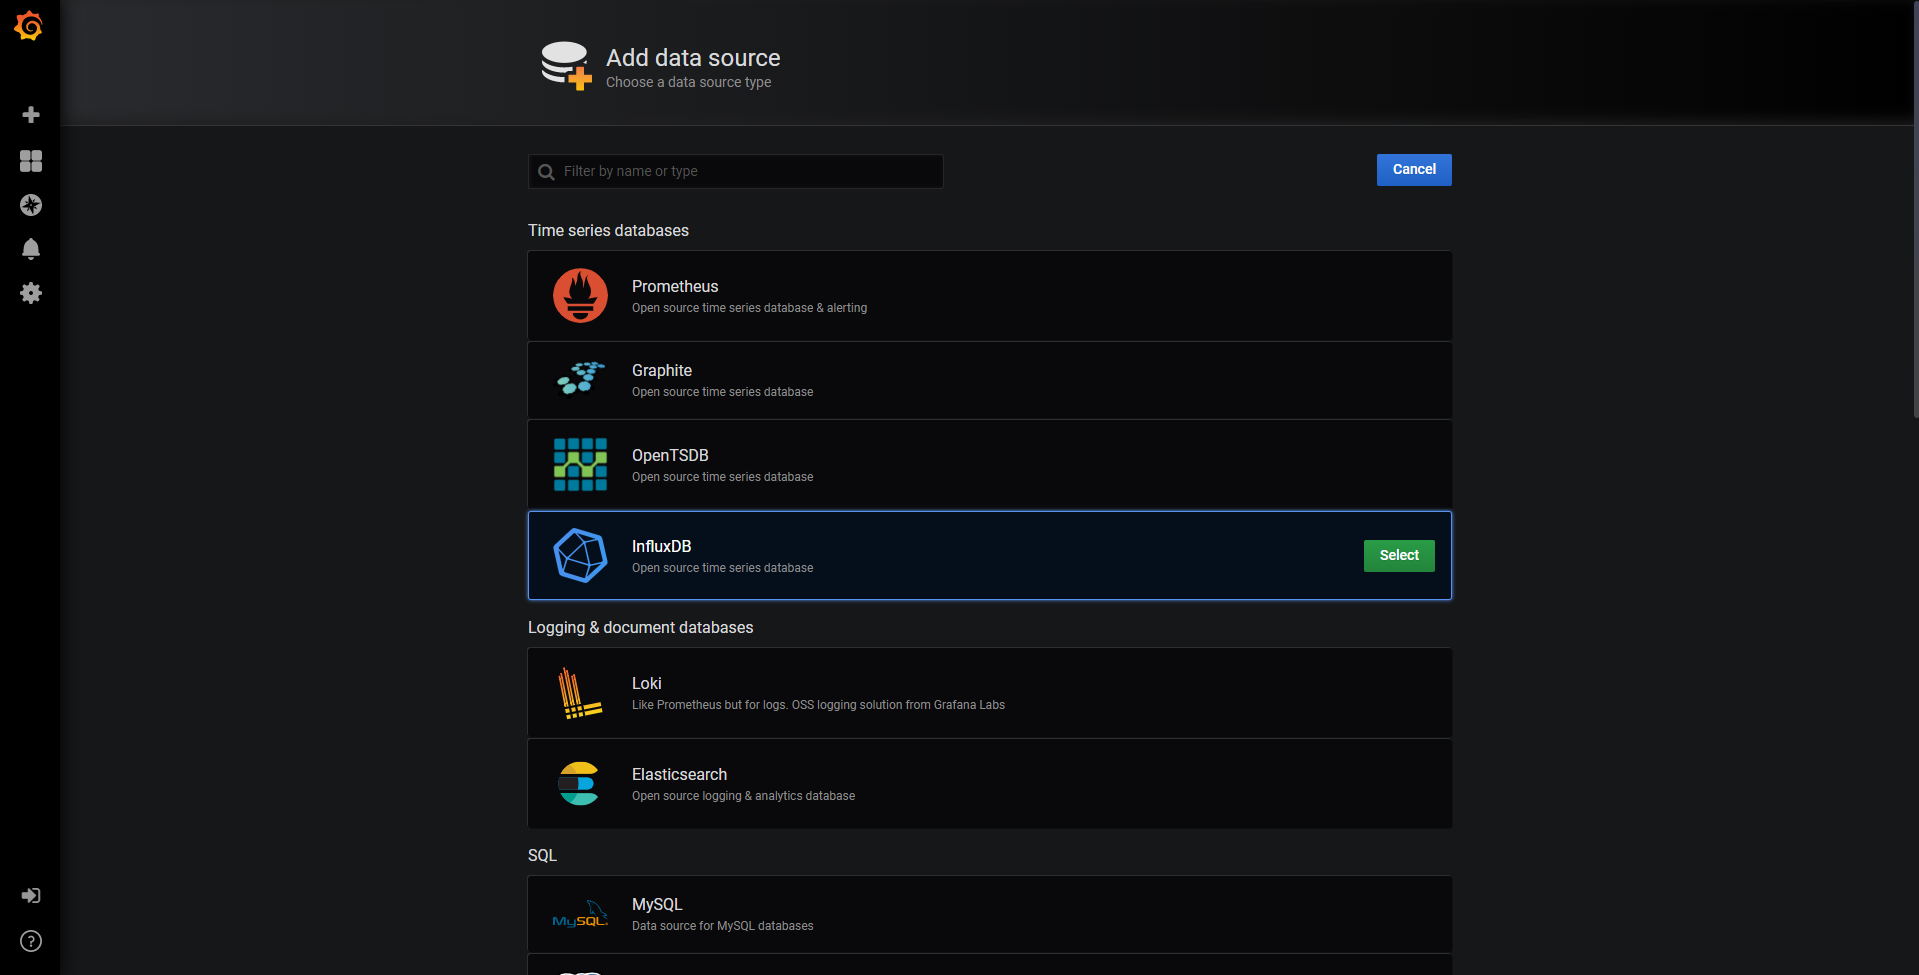
-
Select InfluxDB.
-
Enter the following settings:
Setting Value Name Enter any name for the remote connection.
This example usesmydata.URL http://localhost:8086Access Browser Database data -
Select Save & Test. A green box will appear if the configuration was successful.
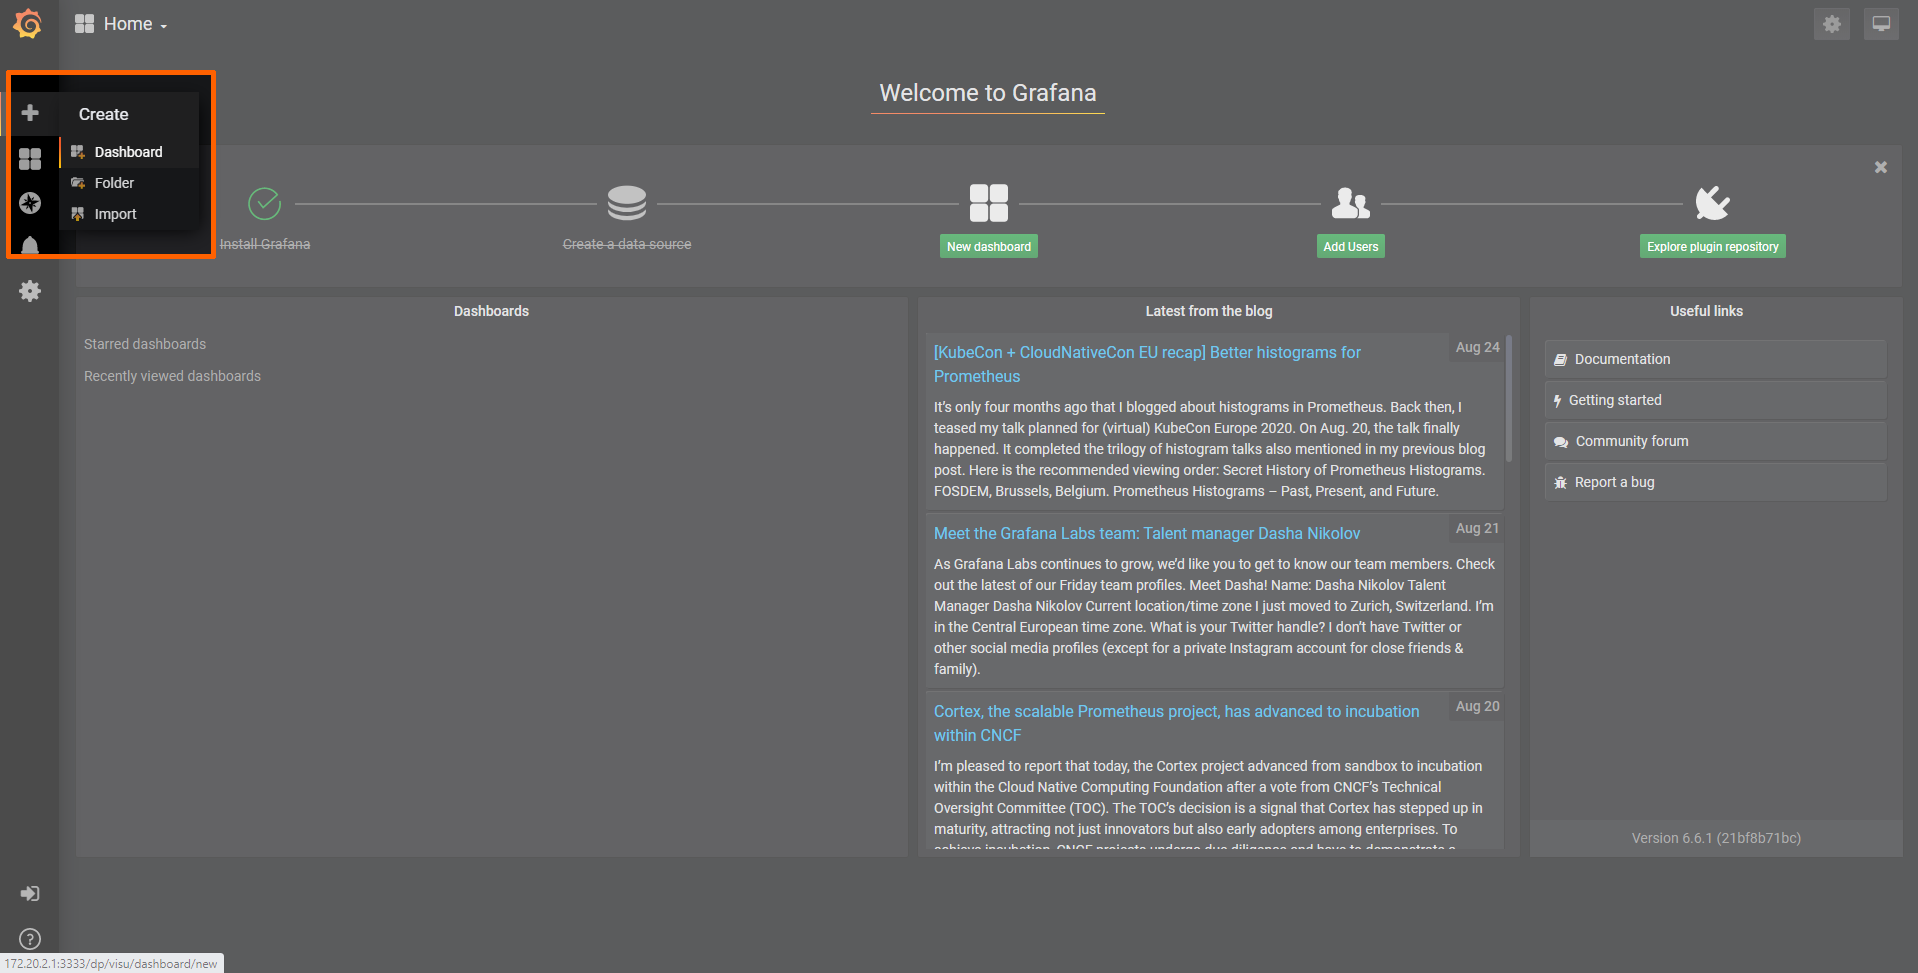
Creating a dashboard for visualization
With the data source defined, temperature and humidity data can now be visualized in a dashboard.
-
Select + > Dashboard in the navigation on the left. A box will appear.
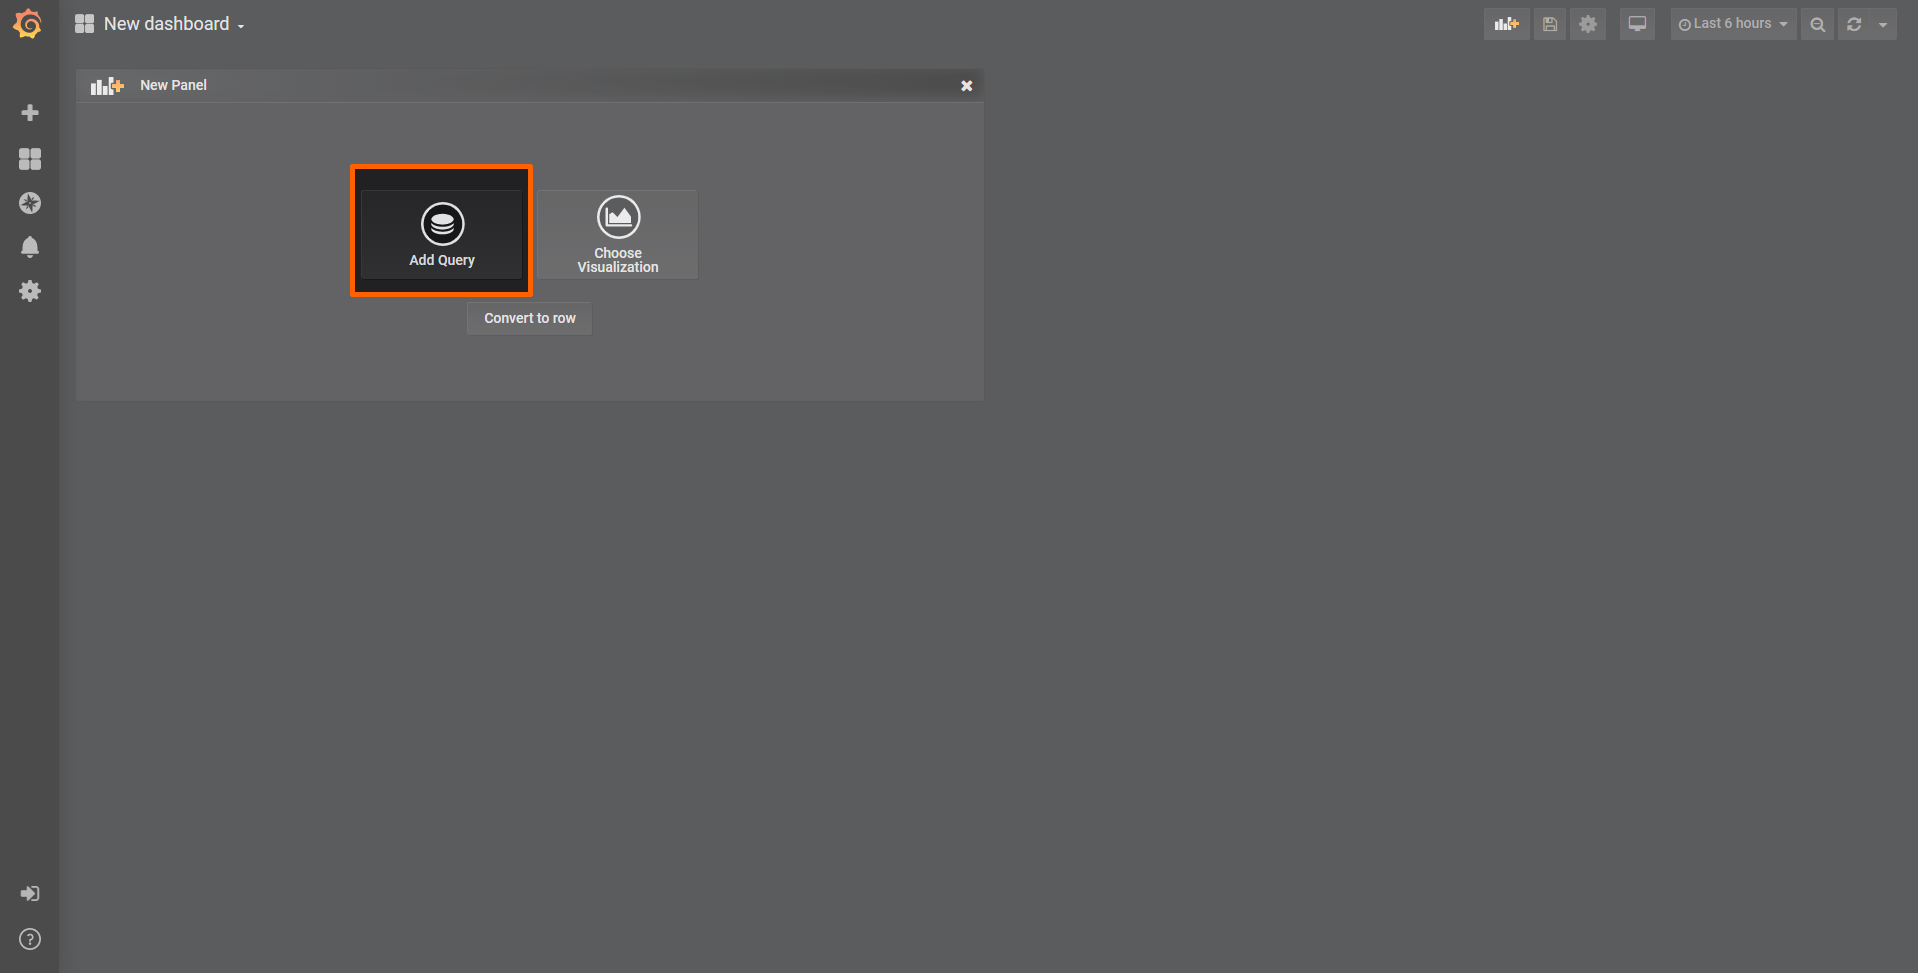
-
Select Add Query in the New Panel box.
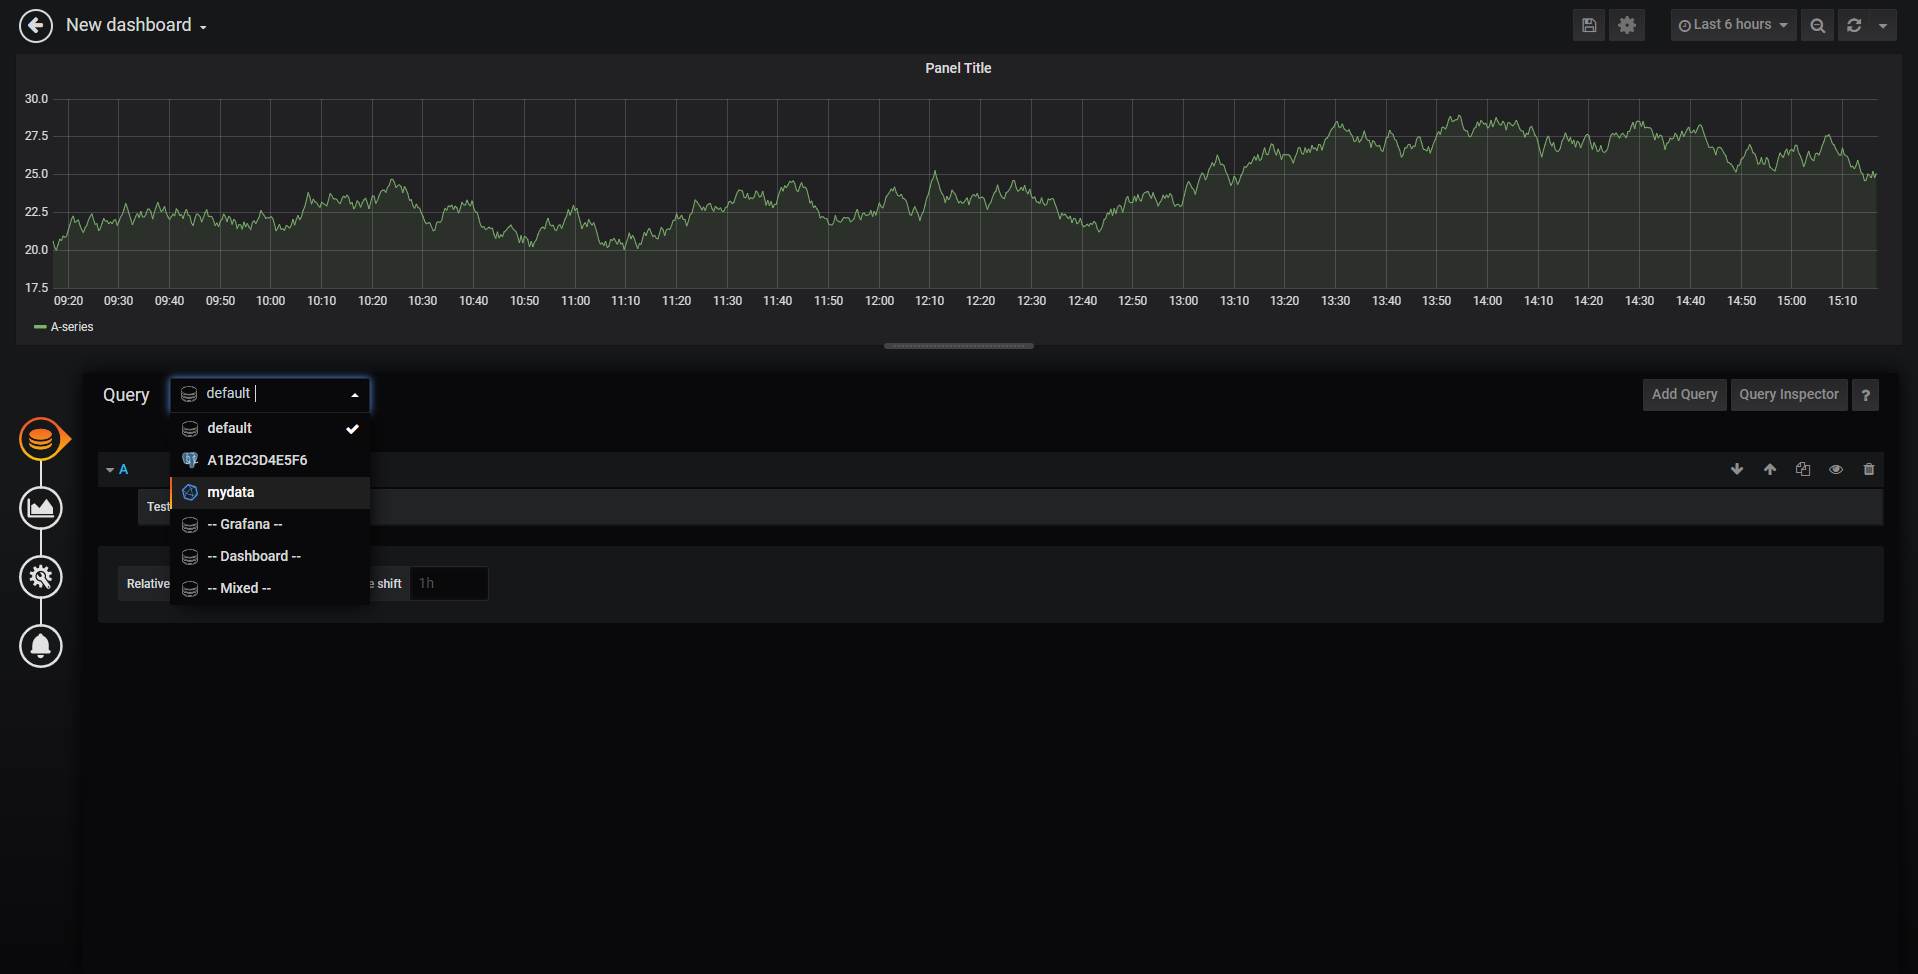
-
Select the InfluxDB data source that was created before. This example uses mydata as the data source.
-
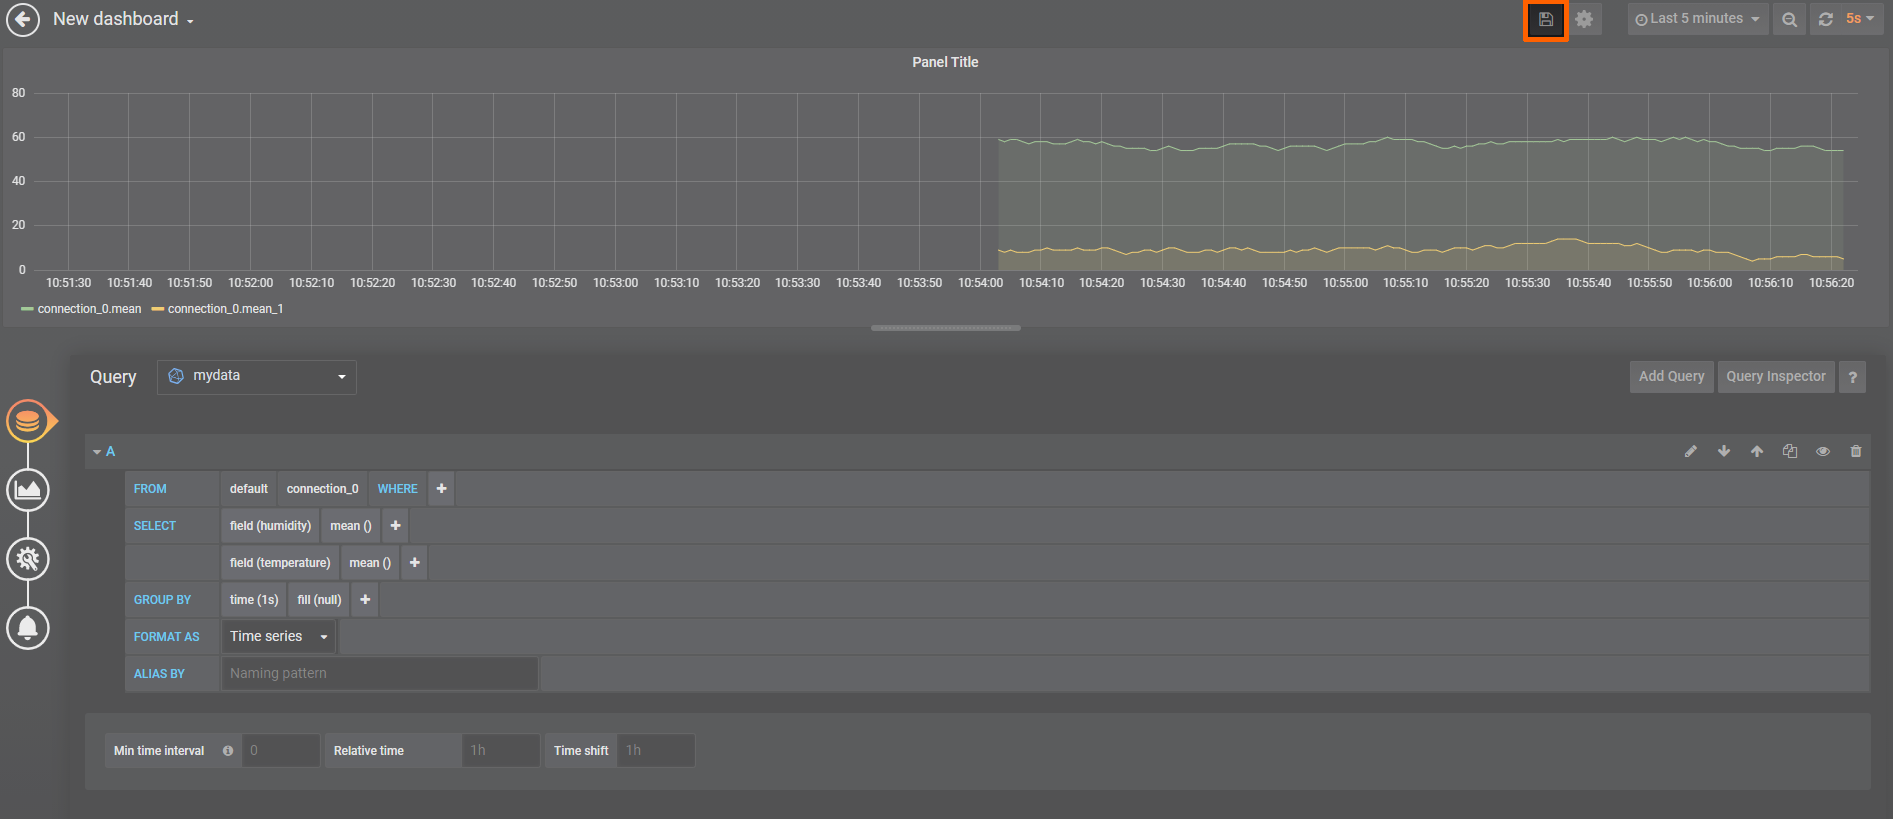
Fill in the following query information:
Setting Value FROM defaultconnectionSELECT field (humidity)field (temperature)GROUP BY time (1s)Format as Time series -
Select the save icon in the upper-right corner to save the dashboard.
The dashboard can be accessed from the Grafana home menu.