Setup and default operation
This section covers the hardware setup, explains the default operation of the kit and gives an introduction to the Management System.
Setting up the hardware
The MFN 100 is delivered in a separate box and has to be mounted on the kit. A mating connector is already connected to the power supply. Also, the SIMATIC ET 200SP I/O module is already connected to the I/O port of the MFN 100 with a network cable. In order to completely set up the kit, a power cord and two network cables are also required.
-
Mount the MFN 100 on the DIN rail on the left side of the kit.
Note
For help with mounting the MFN 100 on the DIN rail, refer to the Hardware Installation guide enclosed in the box of the MFN 100.
-
Plug the mating connector that is connected to the power supply into the bottom side of the MFN 100.
-
Connect port 2 of the MFN to a DHCP-enabled network with access to the Management System or internet access if the Management System is hosted by TTTech Industrial.
Note
Contact the IT administrator for help on how to allow external devices to connect to the network.
-
Connect the power cord to the power supply and to a power outlet. Make sure the power supply is turned off.
- Push the button to switch on the power supply.
The MFN 100 will start after a few minutes and the blue light will turn on. All necessary services are initiated and after that, data is sent to the Management System.
Default operation
The Nerve Blue Kit comes with two default applications which can replicate scenarios found in industrial automation. The applications allow for data to be generated at the I/O, be acquired by the MFN 100 via Ethernet fieldbus, translated to OPC UA and be sent to the cloud for visualization. The data can be generated as a continuous flow throughout the cycle, as a regular data flow, or as irregular event based data flow. These different data flows mimic various types of industrial process and show the functionality of the Data Services from I/O to cloud.
The applications use the push button that is connected to the SIMATIC ET200 SP I/O module via the terminal block. Data is sent between the SIMATIC I/O module and the MFN 100 I/O port via PROFINET and the illumination of the button is controlled via the CODESYS soft PLC running on the MFN 100.
The two default CODESYS applications: app1 and app2 are used to alter flow of data from the I/O modules. Both apps control the illumination of the button and record two values: iCountNumber and
iCountButton.
| app1 | app2 | |
|---|---|---|
| iCountNumber (continuous data flow from the application to the Management System) |
|
|
| iCountButton (irregular and regular data flow from the application to the Management System) |
|
|
In both application modes the calculated values are sent to the Management System and displayed in Grafana for visualization. The Management System allows users to deploy either of the default applications from the repository to the MFN 100. This demonstrates the ability to update CODESYS applications remotely and alter applications running on machines wherever they are in the world.
Beyond the two default applications, the kit can be used to develop custom CODESYS applications, which can be uploaded to the repository in the Management System and then deployed to the MFN 100. These applications can then be used in conjunction with corresponding actuators and/or sensors.
Note
The default application app1 is loaded automatically during the initial startup of the MFN 100.
Connecting to the Management System
The Nerve Management System is a web-based service that permits management of Nerve Blue nodes that are registered.
Note
Google Chrome or Firefox Version 63 or later are recommended for the usage of the Management System.
Before connecting, make sure that the MFN 100 of the starter kit is connected to the network through port 2 and that an IP address has been assigned by the DHCP server. Contact the IT administrator for help with assigning an IP address.
The login credentials for the Management System are in the customer profile. The customer profile has been sent in form of a PDF as part of the delivery.
Note
If a customer profile has not been part of the delivery, contact a sales representative or TTTech Industrial customer support at support@tttech-industrial.com.
- Go to the URL of the Management System in the customer profile.
-
Log in with the credentials provided in the customer profile.

The Management System will show the node tree by default.
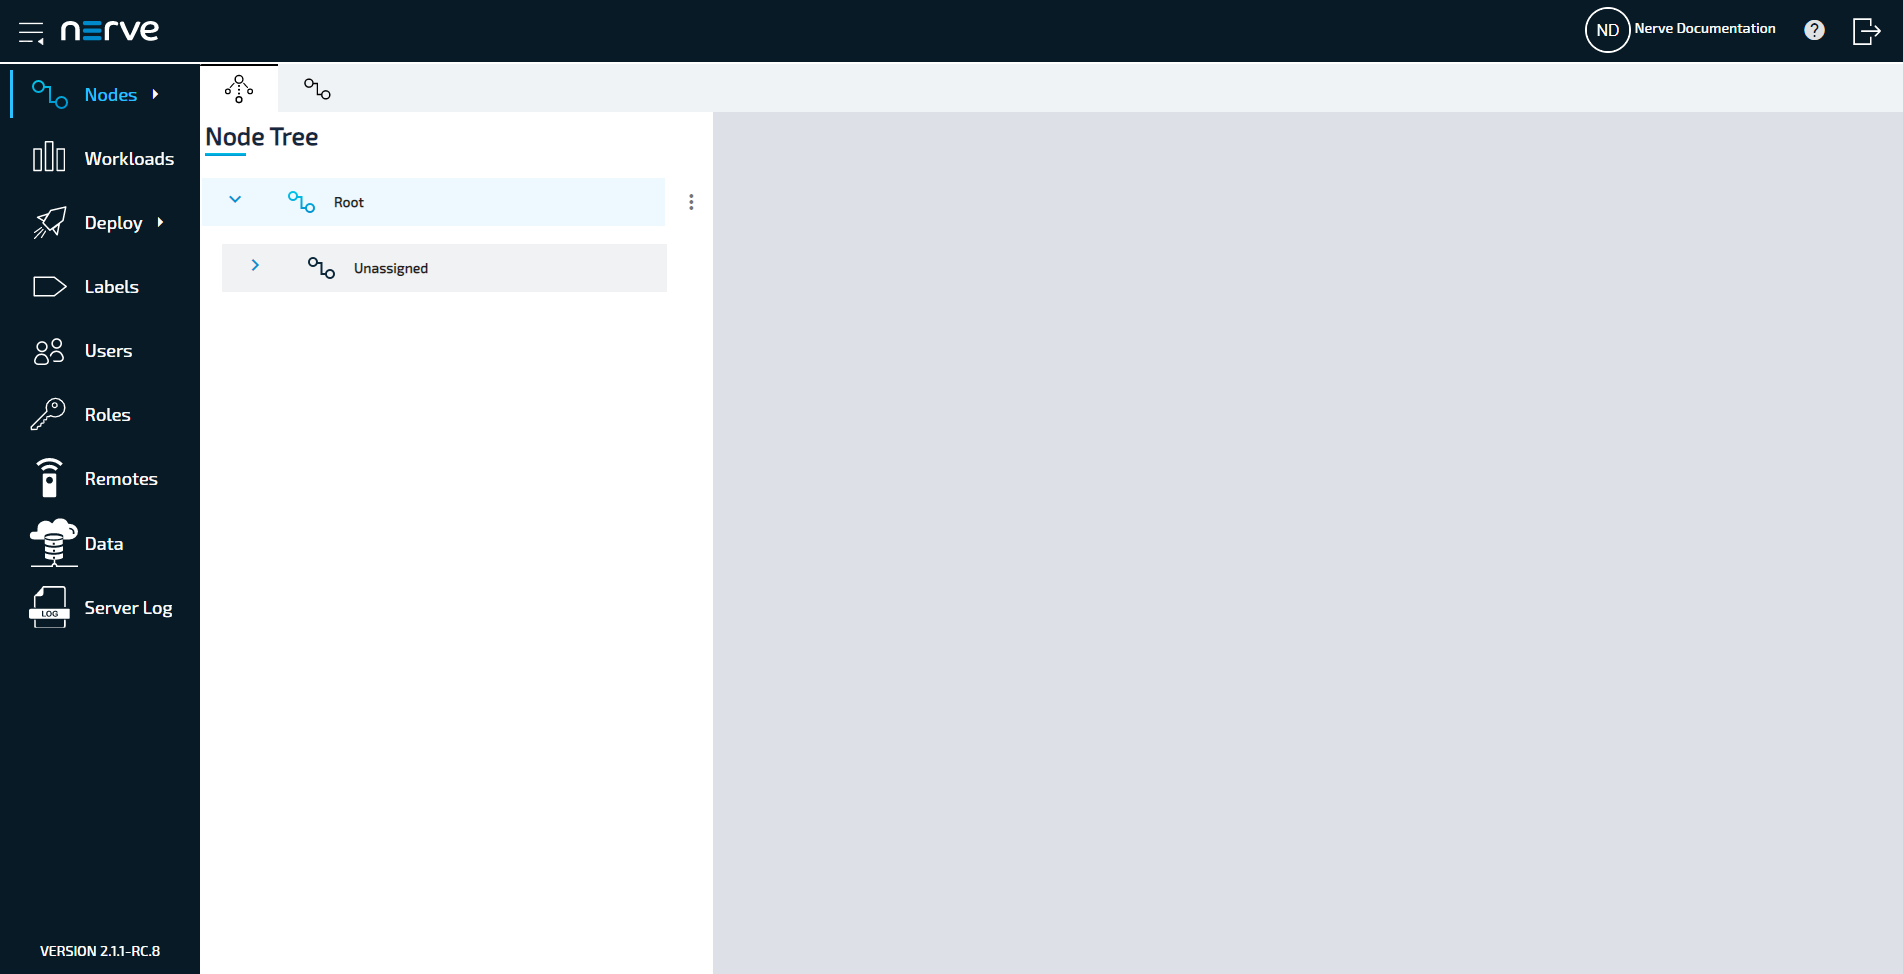
One element in the node tree is already created at first login, containing the MFN 100 of the Nerve Blue Kit. All newly registered nodes will be located under Root > Unassigned by default.
Manage nodes, provision workloads and deploy workloads among other options from here. Refer to the user guide for more information on the Management System.
Note
Port 443 (HTTPS) and port 8883 (MQTTS) of the corporate firewall have to be open for communication between nodes and the Management System.
Moving a node from one tree element to another
Moving nodes in the node tree is possible by drag and drop. Make sure to create a new tree element before attempting to move a node.
- Select Nodes in the navigation on the left.
- Select the node tree tab
 on the right.
 - Expand the tree element of the node that will be moved. The default element is Root > Unassigned.
- Choose the node to move.
- Drag and drop the node to the newly created element. Elements expand automatically when they are hovered over.
-
Select APPLY CHANGES (n) in the upper-right corner of the node tree.
Note
(n)is a placeholder for the number of changes made to the node tree. For three performed changes,(3)will be displayed in the button above the node tree.
The node has now been moved to the new element. Note that a node cannot be moved back to Unassigned once it has been moved to another element.
Viewing data in the Management System
Data that is being sent to the Management System can be viewed through the Grafana element in the Data Services instance of the Management System. The default values iCountNumber and iCountButton are set up by default. The URL of the Management System and the login credentials can be found in the customer profile. It has been sent in form of a PDF as part of the delivery.
- Log in to the Management System.
-
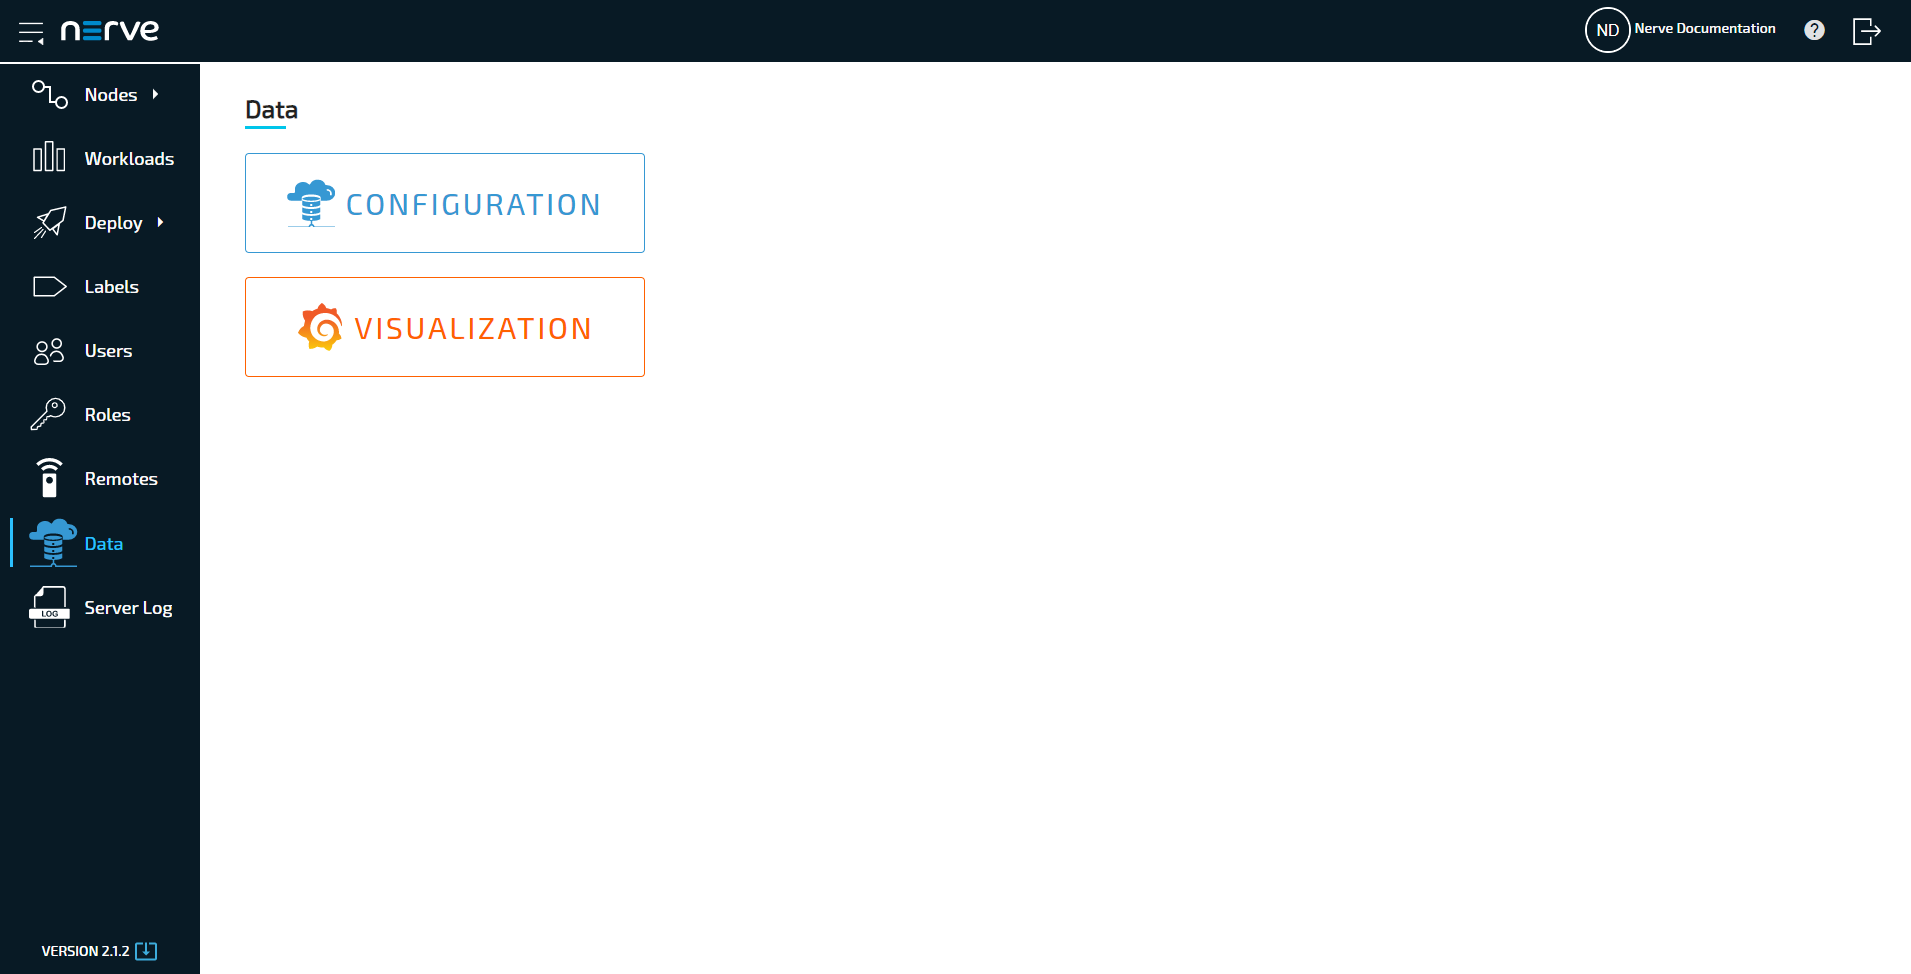
Select Data in the navigation on the left.
Note
If the menu item Data is not available, make sure the logged in user has the permission to access the Data Services. Refer to Assigning a role to a user for more information.
-
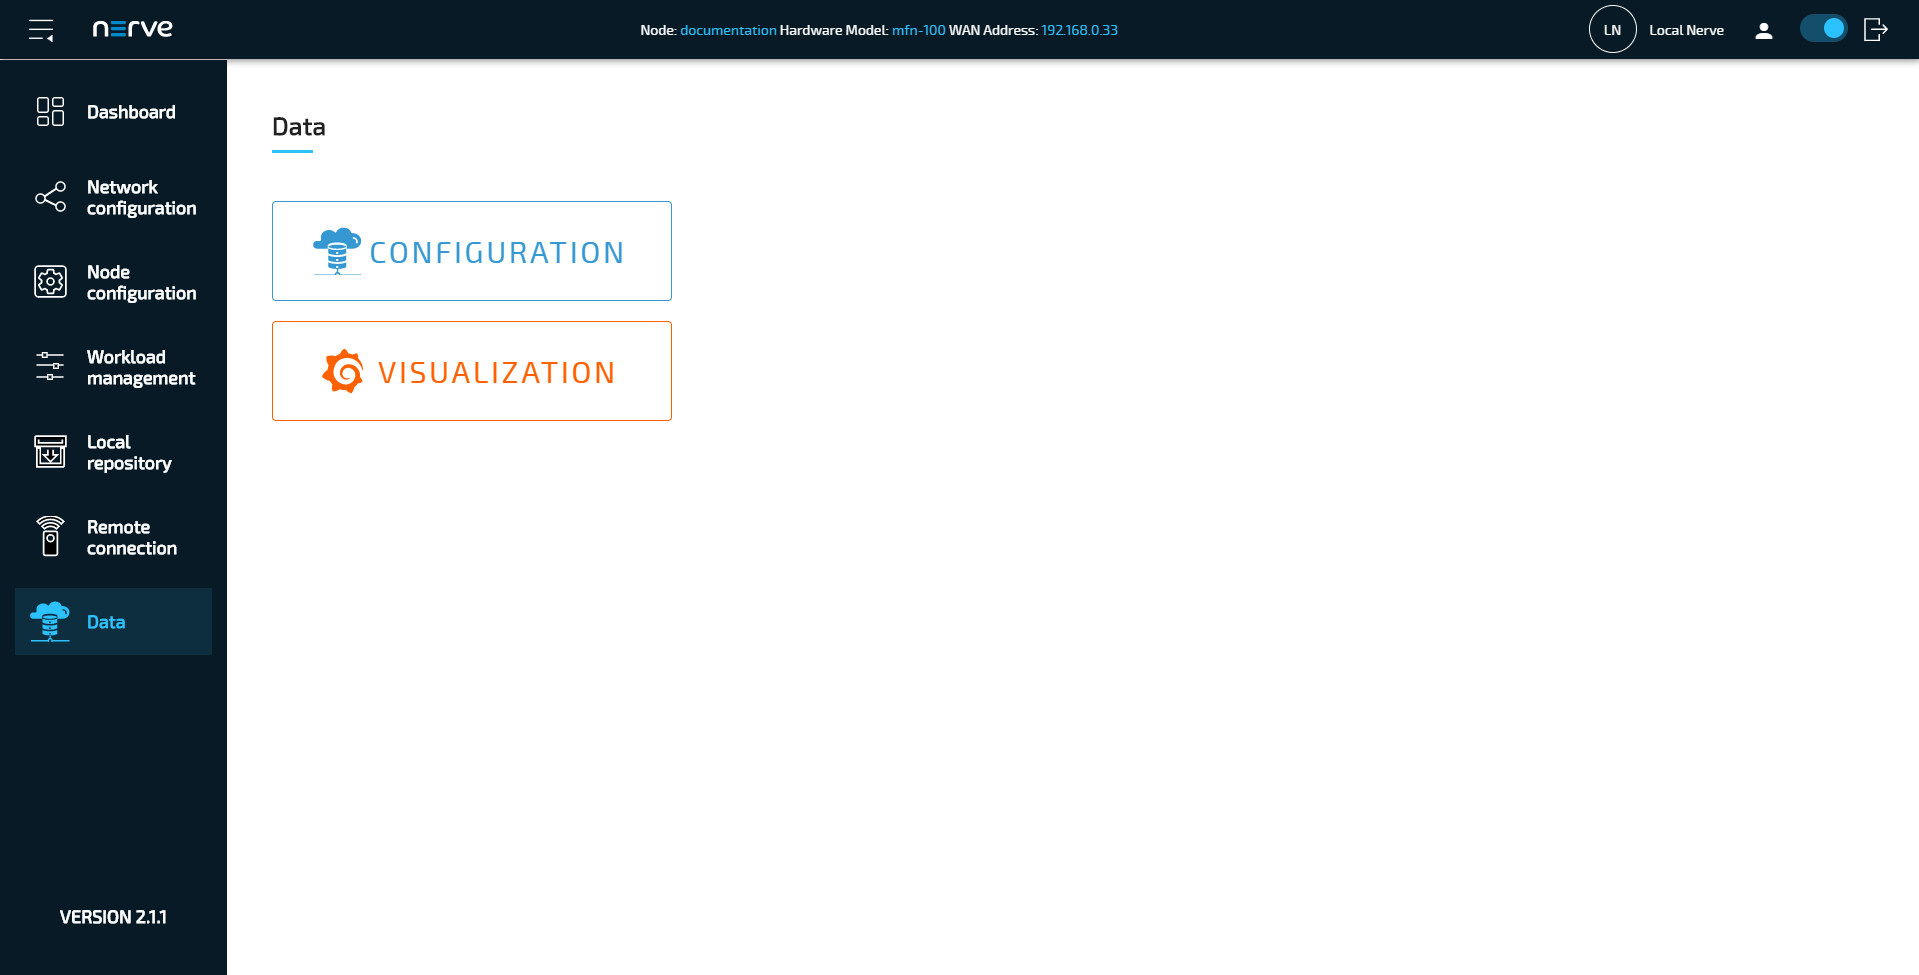
Select VISUALIZATION.
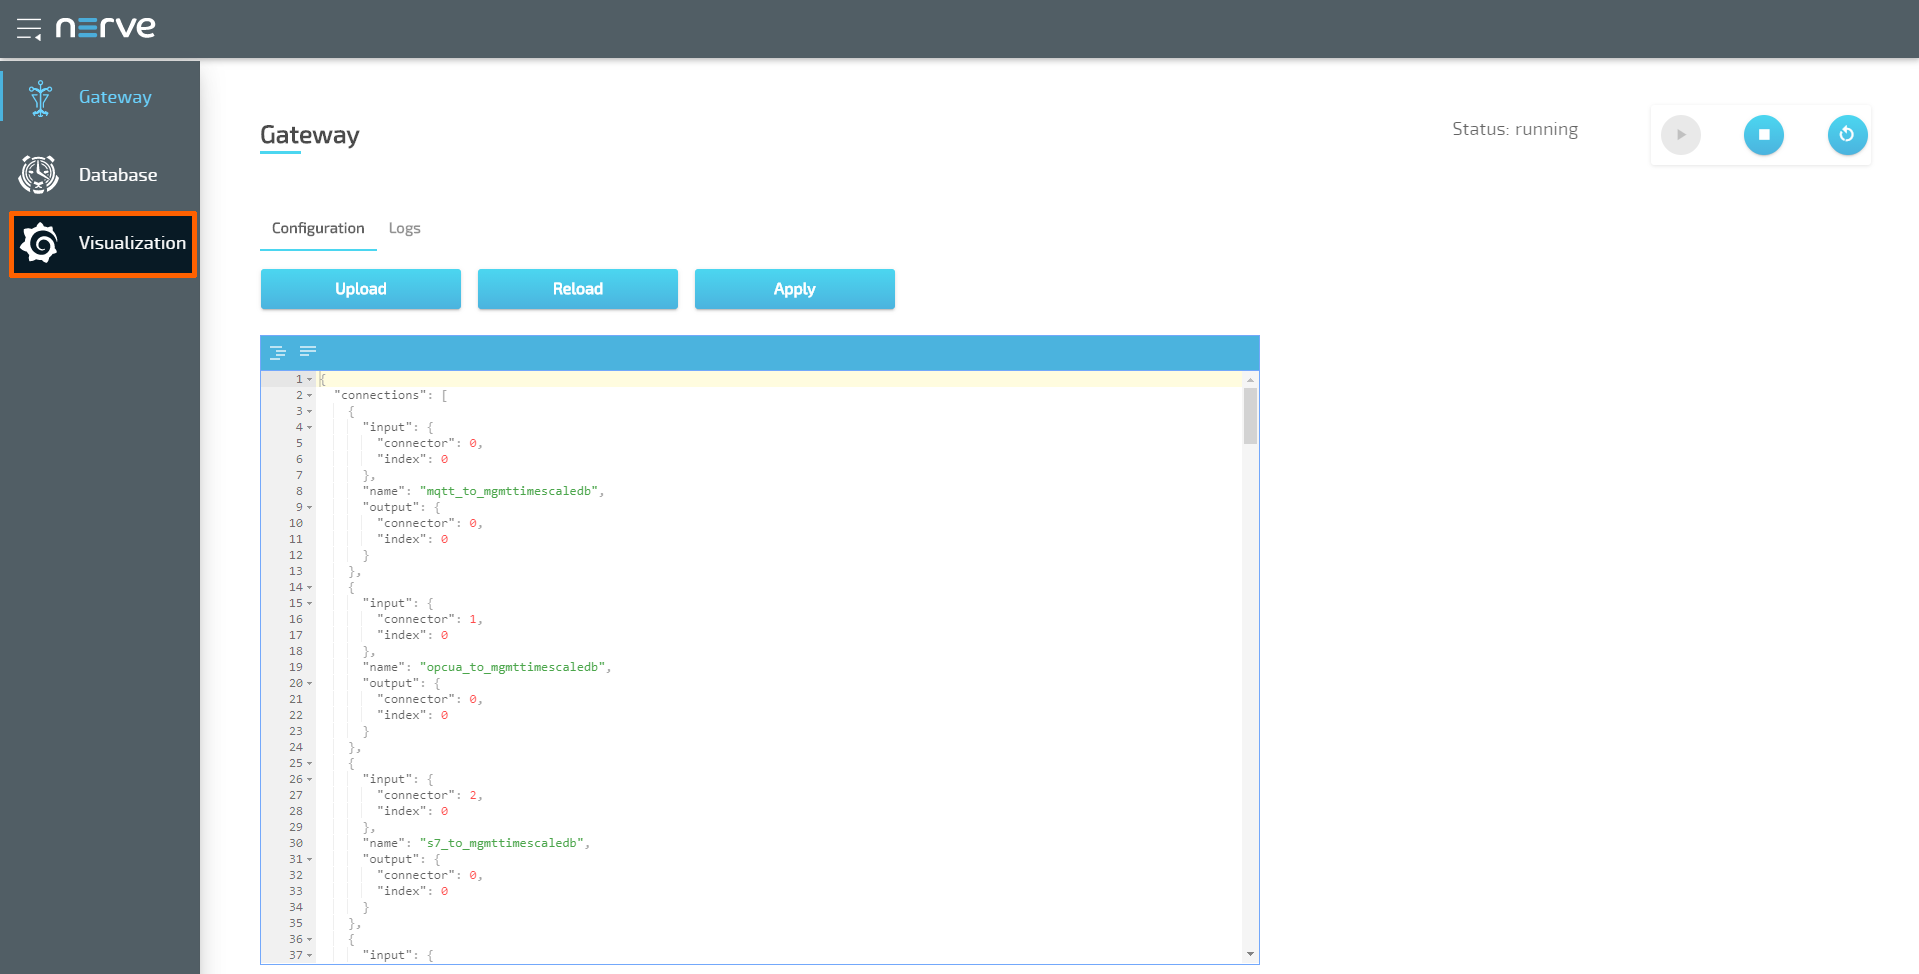
Note
The visualization element can also be reached from the Data Services UI. When in the Data Services UI, select Visualization in the navigation on the left and select Open to reach the Grafana UI.
-
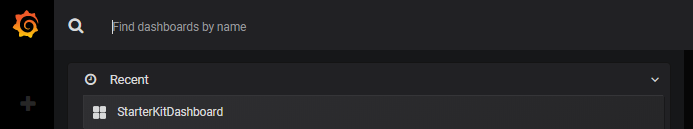
Select Home in the upper-left corner.
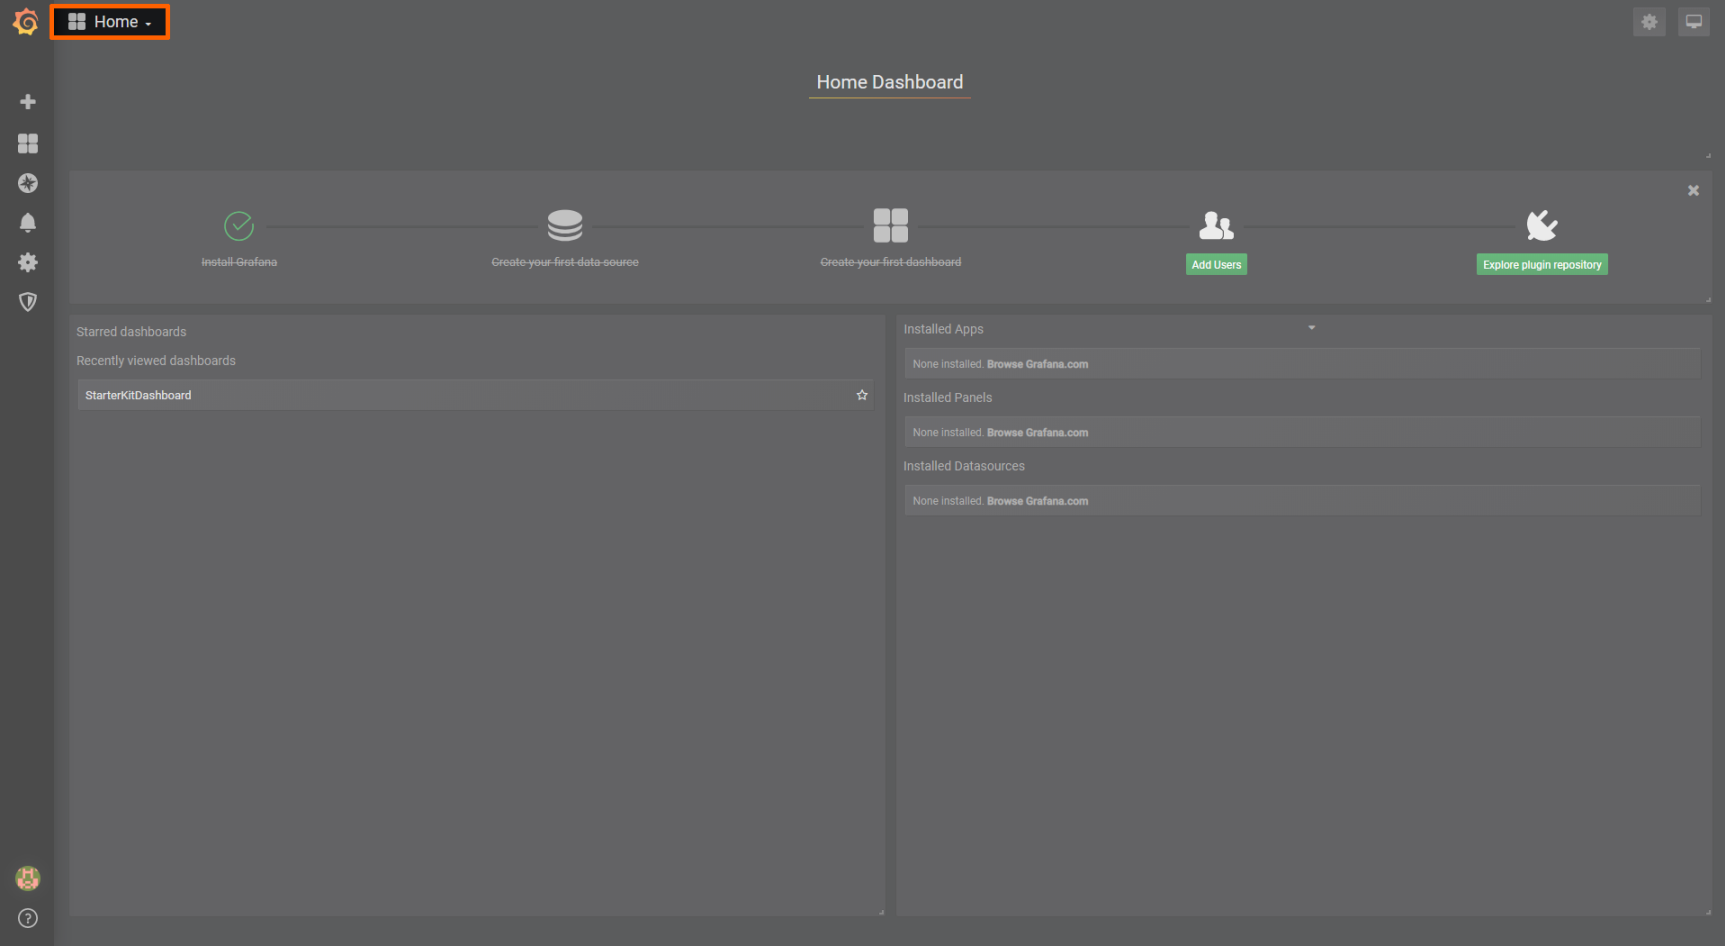
-
Select Nerve Blue Kit underneath the search bar.
This is the visualization of live data from the MFN 100. The calculated values, iCountNumber and iCountButton, that are generated in the default CODESYS applications app1 and app2 are displayed here by default.
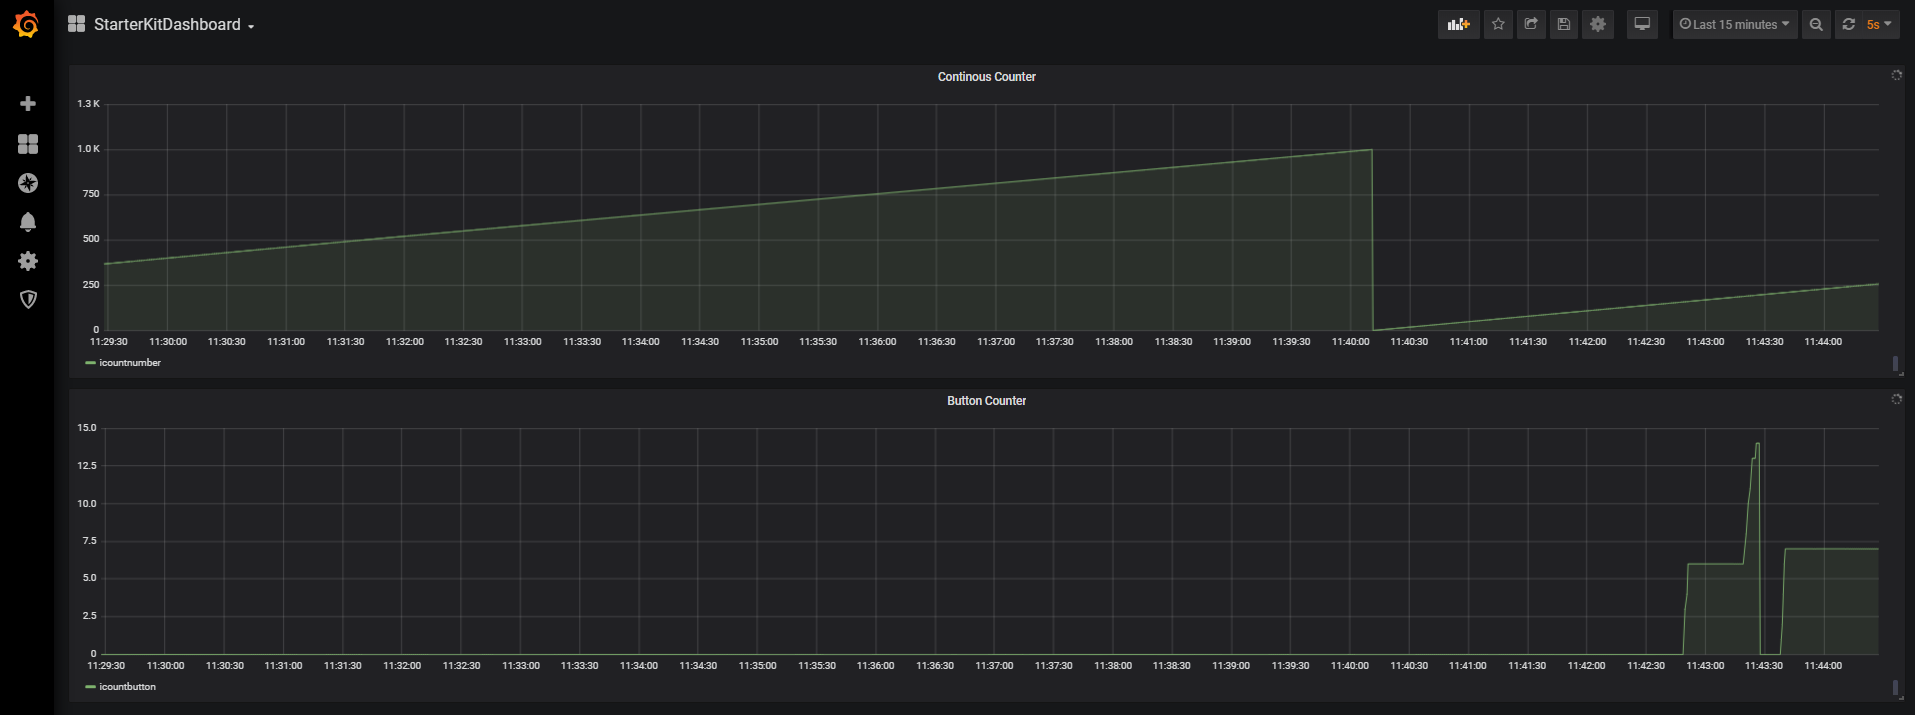
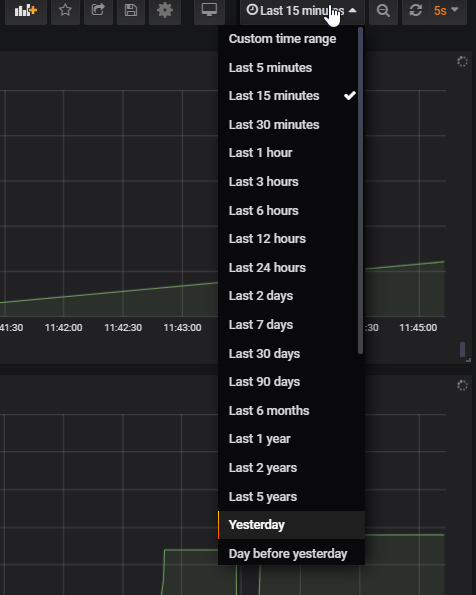
The data automatically updates every 5 seconds. To change the update rate and the visible time range, access the settings by clicking the clock symbol in the upper-right.
Viewing data on the Nerve Device
Data can also be viewed locally on the Nerve Device. The default values iCountNumber and iCountButton are set up by default.
- Connect the workstation to the console port P1 of the MFN 100.
-
Configure the network adapter through which the workstation is connected to the MFN 100 the following way:
IP address 172.20.2.90Subnet mask 255.255.255.0 -
Follow this link to reach the Local UI: http://172.20.2.1:3333.
- Log in with the credentials from the customer profile.
- Select Data in the navigation on the left.
-
Select VISUALIZATION.
Note
The visualization element can also be reached from the Data Services UI. When in the Data Services UI, select Visualization in the navigation on the left and select Open to reach the Grafana UI.
-
Select Home in the upper-left corner.
-
Select Nerve Blue Kit underneath the search bar.
This is the visualization of live data from the MFN 100. The calculated values, iCountNumber and iCountButton, that are generated in the default CODESYS applications app1 and app2 are displayed here by default.
The data automatically updates every 5 seconds. To change the update rate and the visible time range, access the settings by clicking the clock symbol in the upper-right.