Tutorial: Machine efficiency insight
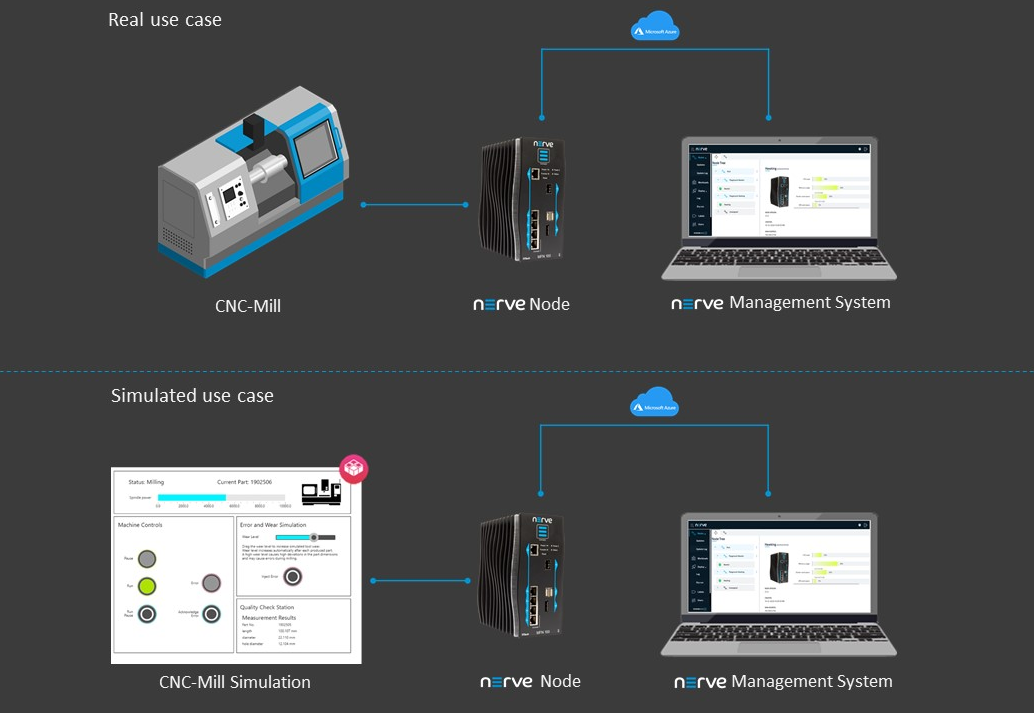
Nerve is a platform for applications running on machines and accessing machine data. This tutorial shows how to create an application to gain insight into production and machine efficiency. It shows how to use Nerve to measure and visualize overall equipment effectiveness (OEE) of a virtual CNC mill. In a real-life environment a CNC mill would be physically connected to a Nerve Node with Nerve Blue installed. A remote connection is established to the Nerve Node via the Nerve Management System.
Going through this demo will take about 30 minutes and cover how to deploy container workloads, remotely access nodes and configure a Node-RED system to display an OEE and quality control dashboard.
Items needed for this tutorial are:
- a workstation or PC
- login credentials to the Nerve Management System and the filesharing server
- the Nerve Connection Manager app
- a flow file for Node-RED
All links, login credentials and the instructions to download files will be sent via emails. In case files or login credentials are missing, contact trynerve@tttech-industrial.com.
The tutorial environment is set up in the evaluation laboratory at TTTech Industrial in Vienna. The Nerve Device is an MFN 100 running an Intel Atom quad core CPU.
note
In case the evaluation system is used, be aware that other users may access the same evaluation system, meaning that other nodes might be registered in the Management System. Information and workloads uploaded into the system may be visible to other users.
Tutorial architecture
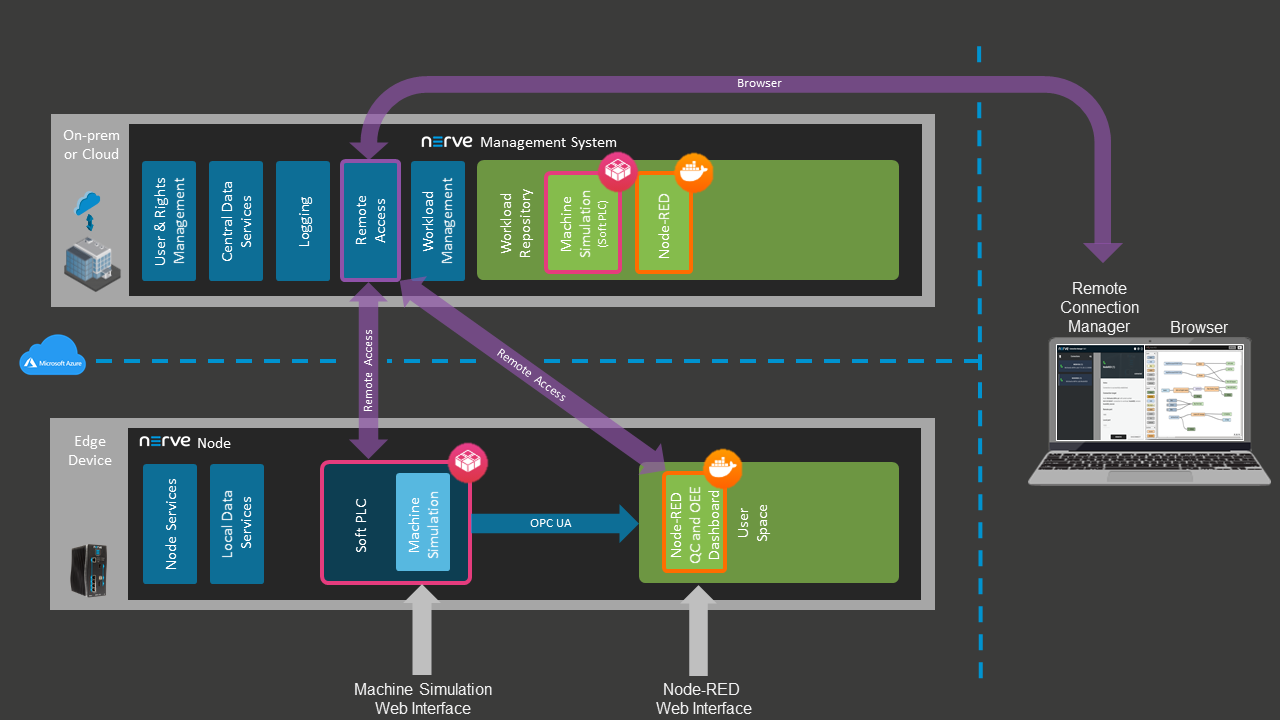
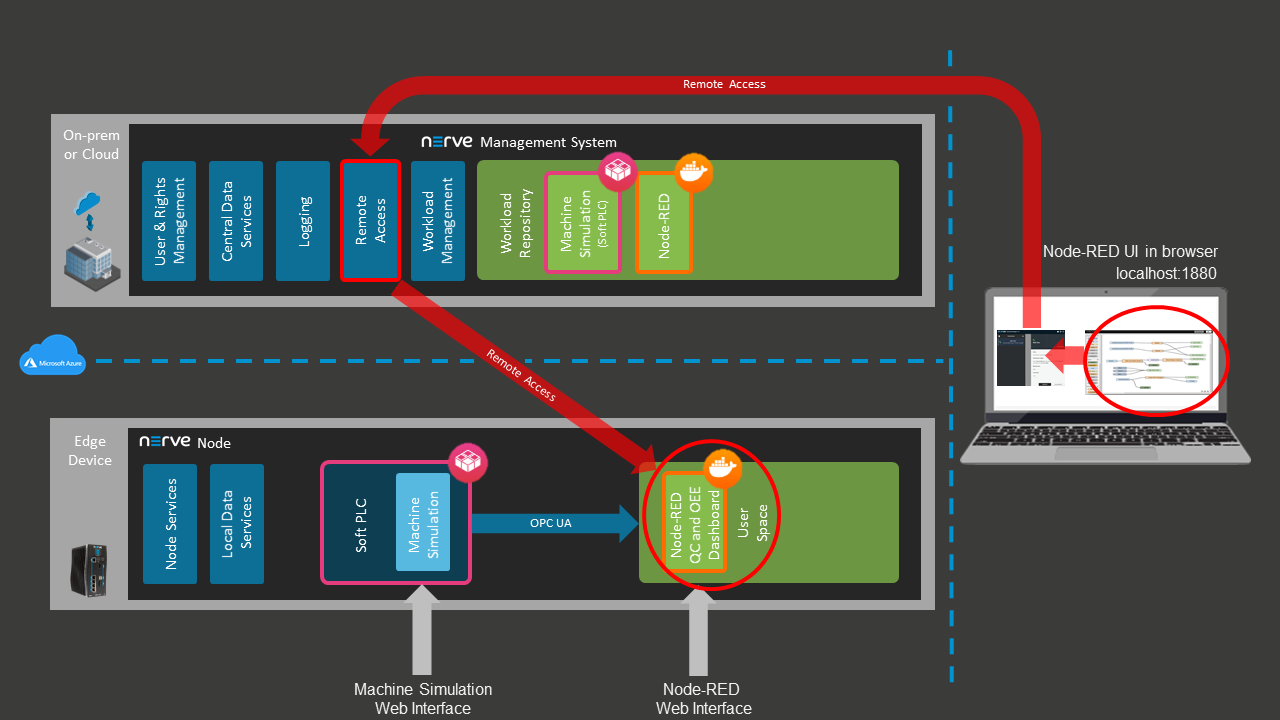
In the course of this tutorial a simulation of a CNC machine (machine simulation) is installed on a Nerve Device. This machine simulation creates data which is read by the Node-RED application and visualized on a server running on the Nerve Device. The Node-RED application transforms the data received into an OEE and quality dashboard. The machine simulation, Node-RED and all dashboards are accessed on the Nerve Device directly, using the remote access feature of the Nerve cloud management platform called the Nerve Management System. In Nerve, applications managed by customers are called workloads.
Machine simulation
The simulation model simulates a machine which continuously creates parts and is subject to wear. The machine provides status information and Quality Control information through a built-in OPC UA server. The application is programmed in IEC 61131-3 and running in a soft PLC.
Node-RED
Node-RED is an open source programming tool for wiring together sensor inputs, APIs and online services. In this tutorial Node-RED reads data from the machine simulation through OPC UA, modifies it and displays it on an OEE and quality dashboard. The system is implemented based on predefined graphical modules, which are connected through drag and drop.
Refer to Node-RED documentation for more information on Node-RED. TTTech provides Node-RED as a supported third party application.
Initial setup
The Nerve Management System is set up so that the tutorial can be started straightaway. The necessary applications have already been configured and the remote connections are set up. The evaluation system does not limit experimentation to the extent of this tutorial. It is possible to create, deploy and test new workloads. However, the features of Local UI, Data Services and user management are not enabled in the standard evaluation system. Contact sales@tttech-industrial.com for information on how to obtain the full version.
To explore the Nerve system even further, refer to the user guide.
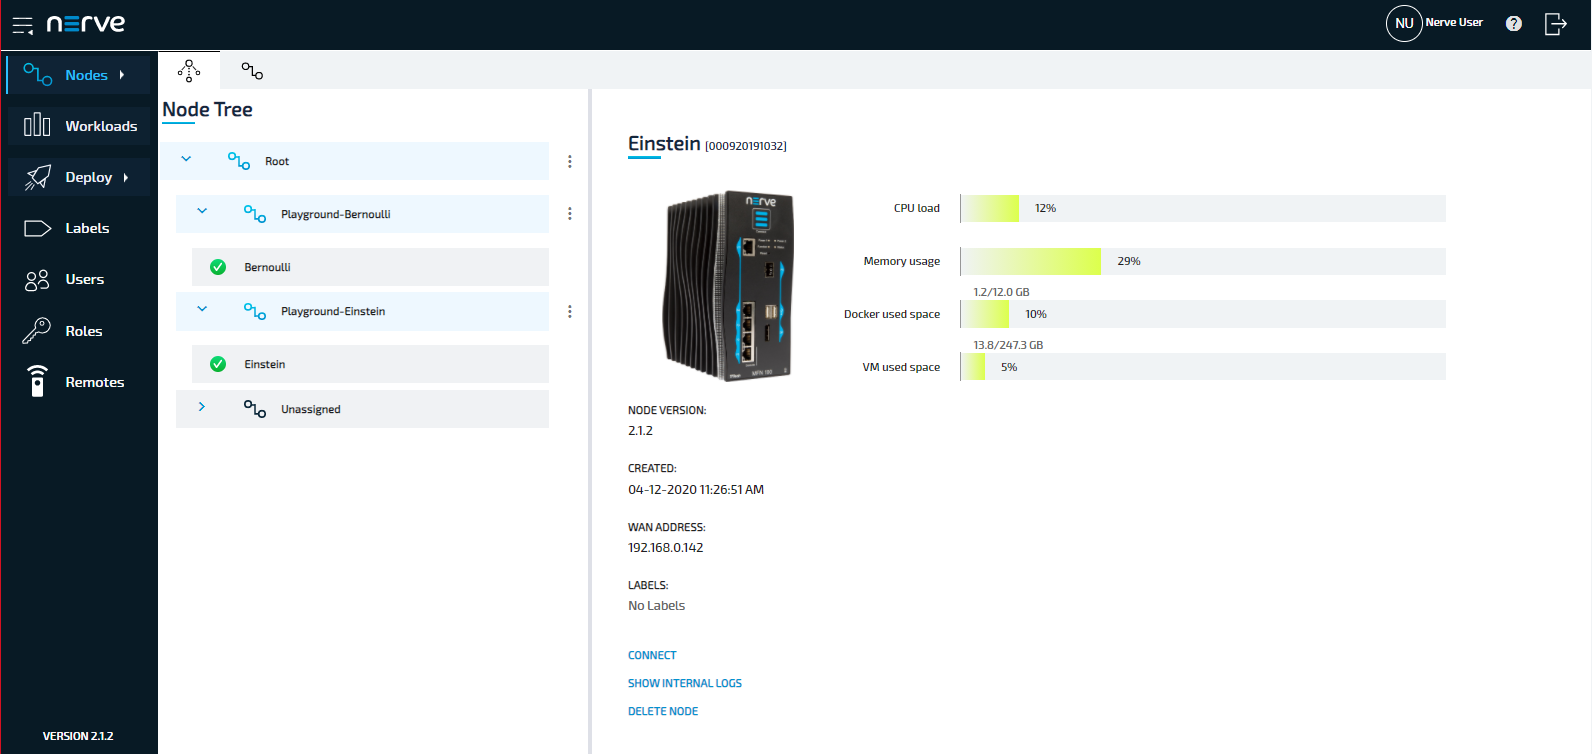
Viewing nodes in the node tree
The node tree is the first visible page of the Management System after logging in. It presents a means of organization for nodes that are connected to the Management System. Nodes are embedded into elements of the node tree.
- Log in to the Management System with your credentials.
-
Look for your node in the node tree. It is embedded in its own tree element.
Note
The node and the tree element are named after a scientist. The name has been sent in an email.
Be aware that other users may access the same evaluation system. Make sure to use the designated node that was mentioned in the instruction emails.
Step 1: Deploying the machine simulation and Node-RED workloads
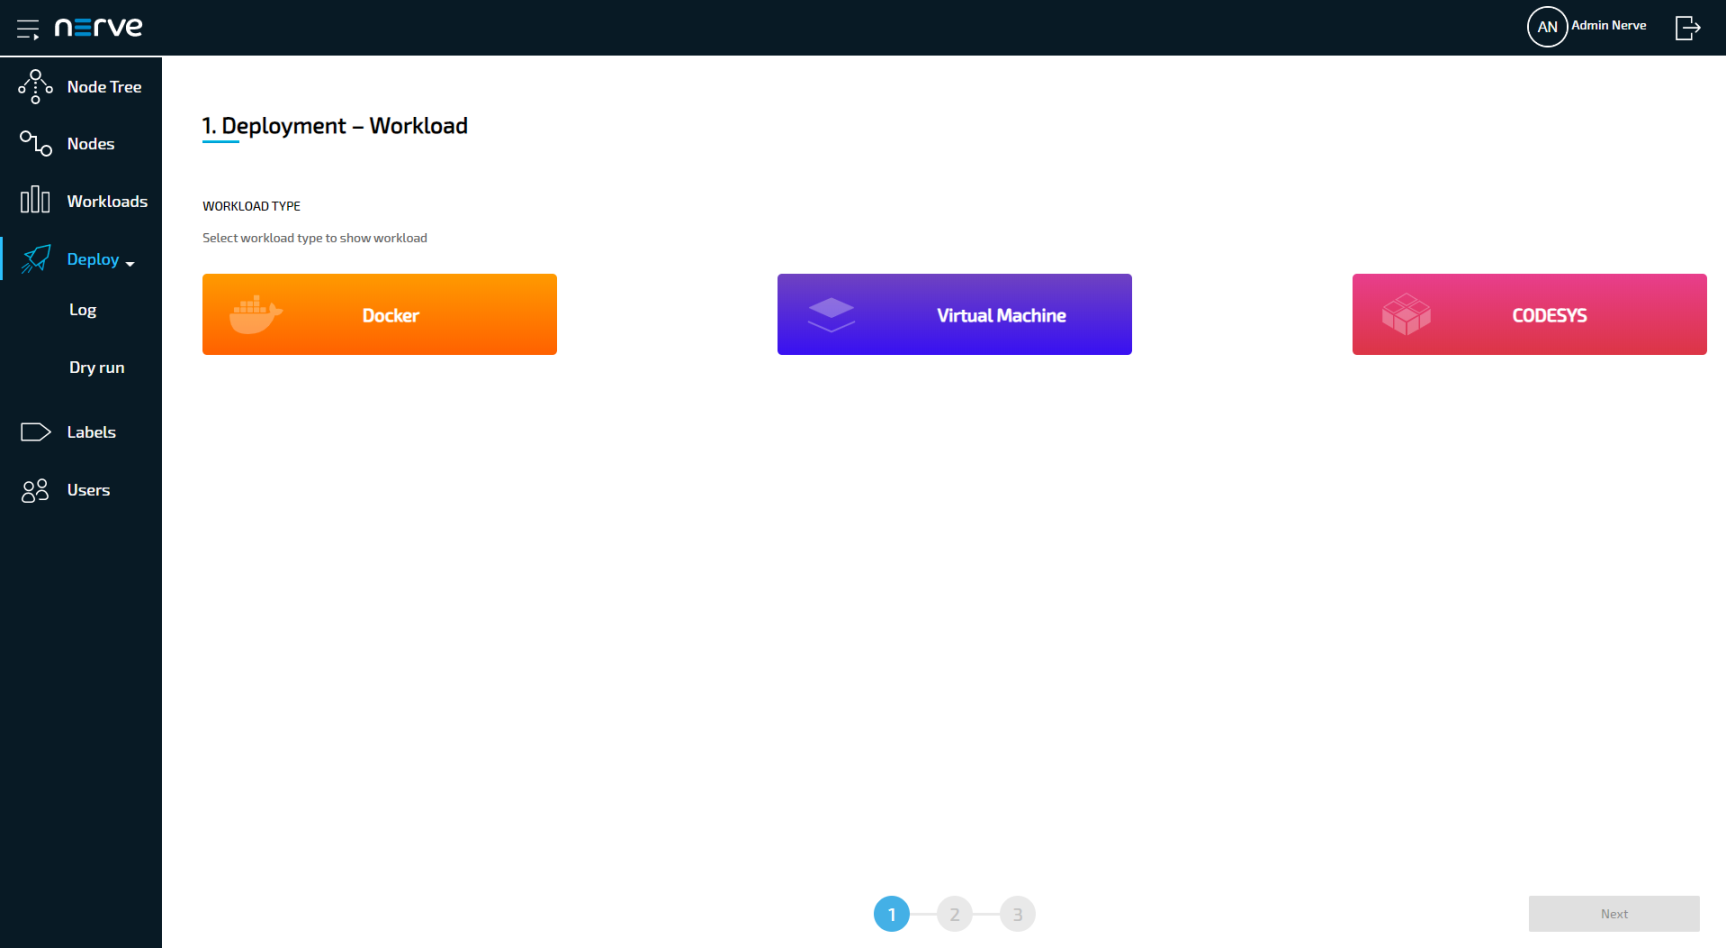
Deployment is the process of downloading workloads to Nerve Devices through the Nerve Management System. With Nerve Blue you can deploy and manage Docker containers, virtual machines and CODESYS applications. The instructions below show how to deploy the machine simulation as a CODESYS workload and Node-RED as a Docker workload.
Machine simulation
- Log in to the Management System.
-
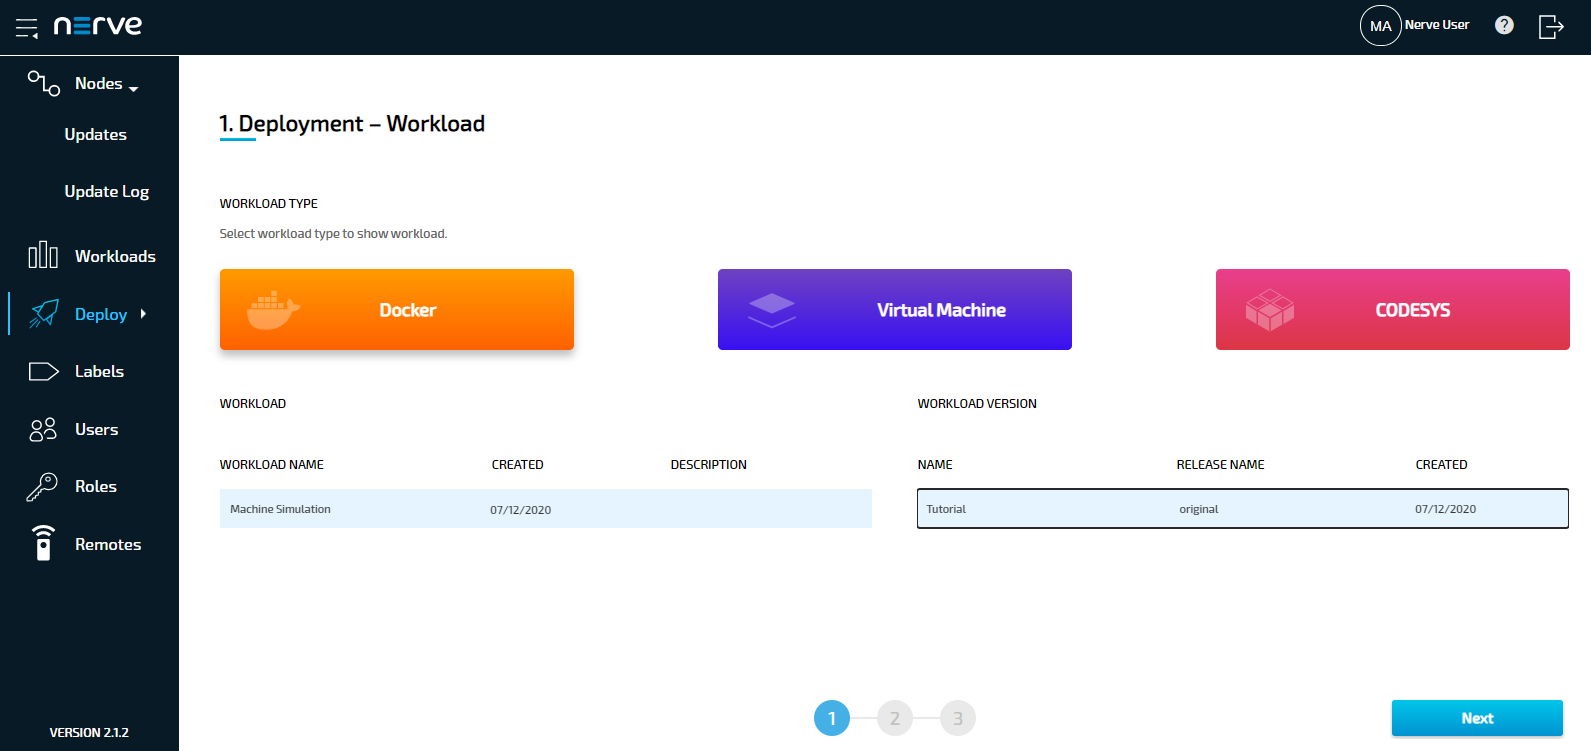
Select Deploy in the navigation on the left.
-
Select the red CODESYS tab. A list of CODESYS workloads will appear below.
-
Select Machine Simulation in the list of workloads. A list of version of this workload will appear to the right.
-
Select the latest version of the workload on the right.
- Click Next in the lower-right corner.
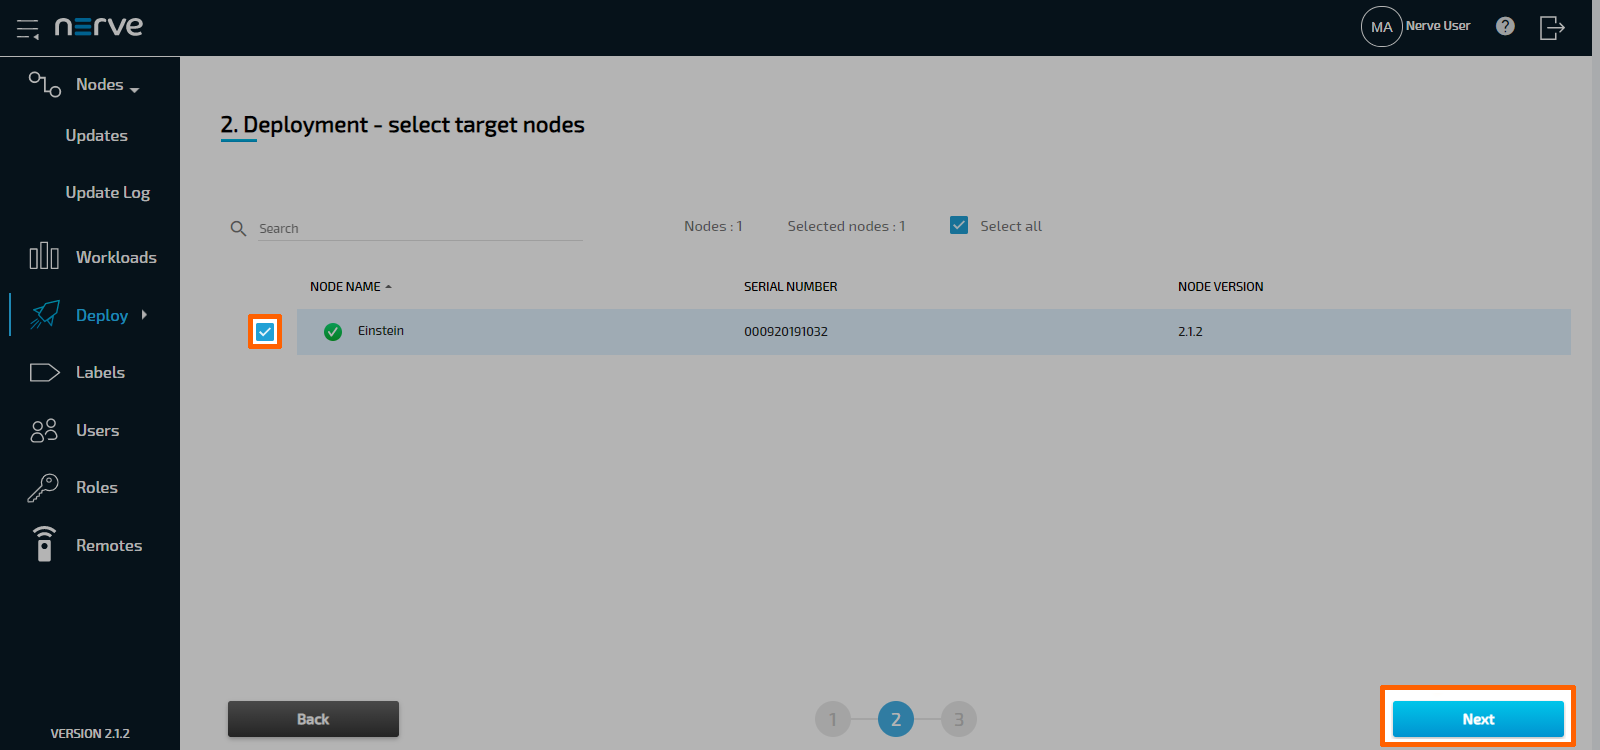
- Tick the checkbox next to your node.
-
Select Next in the lower-right corner.
-
Select Deploy to execute the deployment.
Optional: Enter a Deploy name above the Summary of the workload to make this deployment easy to identify. A timestamp is filled in automatically.
The deployment should now be visible at the top of the deployment log. Click the log entry of the deployment to see a more detailed view.
Node-RED
-
Select Deploy in the navigation on the left.
-
Select the orange Docker tab. A list of Docker workloads will appear below.
- Select Node-RED in the list of workloads. A list of version of this workload will appear to the right.
-
Select the latest version of the workload.

-
Select Next in the lower-right corner.
- Tick the checkbox next to your node.
-
Select Next in the lower-right corner.
-
Select Deploy to execute the deployment.
Optional: Enter a Deploy name above the Summary of the workload to make this deployment easy to identify. A timestamp is filled in automatically.
The deployment should now be visible at the top of the deployment log. Click the log entry of the deployment to see a more detailed view.
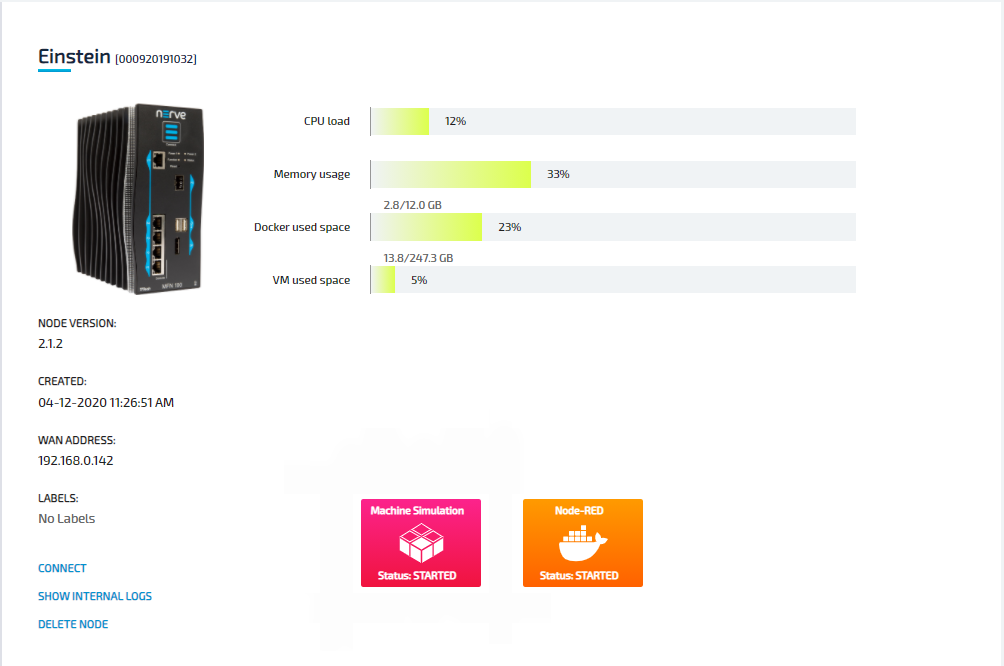
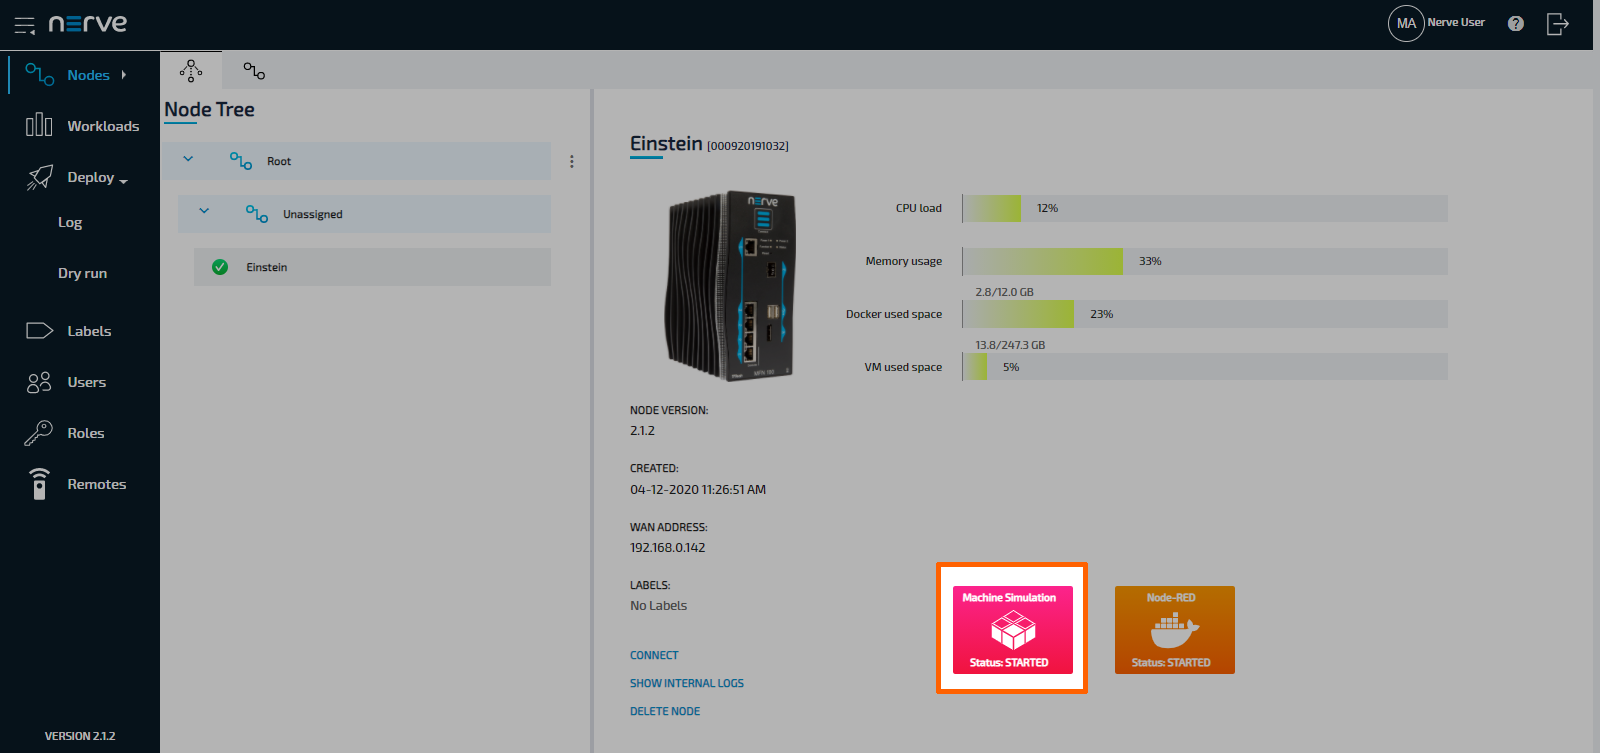
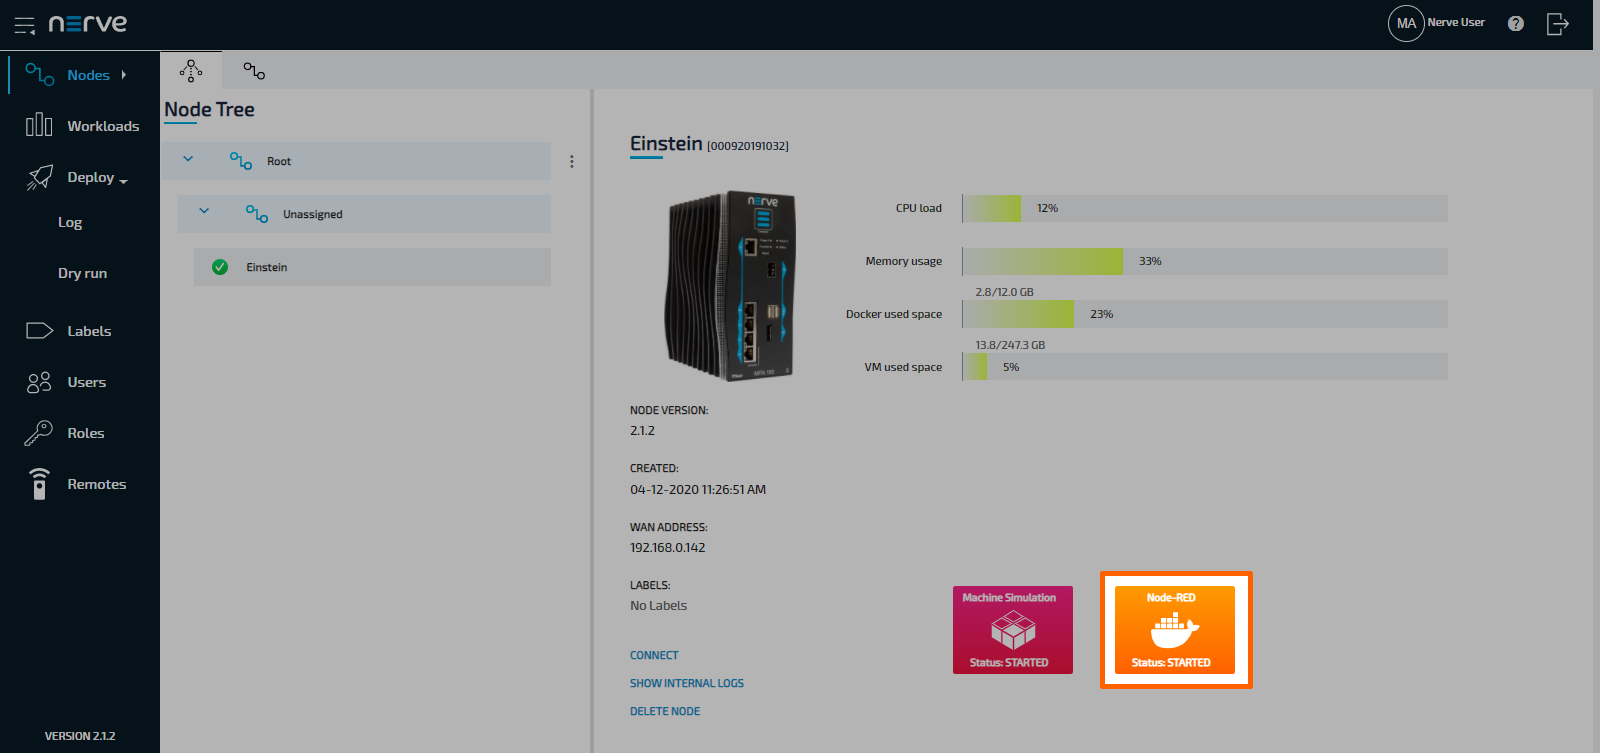
To confirm if the workloads have been deployed successfully, select Nodes in the navigation on the left. Select your node in the node tree and confirm if two workload tiles are showing underneath the bar graph. The workloads should show the status STARTED.
Note
It can take a number of seconds until the status of workloads switches from IDLE to STARTED after deployment.
Step 2: Connecting to the workloads through remote access
To access the deployed workloads, it is required to create a connection between the computer used for this tutorial and the Management System, and from the Management System to the webservers of the workloads on the Nerve Device. This is done through the remote access feature, specifically through the use of remote tunnels. The remote tunnel connection has already been configured in the Management System and is ready for use. The image below illustrates the remote access feature, showing a connection to the deployed Node-RED workload on the Nerve Device.
Before continuing, install the Nerve Connection Manager that was part of the delivery, as it is required for using remote tunnels.
Note
Local admin rights might be required to successfully install the Nerve Connection Manager.
Connecting to the machine simulation
The machine simulation is accessible at port 8080 on the Nerve Device through a web user interface. The preconfigured remote tunnel will use this port and port 8080 on the local computer to create a connection between the computer and the Nerve Device to access the machine simulation.
- Select Nodes in the navigation on the left.
- Select your node in the node tree.
-
Select the Machine Simulation CODESYS workload.
-
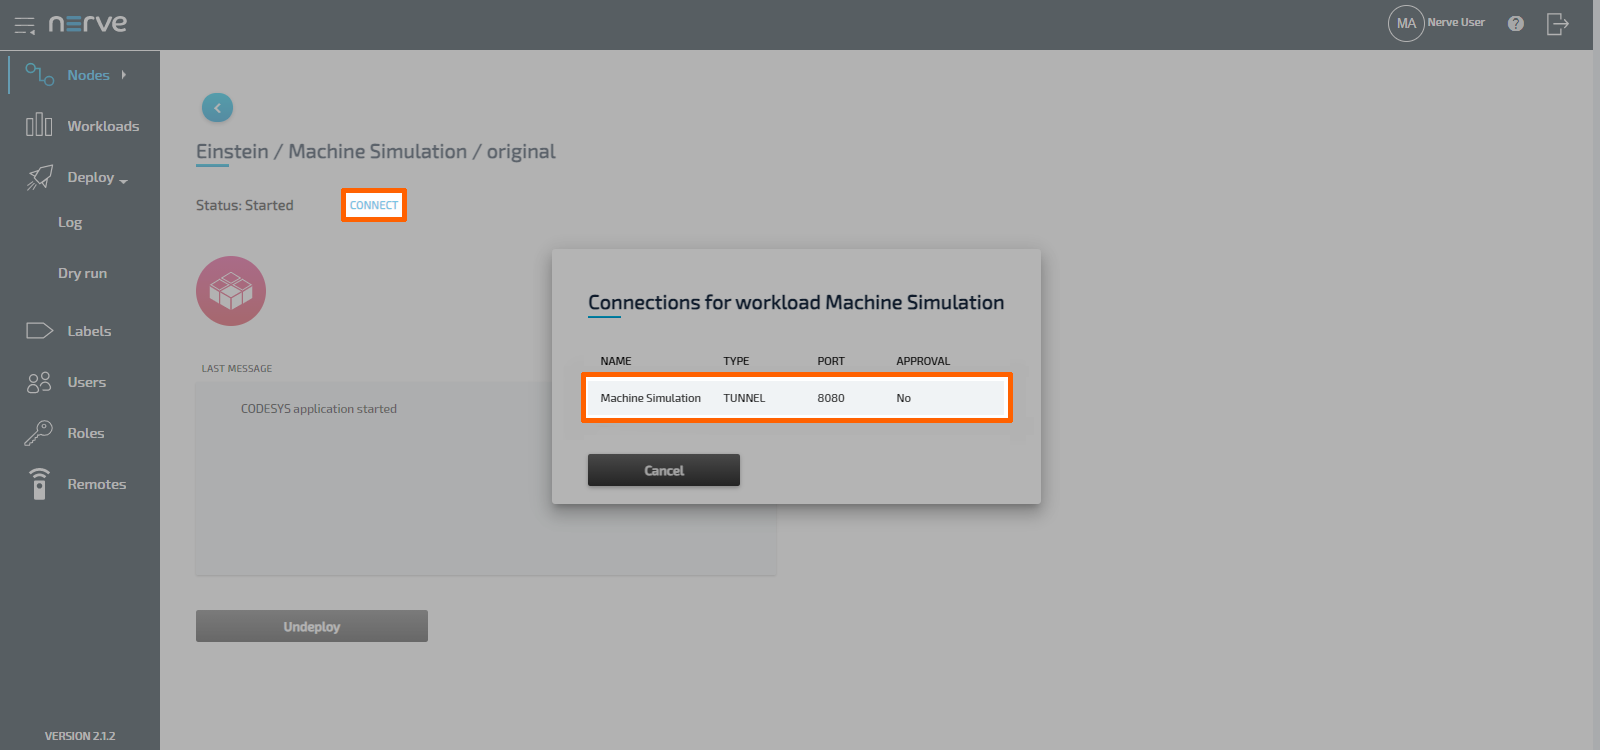
Select CONNECT next to the workload status. Available connections will appear in a window.
-
Select the Machine Simulation remote tunnel from the list.
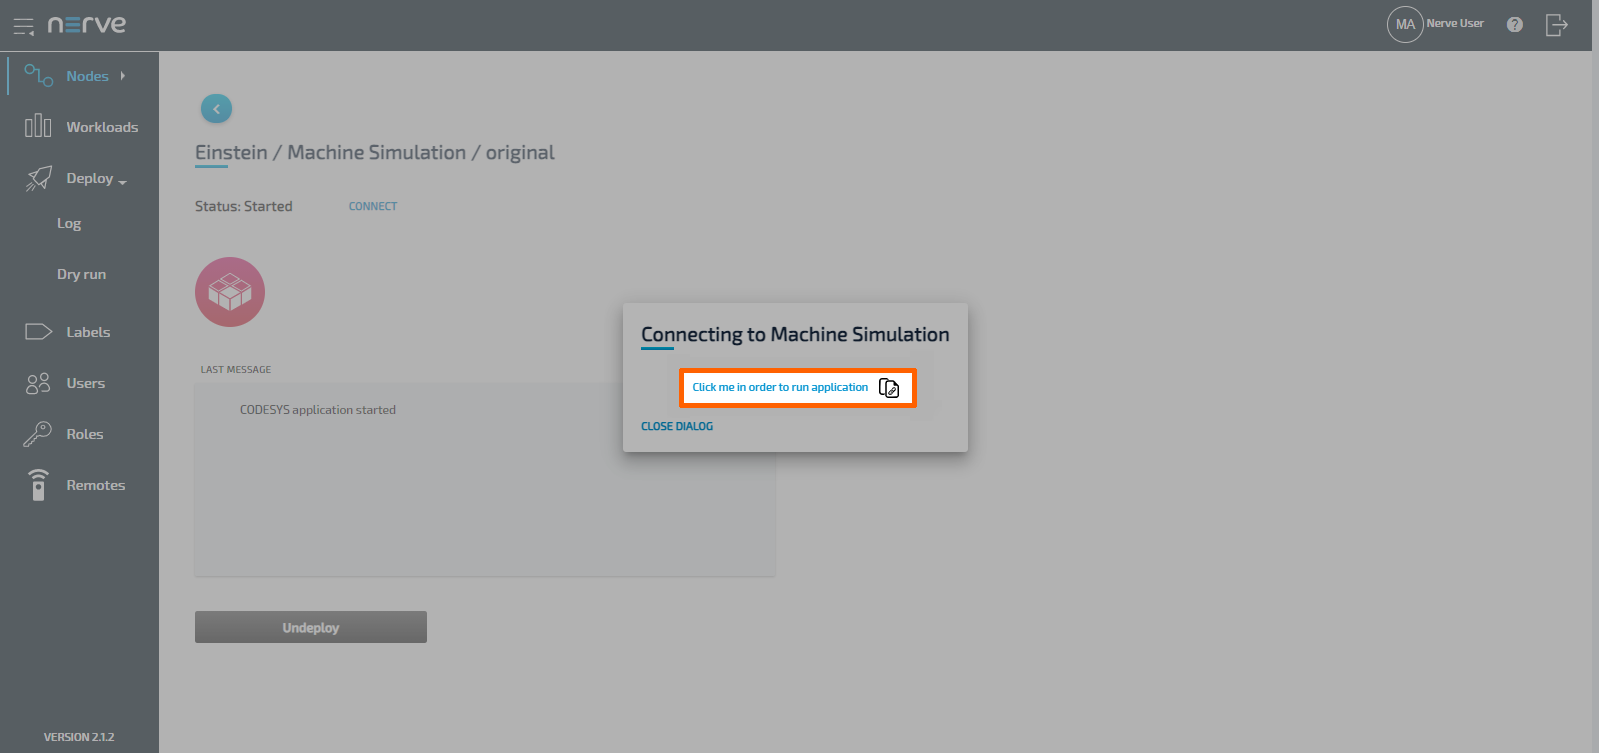
-
Select Click me in order to run application in the new window.
-
If the Nerve Connection Manager installed correctly, confirm the browser message that the Nerve Connection Manager shall be opened.
Depending on the browser that is used, this message will differ. The Nerve Connection Manager will start automatically once the message is confirmed.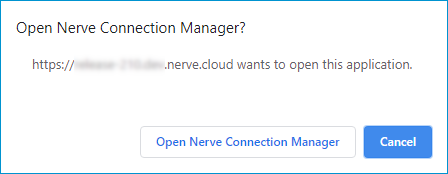
Note
If the Nerve Connection Manager does not start automatically, refer to Using a remote tunnel to a node or external device in the user guide.
The remote tunnel will be established once the Nerve Connection Manager starts and the remote connection will turn green in the Nerve Connection Manager. The remote tunnel is now ready to be used.
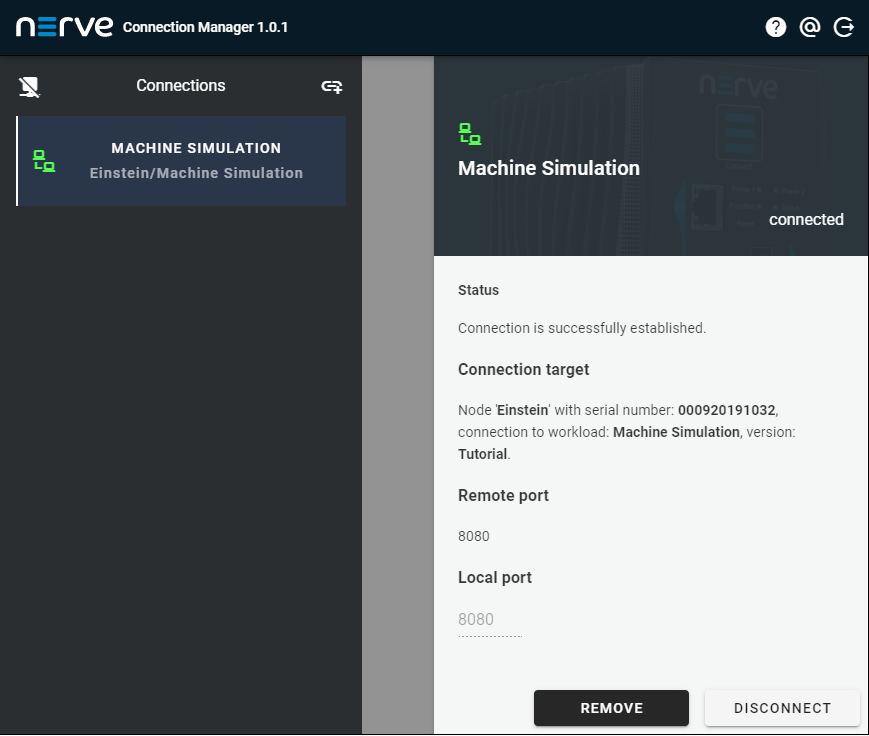
Open a new browser tab and enter localhost:8080 to open the machine simulation dashboard.
Connecting to Node-RED
Node-RED is accessible at port 1880 on the Nerve Device through a web user interface. The preconfigured remote tunnel will use this port and port 1880 on the local computer to create a connection between the computer and the Nerve Device to access the interface of Node-RED.
- Select Nodes in the navigation on the left.
- Select your node in the node tree.
-
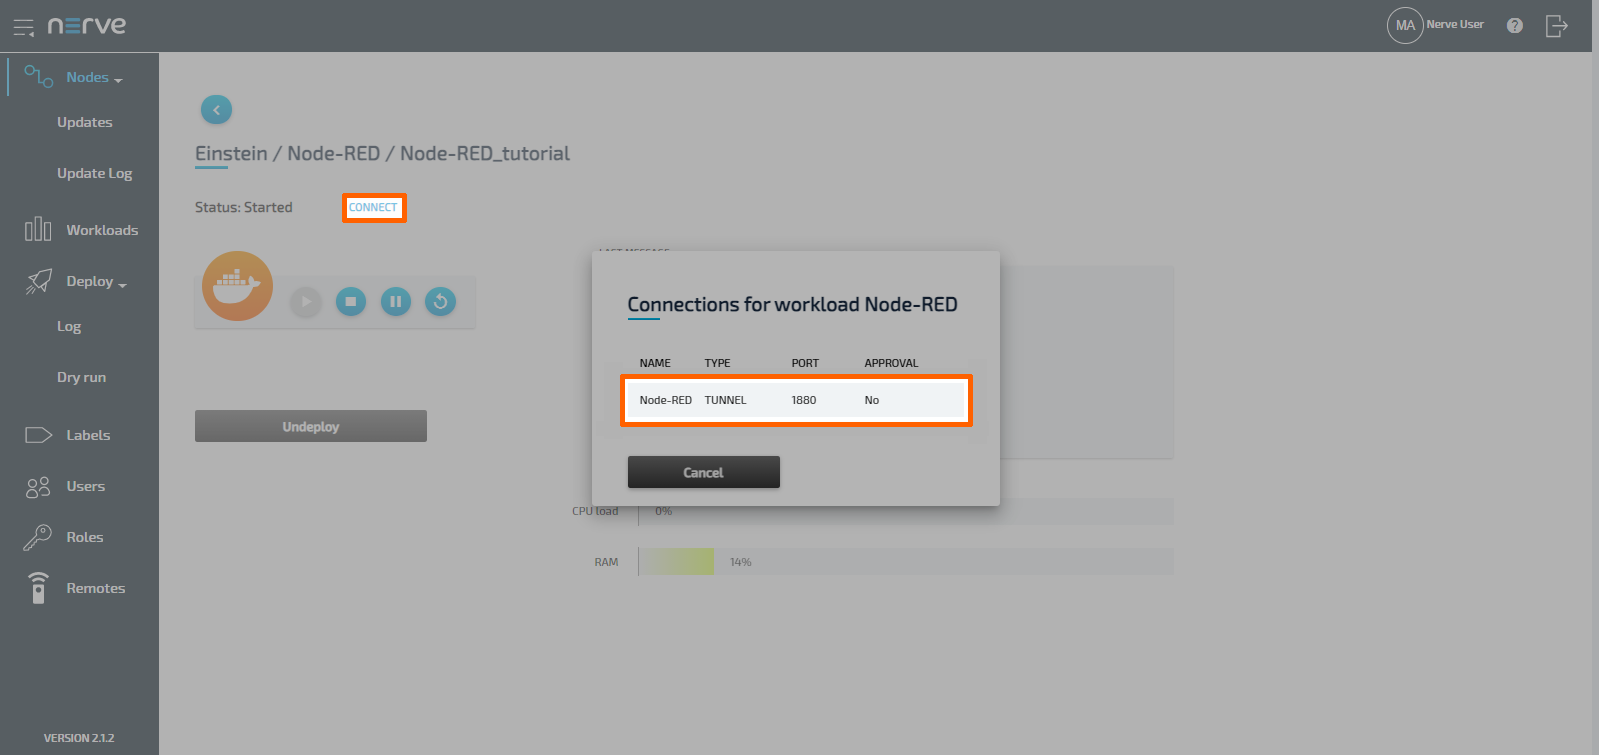
Select the Node-RED Docker workload.
-
Select CONNECT next to the workload status. Available connections will appear in a window.
-
Select the Node-RED remote tunnel from the list.
-
Select Click me in order to run application in the new window.
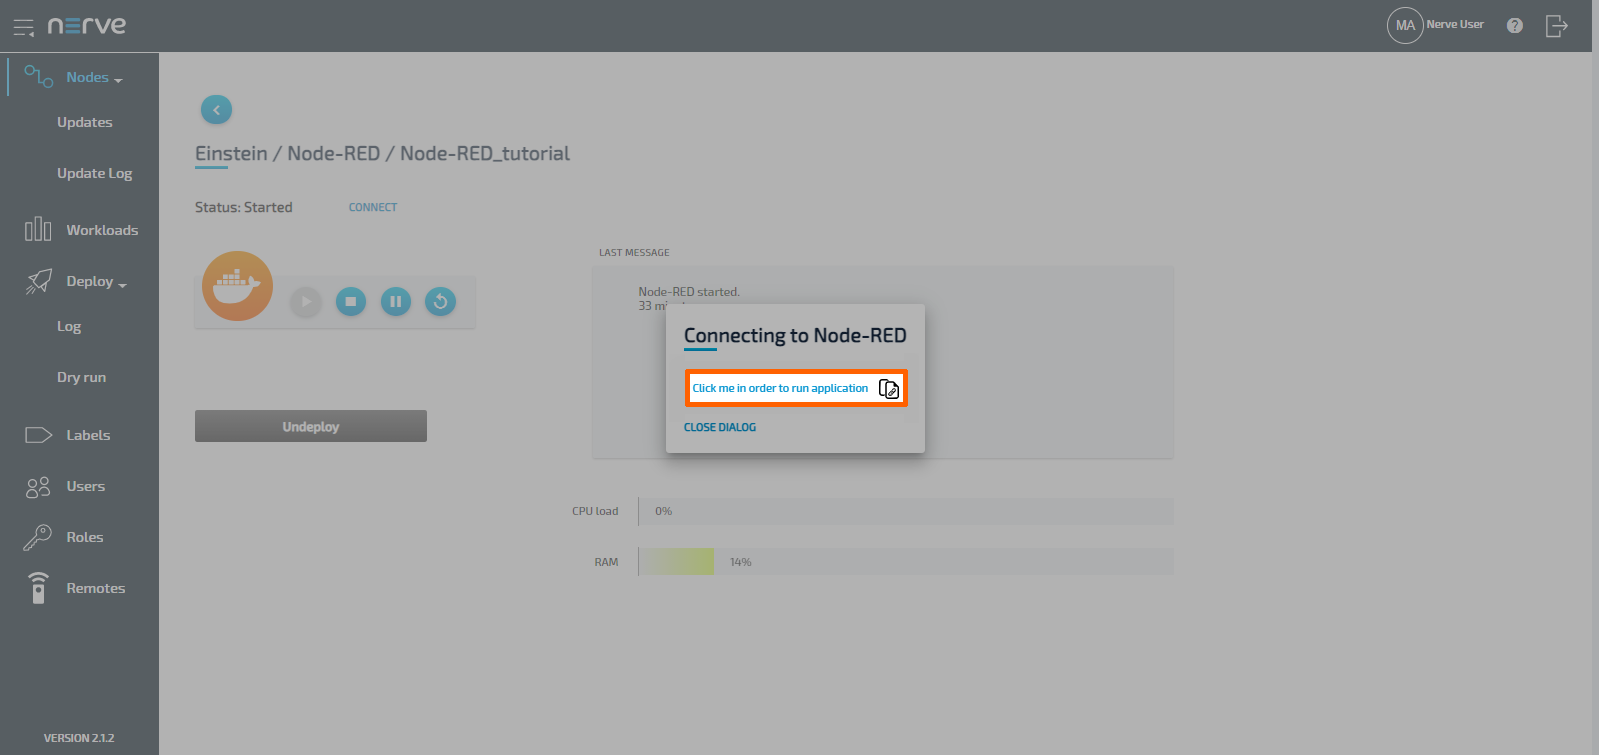
-
If the Nerve Connection Manager installed correctly, confirm the browser message that the Nerve Connection Manager shall be opened.
Depending on the browser that is used, this message will differ. The Nerve Connection Manager will start automatically once the message is confirmed.Note
If the Nerve Connection Manager does not start automatically, refer to Using a remote tunnel to a workload in the user guide.
The remote tunnel will be established once the Nerve Connection Manager starts and the remote connection will turn green in the Nerve Connection Manager. The remote tunnel is now ready to be used.
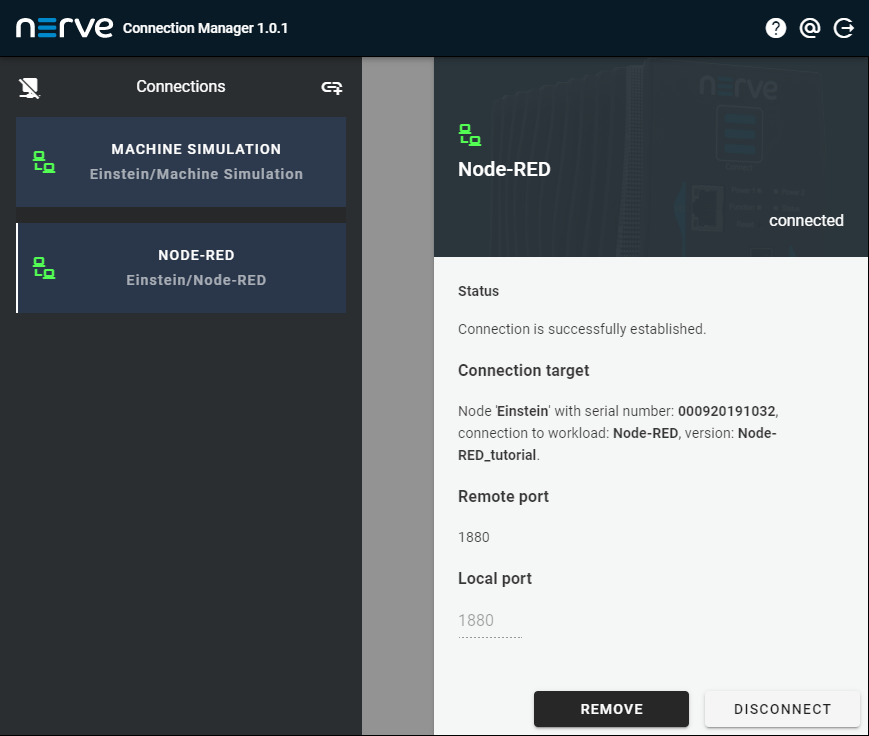
Open a new browser tab and enter localhost:1880 to open Node-RED.
Step 3: Setting up Node-RED
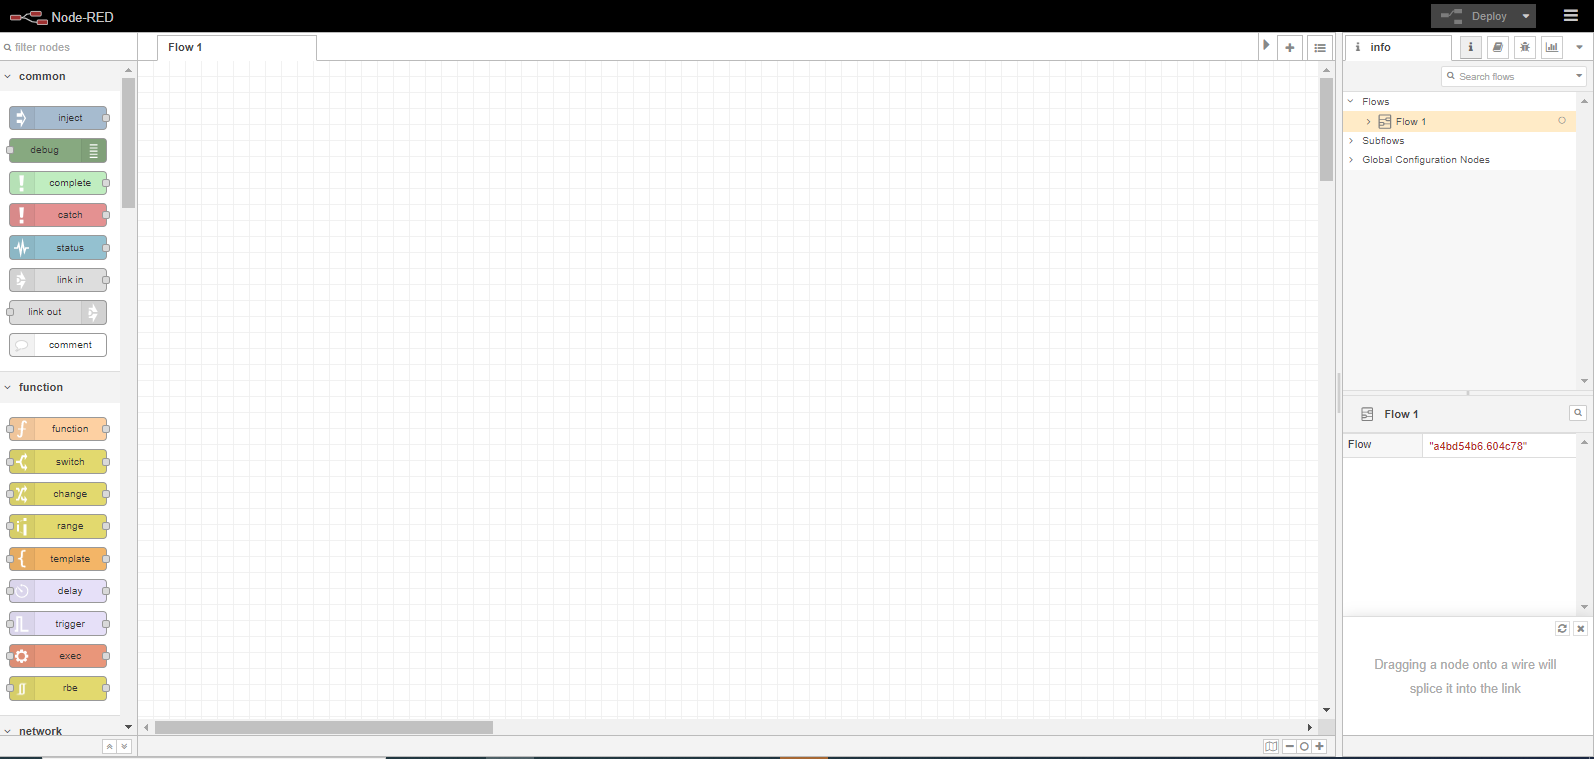
Node-RED is running on the node and the workstation is connected to it through a remote tunnel. Switch to the browser tab that has Node-RED opened at localhost:1880. The flow is imported in the instructions below.
Note
Download the JSON file that has been part of the delivery and remember its download location.
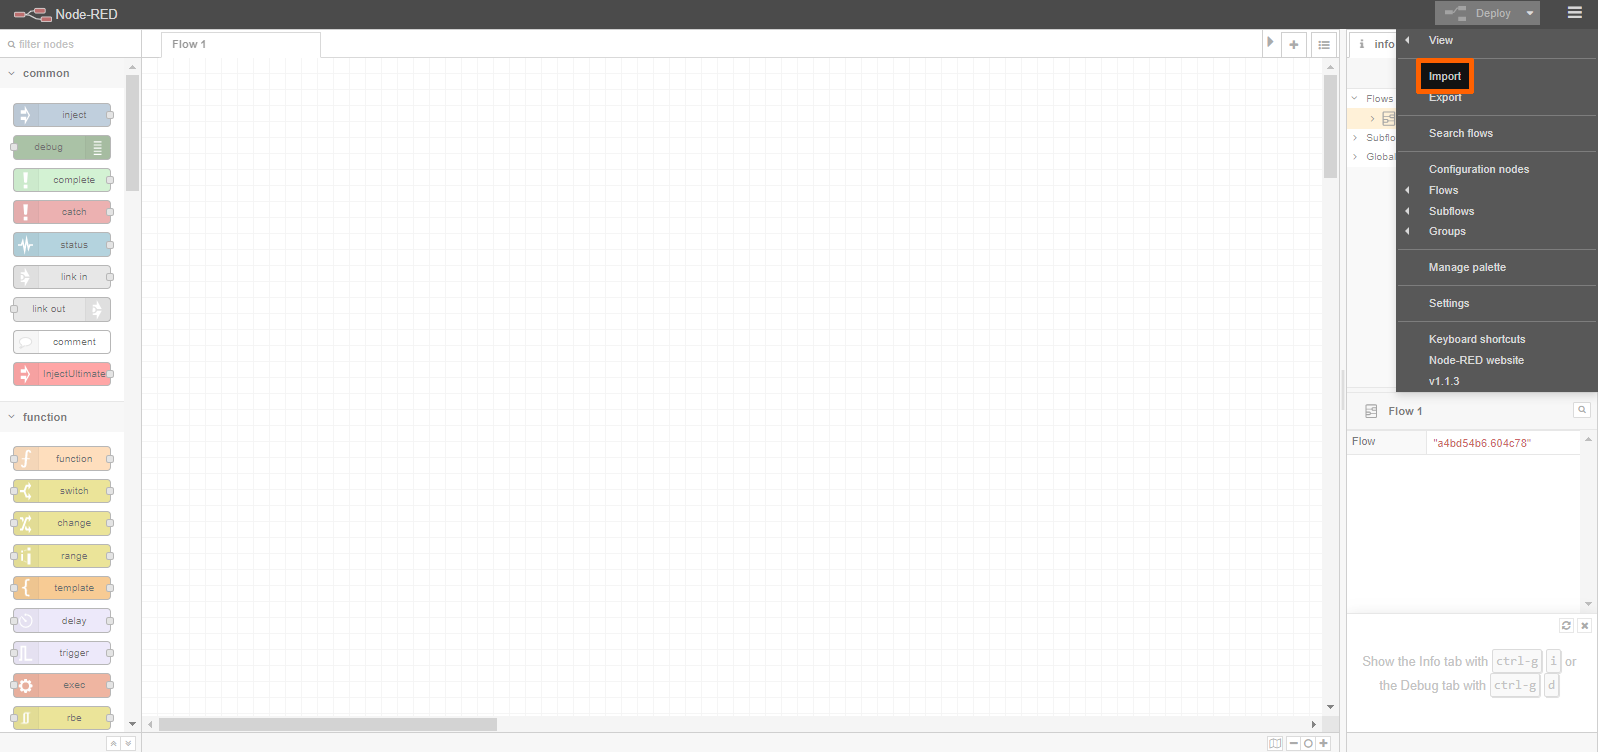
- Select the burger menu in the top-right corner.
-
Select Import.
-
Select select a file to import.
- Look for the JSON file that has been downloaded before.
- Select Open.
- Select Import in the lower-right corner.
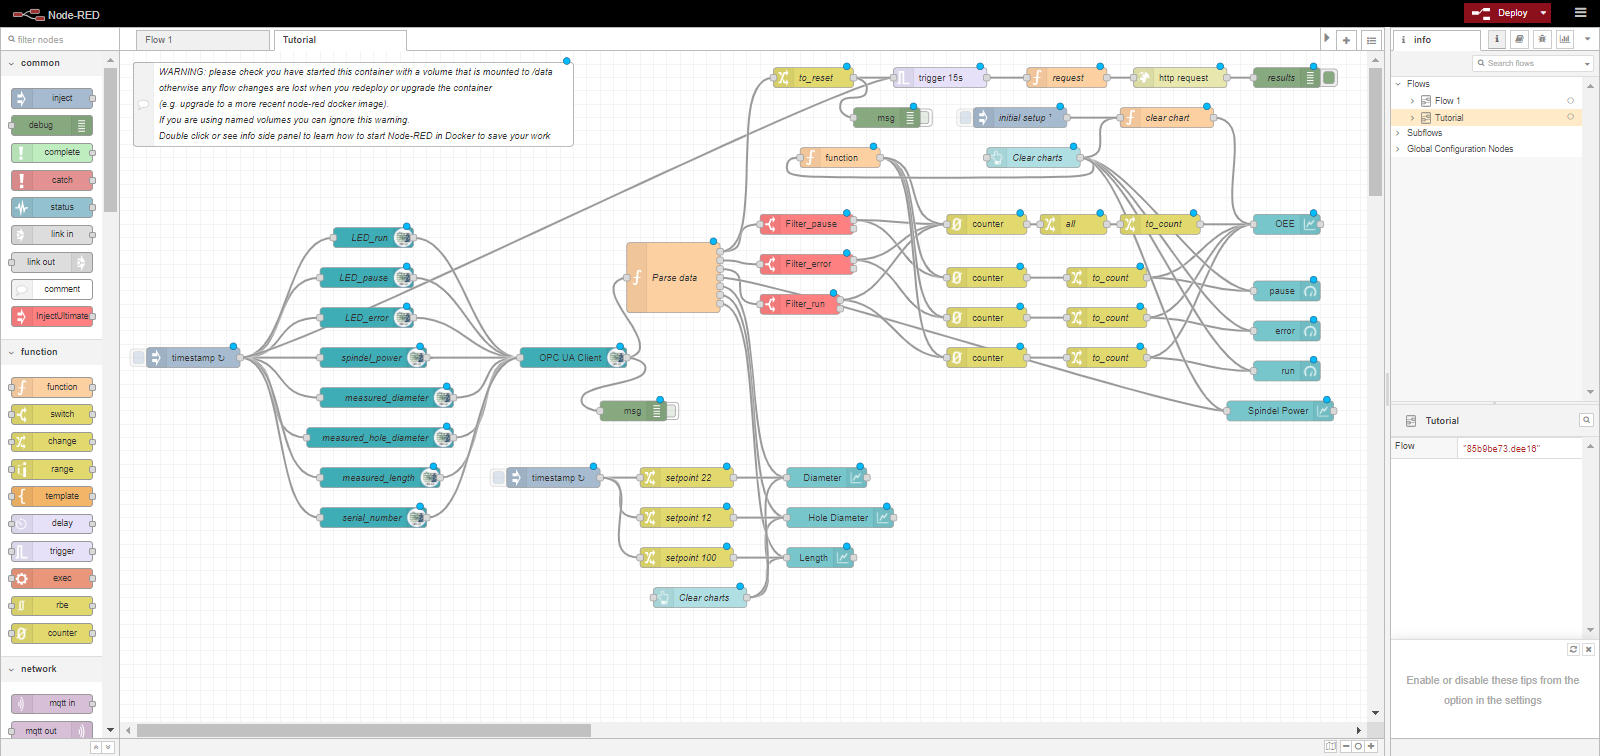
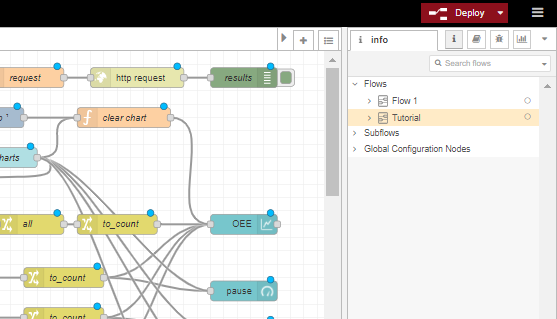
The flow will appear in a new tab inside of Node-RED labelled Tutorial in the top-left corner.
Step 4: Accessing the OEE and quality dashboard
After the Node-RED setup, data generated by the machine simulation can be viewed on the OEE and quality dashboard.
-
In the Node-RED browser tab select Deploy in the top-right corner to start the flow. Make sure that the Tutorial tab is active.
-
Open a new browser tab.
-
Enter
localhost:1880/uito open the OEE dashboard.Note
It may take a moment for the dashboard to load.
Experimenting with the machine simulation
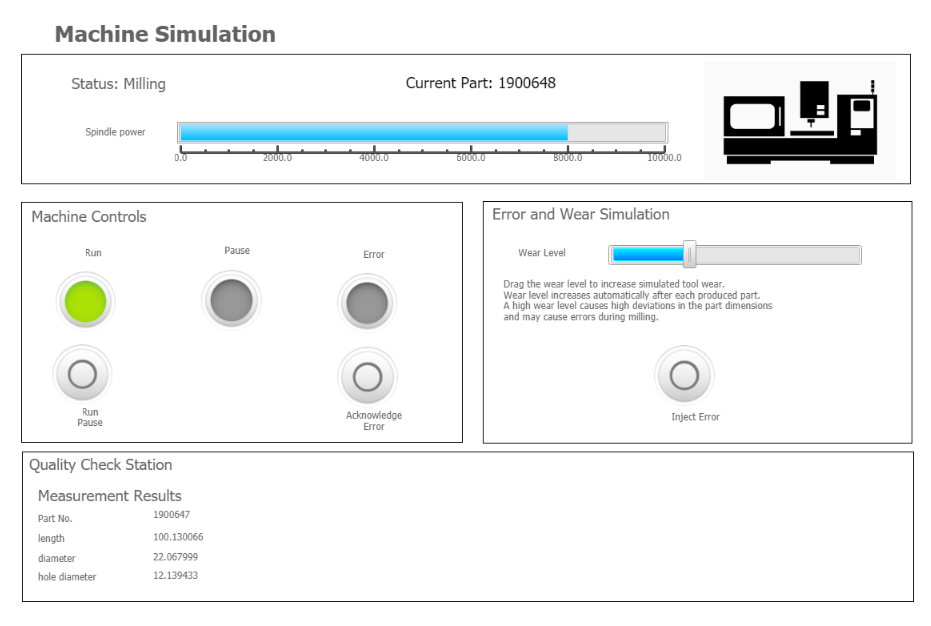
The machine simulation runs through a process of part production. The production of a part begins with the machine waiting for a part in order to load it. Once the part is loaded in, the machine starts milling and the spindle power goes up. After the machine is finished milling and the spindle power goes down again, the part is then unloaded and sent to a measuring station. The Measurement Results in the Quality Check Station are updated as soon as measuring is completed. The operation of the machine simulation and the measurements of the parts are impacted by the adjustable Wear Level.
The user interface of the machine simulation is split up into different parts.
| Item | Description |
|---|---|
| Status | This shows the current status of the machine simulation, the number of the current part and the spindle power when the machine is milling. The status of the machine cycles through the following way in regular operation:
|
| Machine Controls | The machine controls consist of three colored lights and two buttons.
|
| Error and Wear Simulation | The slider here emulates the wear of the system. It increases gradually when the machine is running. The higher the wear level, the higher the probability of an error occuring in the simulation. The slider can be adjusted to preference to simulate different levels of wear. Manually inject an error by pressing the Inject Error button. |
| Quality Check Station | After the completion of a part, the Measurement Results are updated, showing new values for the Part No., length, diameter and hole diameter of a part. The higher the wear level, the higher are the deviations of the part measurements. |
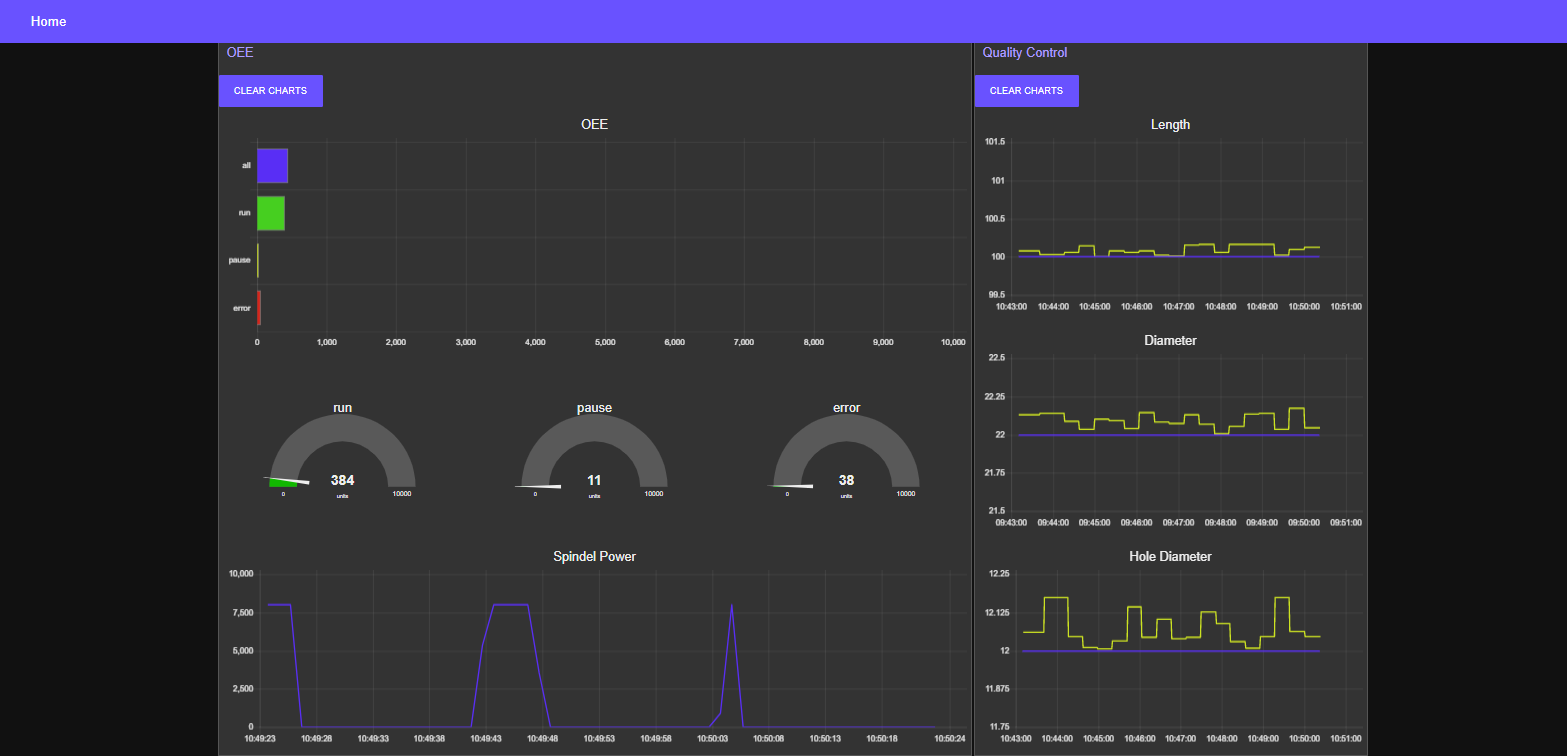
The data of the machine operation is amassed and displayed in an OEE dashboard by Node-RED.
Node-RED and the OEE dashboard
The data flow in Node-RED reads from an OPC UA Client and parses the data into the OEE statistics and quality check data. The dashboard consists of three parts:
- OEE
This part of the dashboard shows the amount of the time the machine has spent in run, pause and error states in two different visualizations. - Spindle Power
This is a graph of how high spindle power is over time. - Quality Control
Length, Diameter and Hole Diameter are displayed in graphs, showing the measurements of the parts produced. Deviations caused by a high wear level can be analyzed here.
This concludes the tutorial for Nerve. For questions, requests and further evaluation, contact trynerve@tttech-industrial.com.