Nerve Data Services
The Nerve Data Services are a collection of services and interfaces that allow to collect, store, analyze, visualize and distribute data. These services and interfaces are available on the Nerve Blue node and in the Management System. Using Nerve Data Services, data can be collected at high speeds on the node and stored or visualized locally at the Node or centrally in the Management System.
Elements of Nerve Data Services
| Nerve Data Services | Description and elements |
|---|---|
| Local Data Services | The Local Data Services are accessible on the node. They include the following elements:
|
| Central Data Services | The Central Data Services are part of the Management System. They include the following elements:
|
| User PC | Data SDK With the Data SDK users can create analytics applications, which can be deployed to a node. |
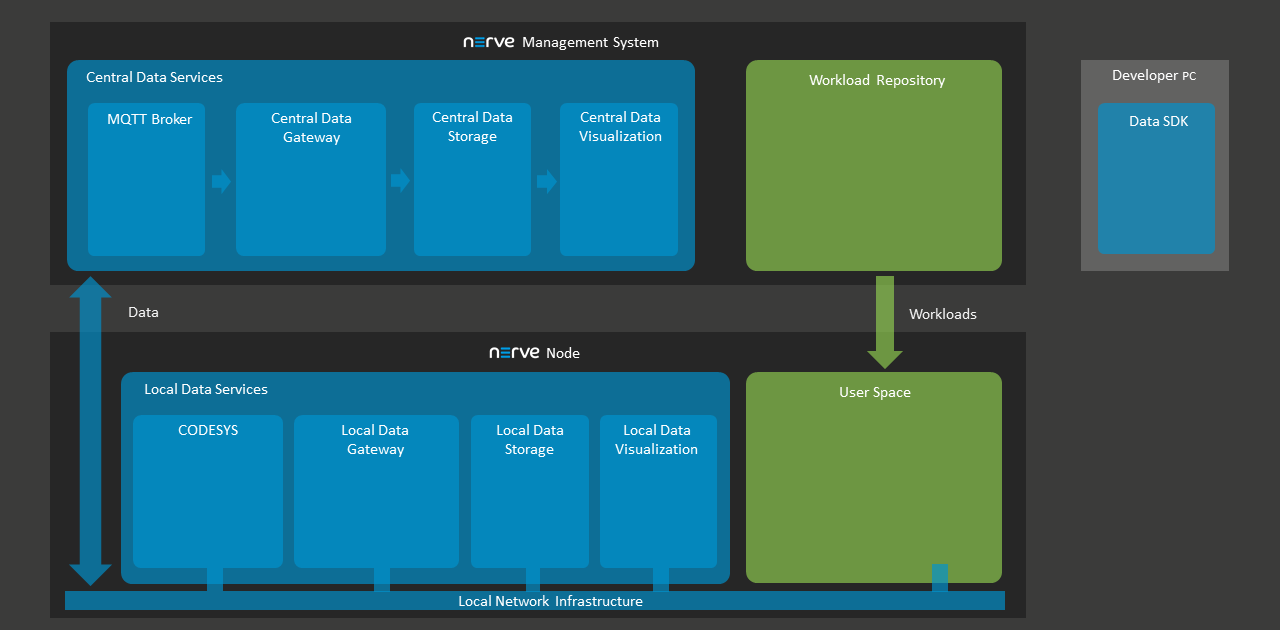
All of the above elements are individually configurable. This allows for an application in a large number of scenarios and use cases. However, this also implies deeper knowledge of the elements and their possible interactions. Further explanations of the elements can be found in separate chapters. Find a high-level graphical overview below.
Supported protocols
| Inputs | Outputs |
|---|---|
| MQTT subscriber | MQTT publisher |
| OPC UA PubSub over MQTT | OPC UA PubSub over MQTT |
| OPC UA PubSub over UDP | OPC UA PubSub over UDP |
| OPC UA Client | OPC UA server |
| Modbus server | ZeroMQ publisher |
| S7 server | TimescaleDB |
| Influx DB |
Model workflow
The following section gives an overview of a typical work flow, presenting what can be done with the Nerve Data Services on a high level:
- Setting up data sources
- Configuring the local Gateway on the node to collect data and defining where to distribute it
- Configuring Grafana on the node for local data visualization
- Configuring the central Gateway in the Management System to collect data from different nodes
- Configuring Grafana in the Management System for central data visualization
- Configuring Grafana to visualize data
- Implementing an analytics app and configuring the local Gateway again to send data to the analytics app
- Reconfiguring Grafana to visualize the result of the processing performed by the analytics app
The paragraphs below give short explanations to each step.
Ingesting data on the node
CODESYS can be used to translate fieldbus protocols to OPC UA Server. The local Gateway can then be configured to collect data from CODESYS and distribute it to various destinations. Data sources that support protocols which are also native to the local Gateway can be linked there directly and do not need CODESYS.
Distributing data on the node
Data is distributed by the local Gateway to user defined consumers. Unless the respective protocol of a Gateway output defines a specific data format, all data received by the Gateway is normalized to the Nerve Data Services data format. Typical consumers of data are the local data storage on the node or the central data storage in the Management System, third party MQTT brokers, applications or providing the data as OPC UA Server. To enable reuse of local Gateway configurations across multiple nodes, keywords can be used to abstract node specific information from the configuration.
Storage on the node
Data is stored on the node in a TimescaleDB database. Any application running on the node can access data stored in there. For application development, a Python API is provided in the Data SDK that simplifies reading and writing data. A time window can be configured for how long data shall be kept before deleting it.
Visualization on the node
Visualization is available via Grafana which is pre-configured to allow access to data stored in the local data storage. It is also possible to configure access from Grafana to other user defined data sources without any restrictions, meaning that data in an influxDB that is installed on the node can also be visualized.
Using Data in analytics
A Python SDK is available for creating custom analytics applications. An API is available that simplifies reading data from the local storage or receiving it directly from the Gateway when it arrives there. The API also allows to write back analytics results to the local storage for visualization or send it to an MQTT broker to distribute it to other consumers. It is also possible to use third party applications such as NodeRed or Crosser for analytics together with the Nerve Data Services.
Storing and visualizing in the Management System
Storage and visualization in the Management System has a similar structure technologically speaking but offer limited configuration possibilities as the network is static and there are no option to include workloads in the Management System.
Data received on the Node can be forwarded to the Management for visualization. To allow this, the local Gateway and the central Gateway as well as the central visualization must be configured. Keywords are in place to simplify the configuration process. Each node has a separate database in the Central Data Storage.
Nerve Data Services data format
Inputs and Outputs at the local and central Gateway using a protocol that does not define a data format (i.e. MQTT) send or receive data in JSON format. The same applies to the Python API in the Analytics Data SDK. As a result, data within the Nerve Data Services is normalized to this format.
The JSON schema below describes the data format in more detail. The JSON schema is also used to validate data upon reception. If a data frame is received that does not comply with the schema, it is silently dropped by the Nerve Data Services.
{
    "$schema": "http://json-schema.org/draft/2019-09/schema#",
    "$id": "https://nerve.cloud/dp/dp_data_model.schema.json",
    "title": "Nerve Data Services JSON data model schema",
    "description": "Schema that represents default data model that Nerve Data Services use.",
    "type": "object",
    "properties": {
        "variables": {
            "type": "object",
            "additionalProperties": {
                "anyOf": [
                    {
                        "type": [ "boolean", "number", "string" ]
                    },
                    {
                        "type": "array",
                        "items": {
                            "type": "boolean"
                        }
                    },
                    {
                        "type": "array",
                        "items": {
                            "type": "number"
                        }
                    },
                    {
                        "type": "array",
                        "items": {
                            "type": "string"
                        }
                    }
                ]
            }
        },
        "timestamp": {
            "type": [ "number", "string", "array" ],
            "items": {
                "type": [ "number", "string" ]
            }
        }
    },
    "required": [ "variables" ],
    "additionalProperties": false
}
The schema defines and allows only two properties in the root object: timestamp and variables. Timestamp is optional, and can be a single value or an array of values. Variables is an object containing arbitrary number of properties, which can be single values or arrays of values.
Custom JSON format
In order to be able to fetch values from all kinds of JSON messages, the Nerve Data Services Gateway now supports custom JSON data formats. The value of a field from a JSON message can be fetched using a so-called JSON path. A JSON path is comparable to a file path in a Unix-like file system. As an example, if a file is located in the following file structure:
- Documents
- Personal
- journal.txt
- Personal
its file path would be: /Documents/Personal/journal.txt. Based on this analogy, a JSON field from the following JSON:
{
    "Values": {
        "Temperature": 20
    }
}
would have the following JSON path: .Values.Temperature. Arrays are represented with square brackets:
{
    "Values": {
        "Temperature": [ 20, 30, 40 ]
    }
}
The third value of the Temperature field would be represented the following way: .Values.Temperature[2]
Gateway configuration file syntax for custom JSON formats
Note
Custom JSON formats are currently supported in MQTT subscriber input.
The fields name and path of the variables array objects inside of the connectors object are used to construct the JSON path. The full JSON path is always constructed by adding name to path:
"connectors": [
    {
        "variables": [
            {
                "name": "temperature",
                "path": ".measurement",
                "type": "int32"
            }
        ]
    }
]
The example above will construct the following JSON path: .measurement.temperature
- The variable name through the rest of the Gateway will always be just the value of the
namefield. (temperaturein the example above). - If
nameis omitted, the value ofpathwill become the name of the variable. - If
pathis omitted, the value ofpathwill be the default path.variables. This allows the Gateway to use the default Data Services data model JSON schema. - To define a path for timestamps, a special
timestampobject is used in the root of the input. The only field in thetimestampobject ispath, which is used to specify the path where to fetch timestamp values. - This object is optional, and if omitted, the Gateway will look for timestamps under the default JSON path,
.timestamp. This also allows the Gateway to use the default Data Services data model JSON schema.
Timestamp JSON path example
{
    "type": "MQTT_SUBSCRIBER",
    "timestamp": {
        "path": ".info.measurement_time[]"
    }
}
The variable expansion operator [*] cannot be used in a timestamp path, because it is not allowed to have multiple timestamps in on outgoing message from the Gateway. All additional requirements from the section above still apply.
Extended JSON paths
The Gateway extends the JSON paths explained above with two new operators for fetching values, in order to reduce the need to write JSON paths for recurring fields. The following data is used for both expansion examples below:
{
    "machineB": {
        "sensor1": [
            {
                "temperature": 10,
                "humidity": 51
            },
            {
                "temperature": 20,
                "humidity": 52
            },
            {
                "temperature": 30,
                "humidity": 53
            }
        ]
    }


}
Operator [] - List expansion
The list expansion is an operator used to fetch multiple values of the same variable. It allows processing large chunks of data in a simple way.
The data above, when received with following configuration:
"variables": [
    {
        "name": "temperature",
        "path": ".machineB.sensor1[]",
        "type": "int32"
    },
    {
        "name": "humidity",
        "path": ".machineB.sensor1[]",
        "type": "int32"
    }
]
generates 3 entries on any Gateway output.
| temperature | humidity |
|---|---|
| 10 | 51 |
| 20 | 52 |
| 30 | 53 |
Operator [*] - Variable expansion
The variable expansion is an operator used to fetch multiple values of a variable as separate variables. It allows processing large chunks of data in a compact way.
The data above, when received with following configuration:
"variables": [
    {
        "name": "temperature",
        "path": ".machineB.sensor1[*]",
        "type": "int32",
        "maxValues": 3
    },
    {
        "name": "humidity",
        "path": ".machineB.sensor1[*]",
        "type": "int32",
        "maxValues": 4
    }
]
generates all data in one entry. Note that in the configuration above, only the operator was changed from [] to [*].
| temperature‑0 | temperature‑1 | temperature‑2 | humidity‑0 | humidity‑1 | humidity‑2 | humidity‑3 |
|---|---|---|---|---|---|---|
| 10 | 20 | 30 | 51 | 52 | 53 | 0 |
An additional parameter is required when working with the variable expansion, maxValues. maxValues is required for outputs that need to know the exact number of data before actually receiving it (TimescaleDB, for example). If more values are received than specified in maxValues, the Gateway will simply ignore them. If less values than specified are received, the Gateway will write either the last known value at that position or a default value based on the variable type. In the example above, humidity-3 is set to 0 because of this.
Data Services UI
An instance of the data Gateway is present on both the node and on the cloud. However, the instances are configured separately. The supervisor UI is identical in both instances, in the Local UI on the node and in the Management System.
| Item | Description |
|---|---|
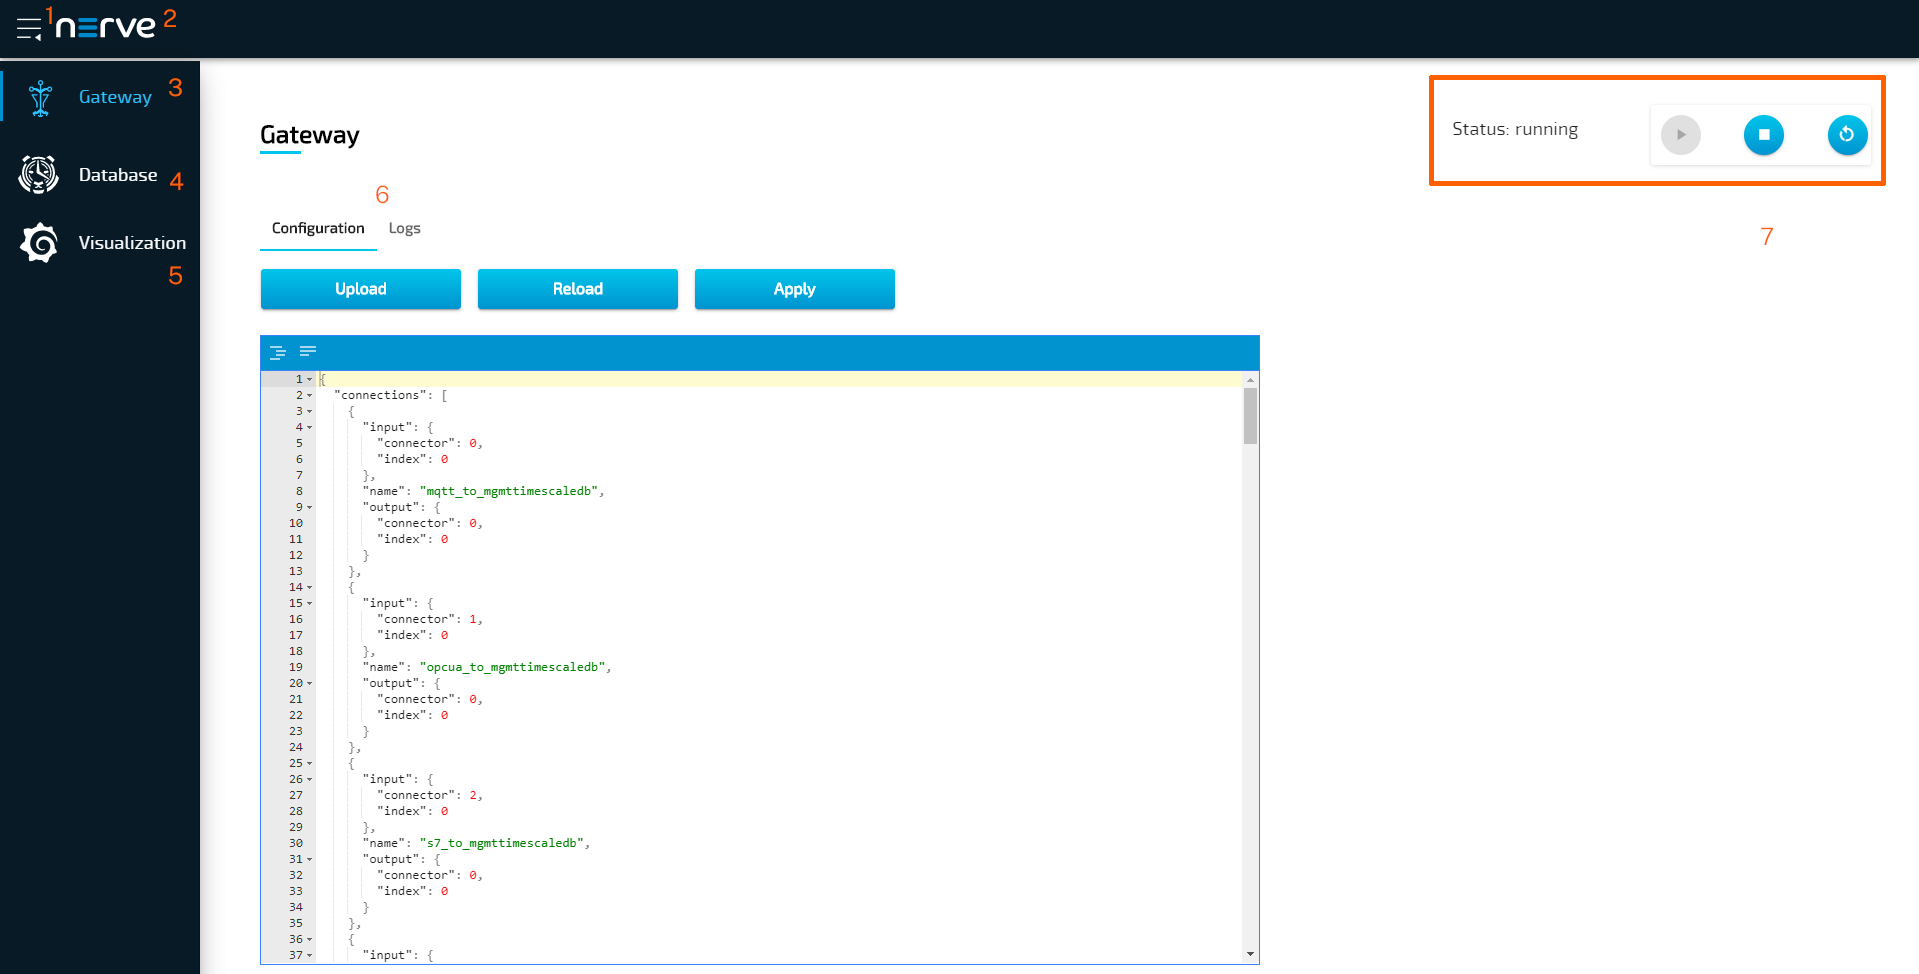
| Burger menu (1) | Click here to expand and collapse the navigation on the left. |
| Nerve logo (2) | Return to the landing page of the Local UI or the Management System by clicking here. |
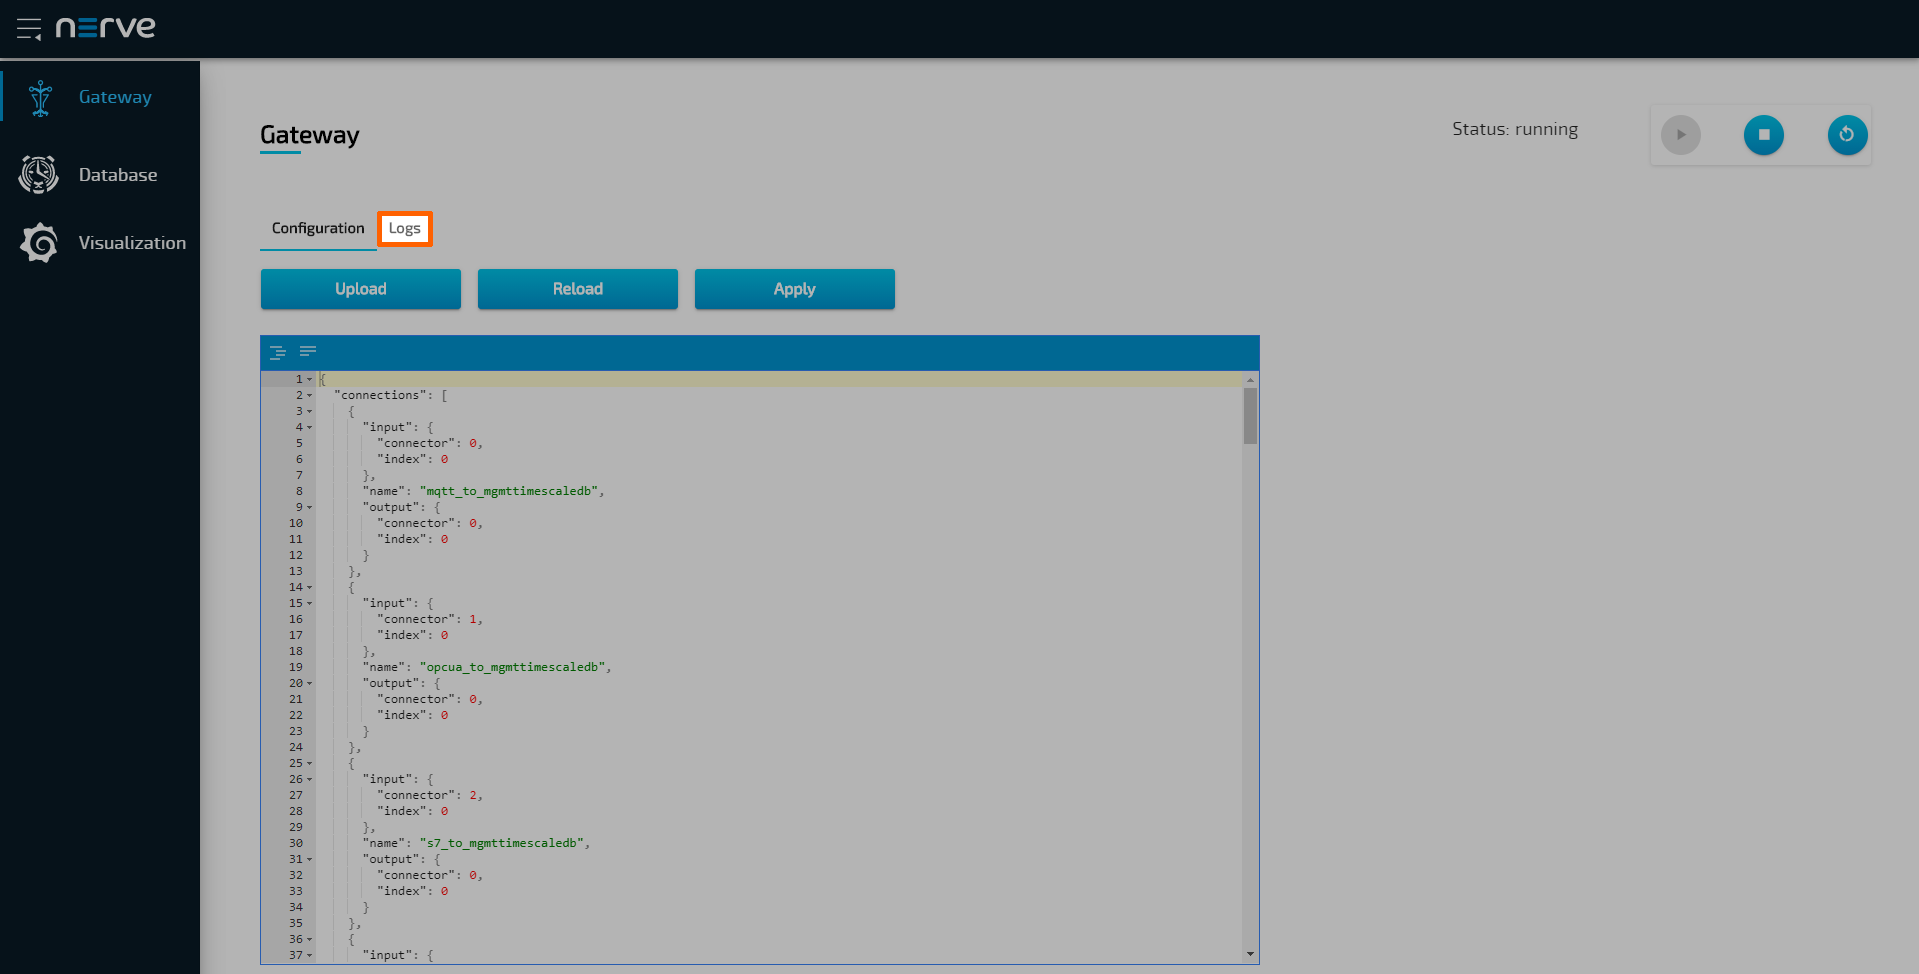
| Gateway (3) | This is the central application of the Data Services. The current configuration of the Gateway is loaded into the open JSON editor by default. A new configuration can be typed in or loaded from a JSON file. |
| Database (4) | Data from databases created when a node is setup can be viewed here. The databases are named after the serial numbers of nodes and can be used to confirm the flow of data. |
| Visualization (5) | Data can be visualized in graphs. Refer to Data visualization for more information. |
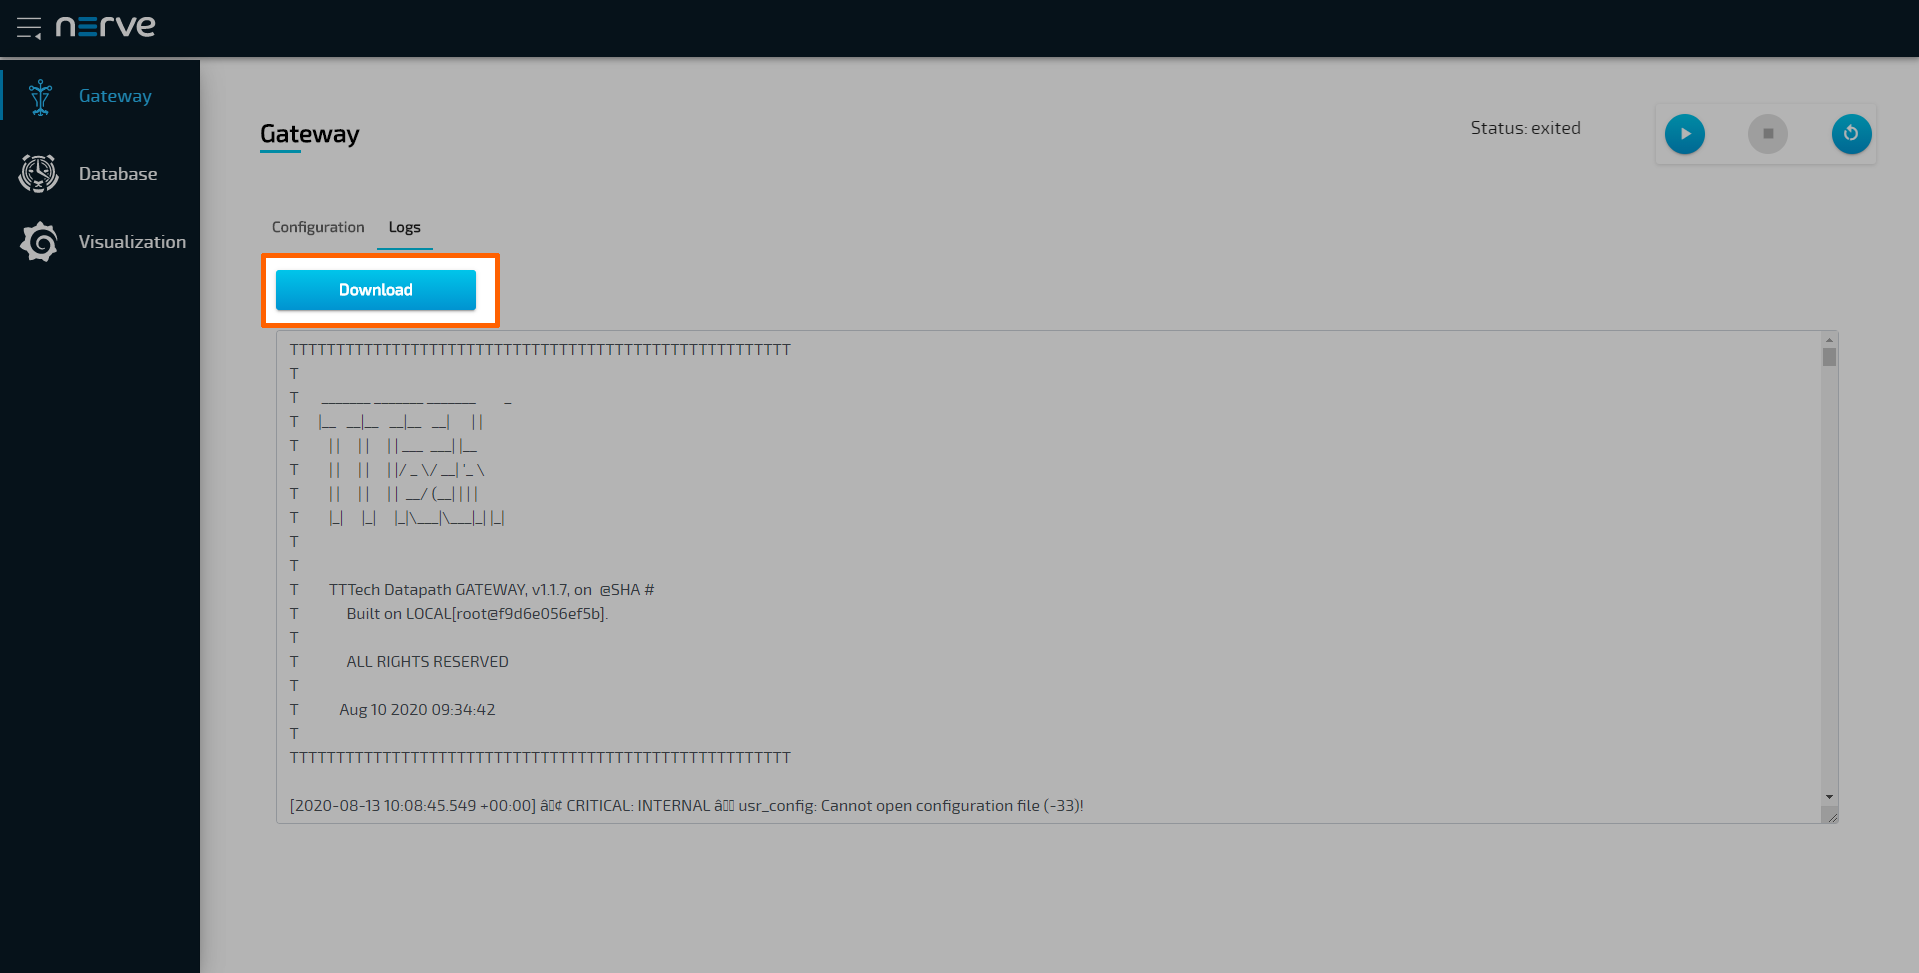
| Configuration and Logs tabs (6) | Logs can be viewed within every Data Services element that can be selected in the navigation on the left. The latest logs of the selected Data Services element can be viewed within the Logs tab. The entirety of the logs can be exported into a file using the Download button in that tab. The Configuration tab is displayed by default. |
| Gateway controls (7) | This is the status indicator and the controls of the Gateway. Running indicates that the configuration has been accepted and the Gateway is running. When the status is stopped, there is either a problem in the configuration or the Gateway has been stopped manually. |
Accessing the Data Services UI on the node
To access the Data Services UI on the node, access the Local UI. Connecting to the Local UI depends on the Nerve Device. Follow the link to the Local UI according to the used Nerve Device in the table below:
| Nerve Device | Physical port | Local UI |
|---|---|---|
| MFN 100 | P1 | http://172.20.2.1:3333 |
| Kontron KBox A-150-APL | LAN 1 | <wanip>:3333To figure out the IP address of the WAN interface, refer to Finding out the IP address of the device in the Kontron KBox A-150-APL chapter of the device guide. |
| Kontron KBox A-250 | ETH 2 | <wanip>:3333To figure out the IP address of the WAN interface, refer to Finding out the IP address of the device in the Kontron KBox A-250 chapter of the device guide. |
| Maxtang AXWL10 | LAN1 | <wanip>:3333To figure out the IP address of the WAN interface, refer to Finding out the IP address of the device in the Maxtang AXWL10 chapter of the device guide. |
| Siemens SIMATIC IPC127E | X1 P1 | http://172.20.2.1:3333 |
| Siemens SIMATIC IPC427E | X1 P1 | http://172.20.2.1:3333 |
| Supermicro SuperServer E100-9AP-IA | LAN1 | <wanip>:3333To figure out the IP address of the WAN interface, refer to Finding out the IP address of the device in the Supermicro SuperServer E100-9AP-IA chapter of the device guide. |
| Supermicro SuperServer 1019D-16C-FHN13TP | LAN3 | http://172.20.2.1:3333 |
| Supermicro SuperServer 5029C-T | LAN1 | <wanip>:3333To figure out the IP address of the WAN interface, refer to Finding out the IP address of the device in the Supermicro SuperServer 5029C-T chapter of the device guide. |
| Vecow SPC-5600-i5-8500 | LAN 1 | http://172.20.2.1:3333 |
| Winmate EACIL20 | LAN1 | <wanip>:3333To figure out the IP address of the WAN interface, refer to Finding out the IP address of the device in the Winmate EACIL20 chapter of the device guide. |
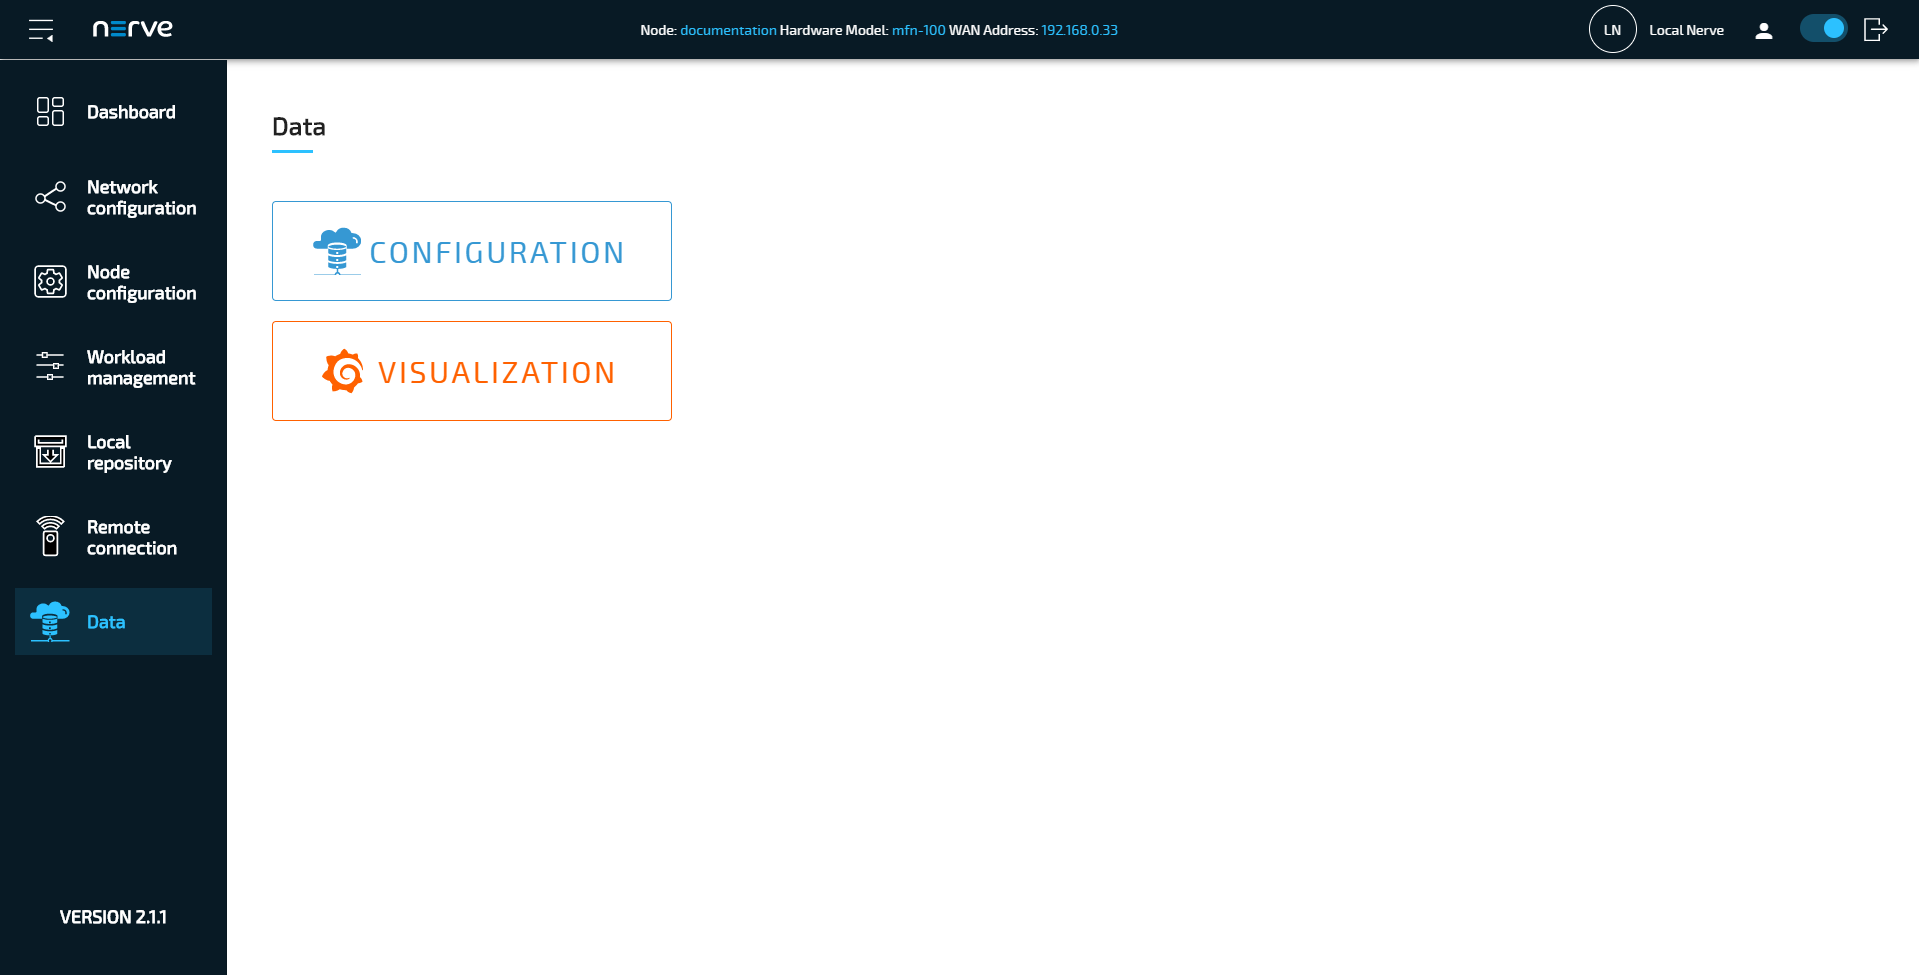
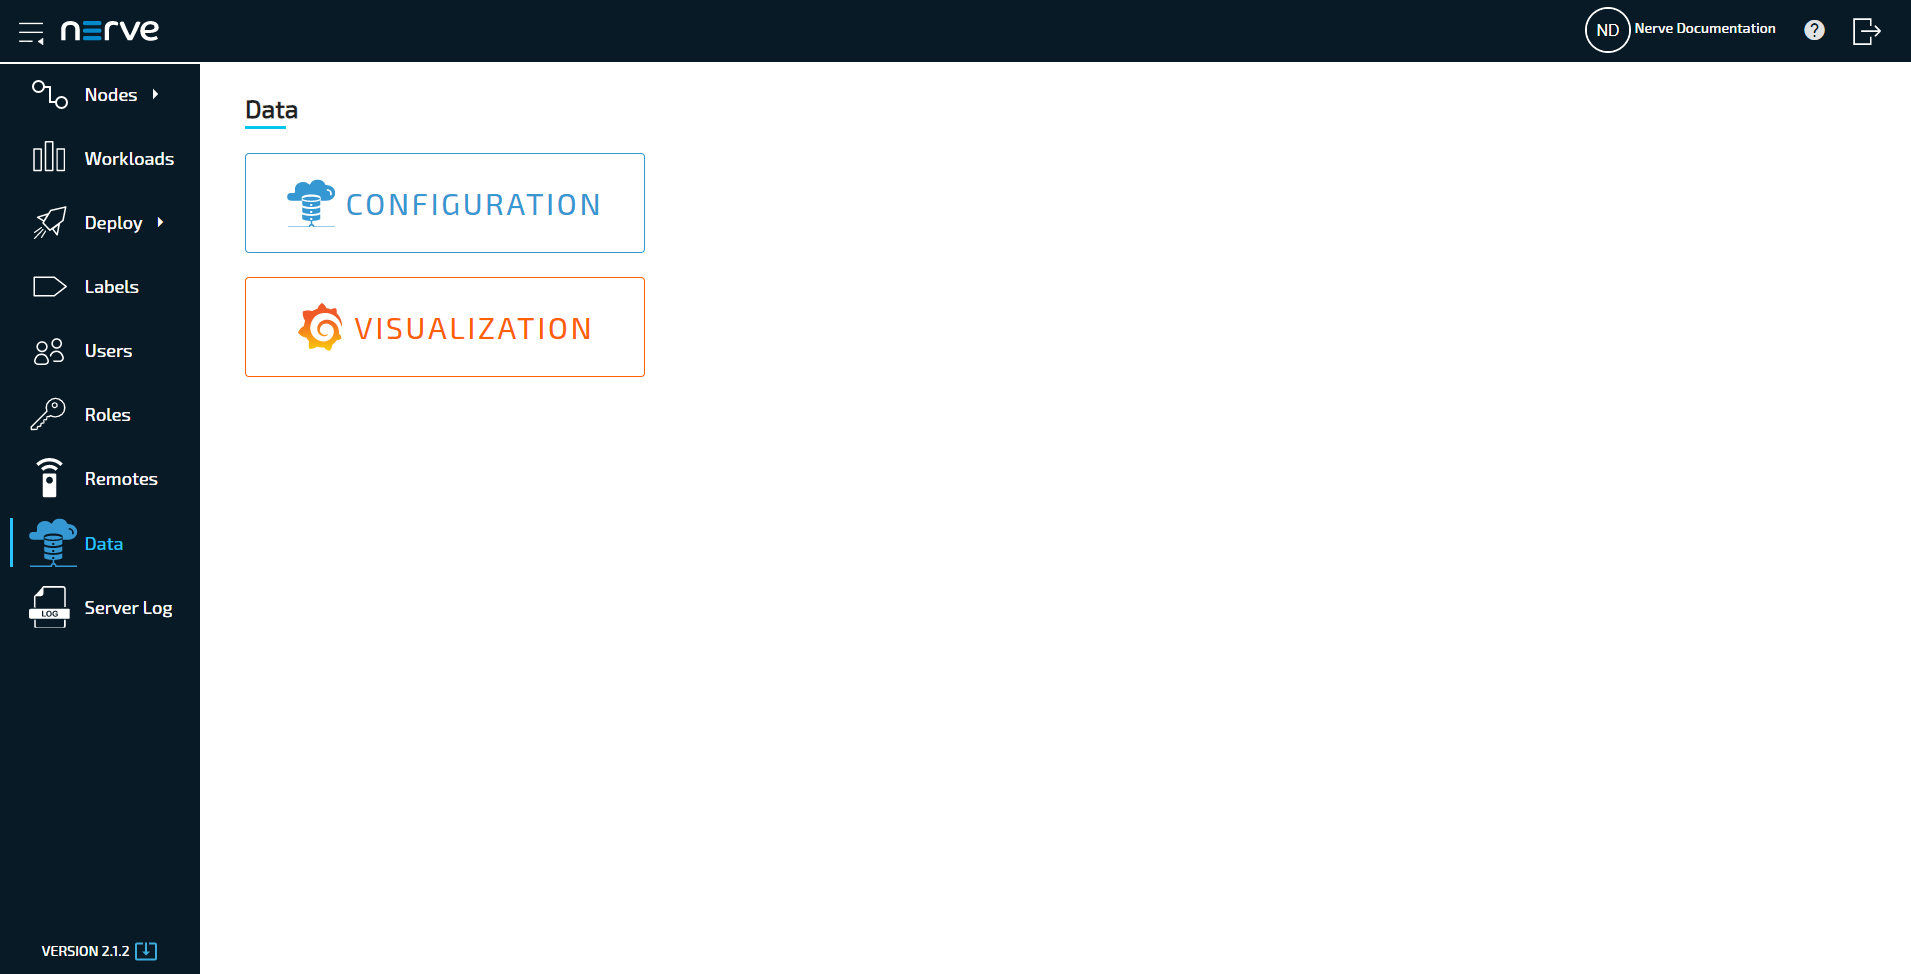
Select Data in the navigation on the left and select CONFIGURATION on the right to access the Data Services UI.
Accessing the Data Services UI in the Management System
By default, the permission to access to Data Services is not granted. Users that have the permission to create user roles can enable the Data Services entry in the Management System navigation by adding the UI_NAV_DATAPATH:VIEW permission to a user role. A Data Services user role is also defined in the Management System by default that can be added to a user. Refer to Users for information on how to create new users and to Roles and permissions for information on how to add a new role.
- Log in to the Management System. Make sure the user has a role with the correct permission assigned.
- Select Data in the navigation on the left.
-
Select CONFIGURATION to access the Data Services UI.
How to export a log file
Every element of the Data Services is producing log files locally and centrally that can be viewed in the Logs tab. These logs can also be downloaded through the Data Services UI.
- Select a Data Services element in the navigation on the left.
-
Select the Logs tab on the right.
Note
Note that the visualization element does not have a Logs tab. Instead the logs are displayed on the first level and can be downloaded by selecting Download.
-
Select Download to export a LOG file.