Nerve Data Services
The Nerve Data Services are a collection of modular services and interfaces that allow to collect, store, analyze, visualize and distribute data. These services and interfaces are available as a Docker Compose workload that is deployed to the Nerve node. Using Nerve Data Services, data can be collected at high speeds and stored, processed or visualized locally at the Node.
Most elements of the Nerve Data Services are individually configurable. This allows for an application in a large number of scenarios and use cases. However, this also implies deeper knowledge of the elements and their possible interactions. Refer to the separate pages of each element for further explanations.
Installing the Nerve Data Services
The Nerve Data Services are available as an easy to install Docker Compose workload. However, this workload needs to be provisioned by Nerve service technicians. Contact a sales representative or write an issue through the TTTech Industrial support portal for information on component combinations and to request the Nerve Data Services workload. Note that the workload needs to be requested even if Data Services had already been used before version 2.7.0.
Once the workload has been provisioned in the Management System, deploy the Nerve Data Services Docker Compose workload to a node designated to ingest data. Refer to Deploying a workload for more information on how to deploy workloads.
Note
Due to the modular nature of the Data Services from version 2.7.0 on, make sure to back up any user created data, e.g. gateway configuration files in the Data Services, before updating to a new version. Contact a sales representative or write an issue through the TTTech Industrial support portal for any required support.
Features
The table below provides an overview of features in the Nerve Data Services.
| Feature | Description |
|---|---|
| Nerve Data Services Gateway | The Gateway is the central application of the Data Services. Its purpose is receiving data from a source via a certain protocol on an input interface and forwarding it to a destination using a different protocol on an output interface. This behavior is reflected in the user configuration as well. In general, the configuration consists of inputs, outputs and connections between them. |
| Graphical configuration tool | The Gateway is configured through a graphical user interface. Inputs, outputs and connections have custom options available, where mandatory fields are marked. The configuration interface also allows the export of existing configurations and the import on the same node or different nodes. |
| Supported protocols | The Nerve Data Services can collect data from multiple protocols and formats. This also includes multiple Ethernet-based fieldbus protocols. Data can also be distributed again in different formats via multiple protocols. Fieldbus protocols are read through the I/O port (if available, depending on the Nerve Device) while other inputs can be read through external inputs or installed workloads on the node. Here is a list of supported protocols: Fieldbus protocols
|
| Continuous data transfer | The Gateway can, under certain circumstances, ensure continuous operation for existing inputs and outputs when new configurations are applied. This is done through the application of a smart connection creation mechanism. When adding new data connections in the Gateway, existing inputs and outputs that are not affected by the changes will continue their operation uninterrupted while the Gateway creates the data connections. When applying the updated Gateway configuration, the configuration UI will give a warning message, including a list of connections affected by the update that will experience a short data flow interruption. |
| NerveDB | The NerveDB is a custom TimescaleDB that is pre-configured for use with Nerve. As such, it has minimal need for configuration. An instance of the NerveDB is available on the node. |
| Visualization | Data stored in the Data Services can be visualized via Grafana, an open source web application which provides charts, graphs and alerts for data visualization. An instance of Grafana is available on each node to visualize data stored in databases on the node. |
| Sending data to third party clouds | The Nerve Data Services are designed to seamlessly communicate with other third party cloud environments. Microsoft Azure IoT Hub is supported out-of-the-box. It is also possible to configure the Nerve Data Services to provide data to other third party cloud providers. |
| High data ingestion | The Nerve Data Services allow a data ingestion rate into the local storage of up to 100,000 data points per second. |
| Custom JSON format | The Nerve Data Services Gateway supports receiving user defined JSON data formats on all receiving interfaces. Similarly, data can also be sent in custom JSON formats. |
Workflow
The following section gives an overview of a typical workflow, presenting what can be done with the Nerve Data Services on a high level:
- Installing the Nerve Data Services
- Setting up data sources
- Configuring the Gateway to collect data and defining where to distribute it
- Configuring Grafana on the node for data visualization
- Implementing a third-party analytics app and configuring the Gateway again to send data to the analytics app
- Reconfiguring Grafana to visualize the result of the processing performed by the analytics app
The paragraphs below give short explanations to each step.
Installing the Nerve Data Services
Nerve Data Services are available as an easy to install Docker Compose workload. Make sure that the Nerve Data Services are available as a Docker Compose workload in the Management System. Deploy the Nerve Data Services Docker Compose workload to a node designated to ingest data.
Ingesting data on the node
When ingesting data on the node, the data is received by the Gateway which then distributes to various destinations. For data received from a fieldbus protocol, CODESYS will be used to translate it into OPC UA format. The Gateway then gets configured to collect the data from CODESYS and distribute it further.
Distributing data on the node
Data is distributed by the Gateway to user defined consumers. Unless the respective protocol of a Gateway output defines a specific data format, all data received by the Gateway is normalized to the Nerve Data Services data format. Typical consumers of data are the data storage on the node, third party MQTT brokers or applications, or providing the data as OPC UA Server. To enable reuse of Gateway configurations across multiple nodes, keywords can be used to abstract node specific information from the configuration.
Storage on the node
Data is stored in the NerveDB on the node, a dedicated TimescaleDB database. Any application running on the node can access data stored in there. A time window (data retention time) can be configured for how long data shall be kept before deleting it.
Visualization on the node
Visualization is available via Grafana which is pre-configured to allow access to data stored in the local data storage. It is also possible to configure access from Grafana to other user defined data sources without any restrictions, meaning that data not stored in the local database of the Data Services can also be visualized. Note that an older version of Grafana is installed with the Nerve Data Services due to the AGPL license. If a newer version is needed, it needs to be provisioned separately.
Using Data in analytics
Third party applications such as Node-RED or Crosser can be used for analytics together with the Nerve Data Services.
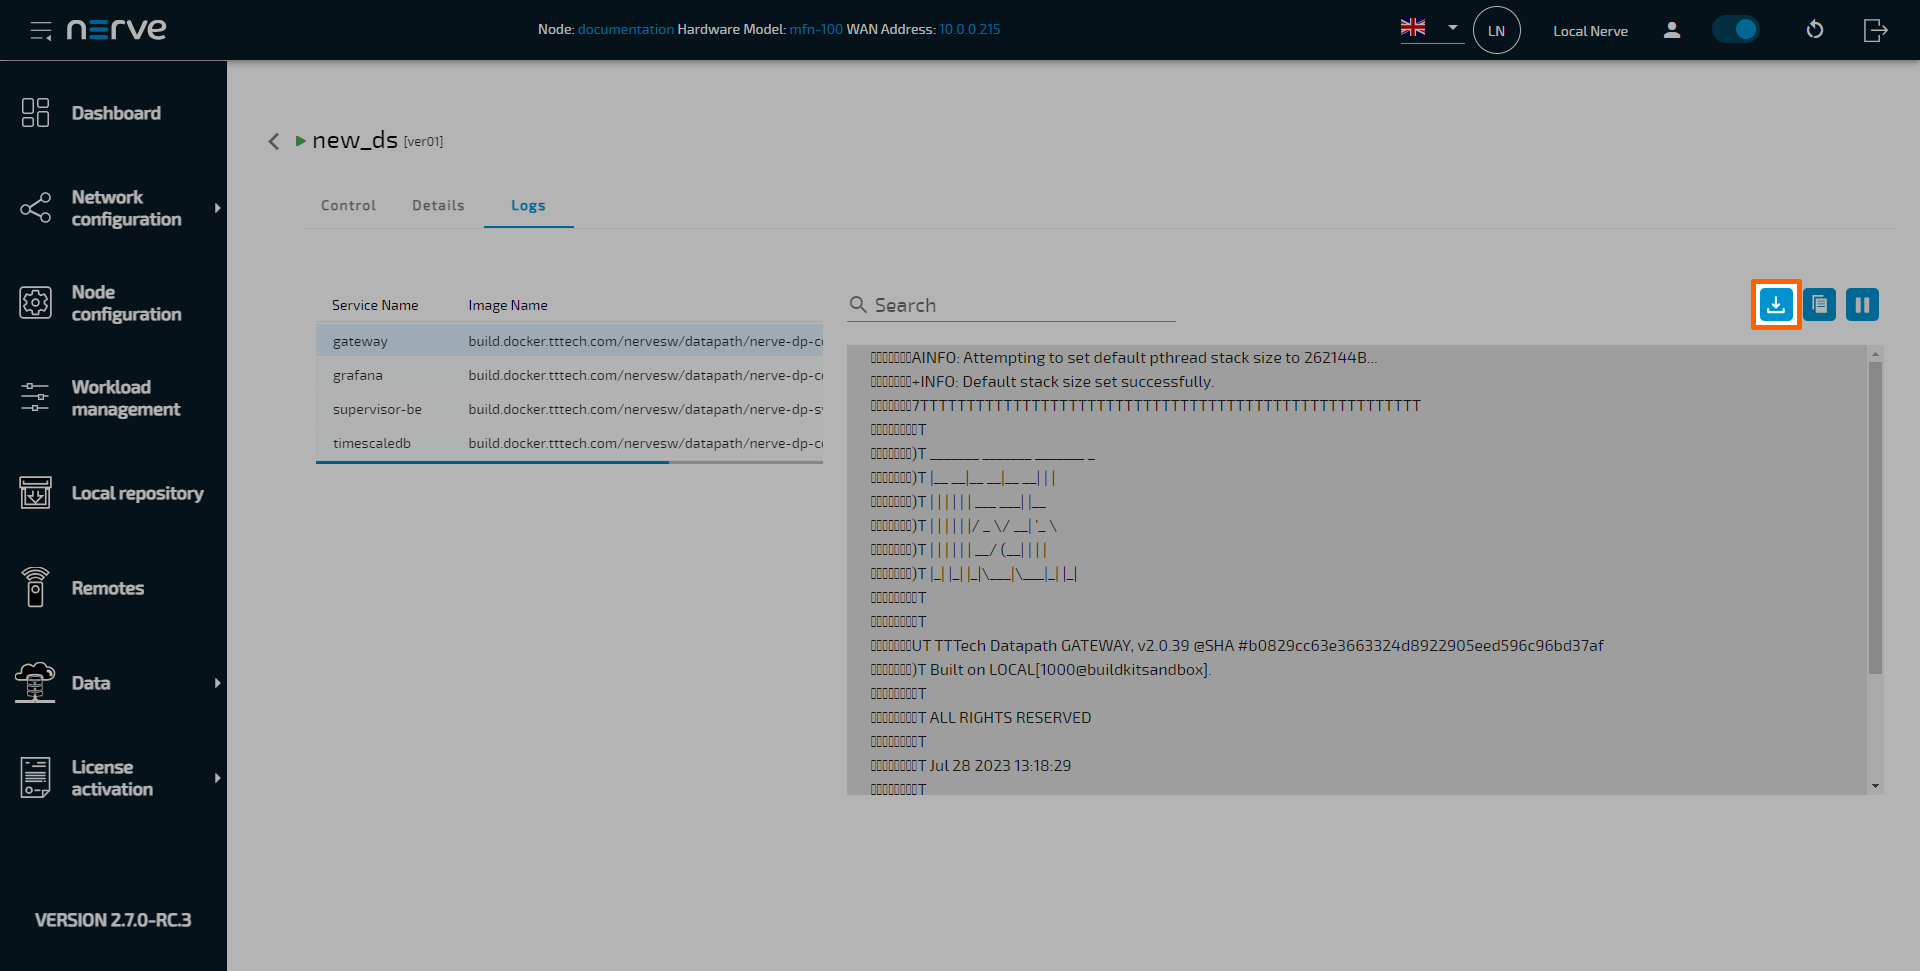
How to export a log file
Every element of the Data Services is producing log files that can be viewed in the Logs tab in the Workload management section of the Local UI. These logs can also be downloaded.
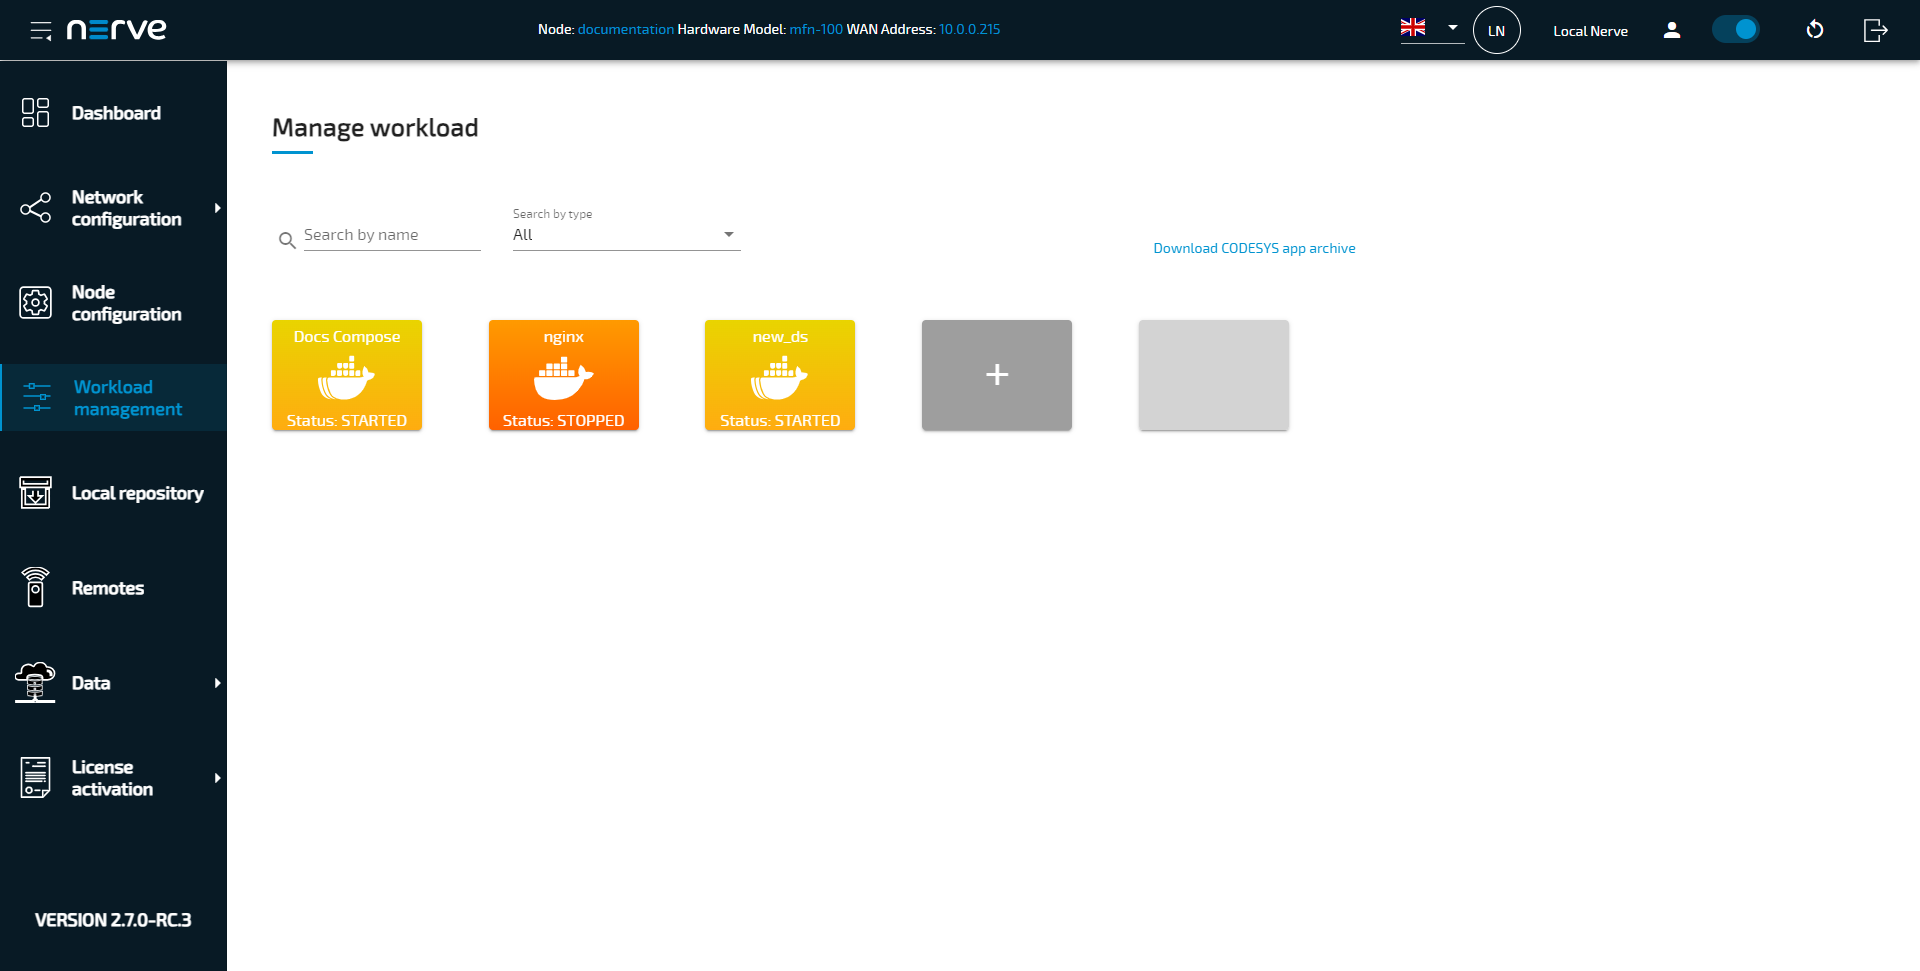
- Access the Local UI.
-
Select Workload management in the navigation on the left.
-
Select the Nerve Data Services Docker Compose workload.
-
Select the Logs tab.

-
Select one of the services.
-
Select the Download icon to export a LOG file.