Data Visualization
Data stored in the Data Services can be visualized via Grafana, an open source web application which provides charts, graphs and alerts for data visualization. This chapter describes only how Grafana is configured and how it can be accessed. Refer to the Grafana documentation for general information on how to use Grafana.
warning
- Due to security risks, the supported version of Grafana is no longer provided. If you would like to use a current version of Grafana, please submit a request via the TTTech Industrial support portal to contact customer support.
- To use Grafana, the user must be logged in to the Local UI. When logged out, Grafana is no longer able to perform its internal operations and reports random errors. To continue working with Grafana, close the browser tab, log in again and re-open Grafana.
Data Visualization on the node
On the node, a single data source exists in Grafana, formatted as <serialnumber>. Use this data source in all panels to visualize data received by the Data Services.
-
Access the Local UI on the node. This is Nerve Device specific. Refer to the table below for device specific links to the Local UI. The initial login credentials to the Local UI can be found in the customer profile.
Nerve Device Physical port Local UI MFN 200 P3 http://172.20.2.1:3333 MFN 100 P1 http://172.20.2.1:3333 Kontron KBox A-250 ETH 2 <wanip>:3333
To figure out the IP address of the WAN interface, refer to Finding out the IP address of the device in the Kontron KBox A-250 chapter of the device guide.Siemens SIMATIC IPC427E X1 P1 http://172.20.2.1:3333 Siemens SIMATIC IPC BX-39A X1 P1 http://172.20.2.1:3333 Vecow SPC-5600-i5-8500 LAN 1 http://172.20.2.1:3333 Compulab fitlet3 LAN3 http://172.20.2.1:3333 -
Select Workload management in the navigation on the left.
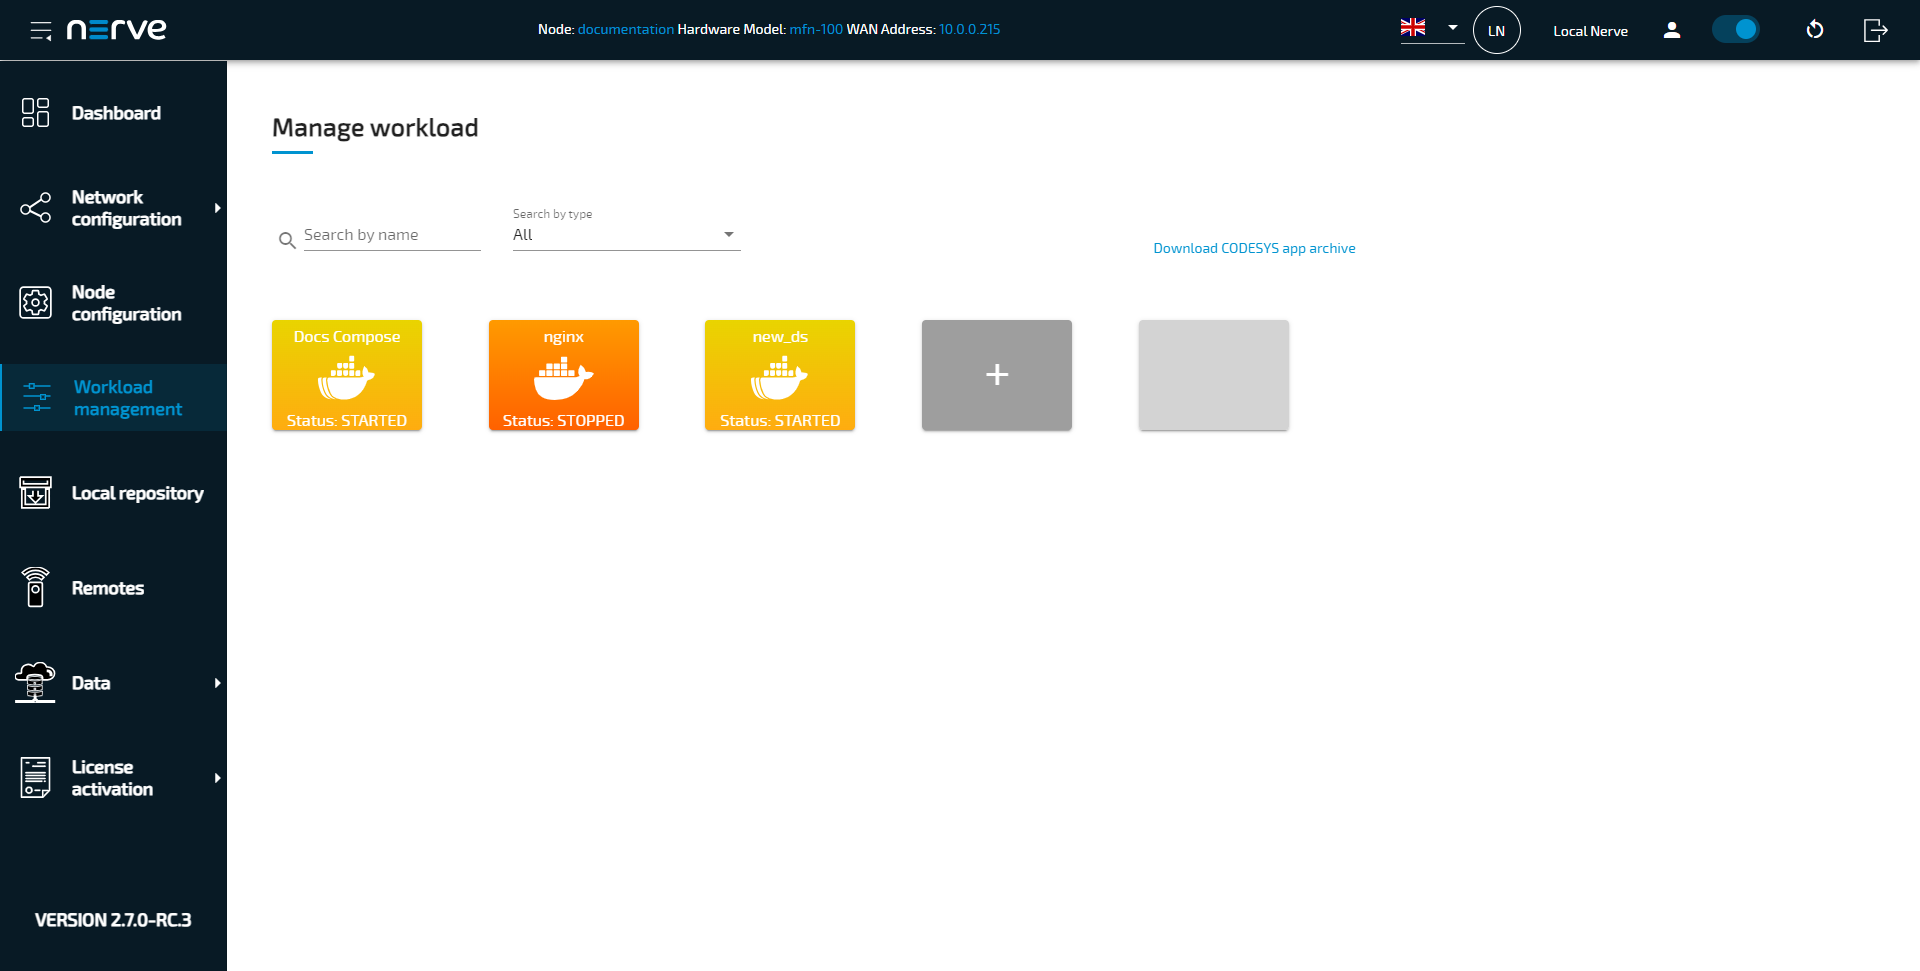
-
Select the Nerve Data Services Docker Compose workload.
-
Select the Grafana web UI link.
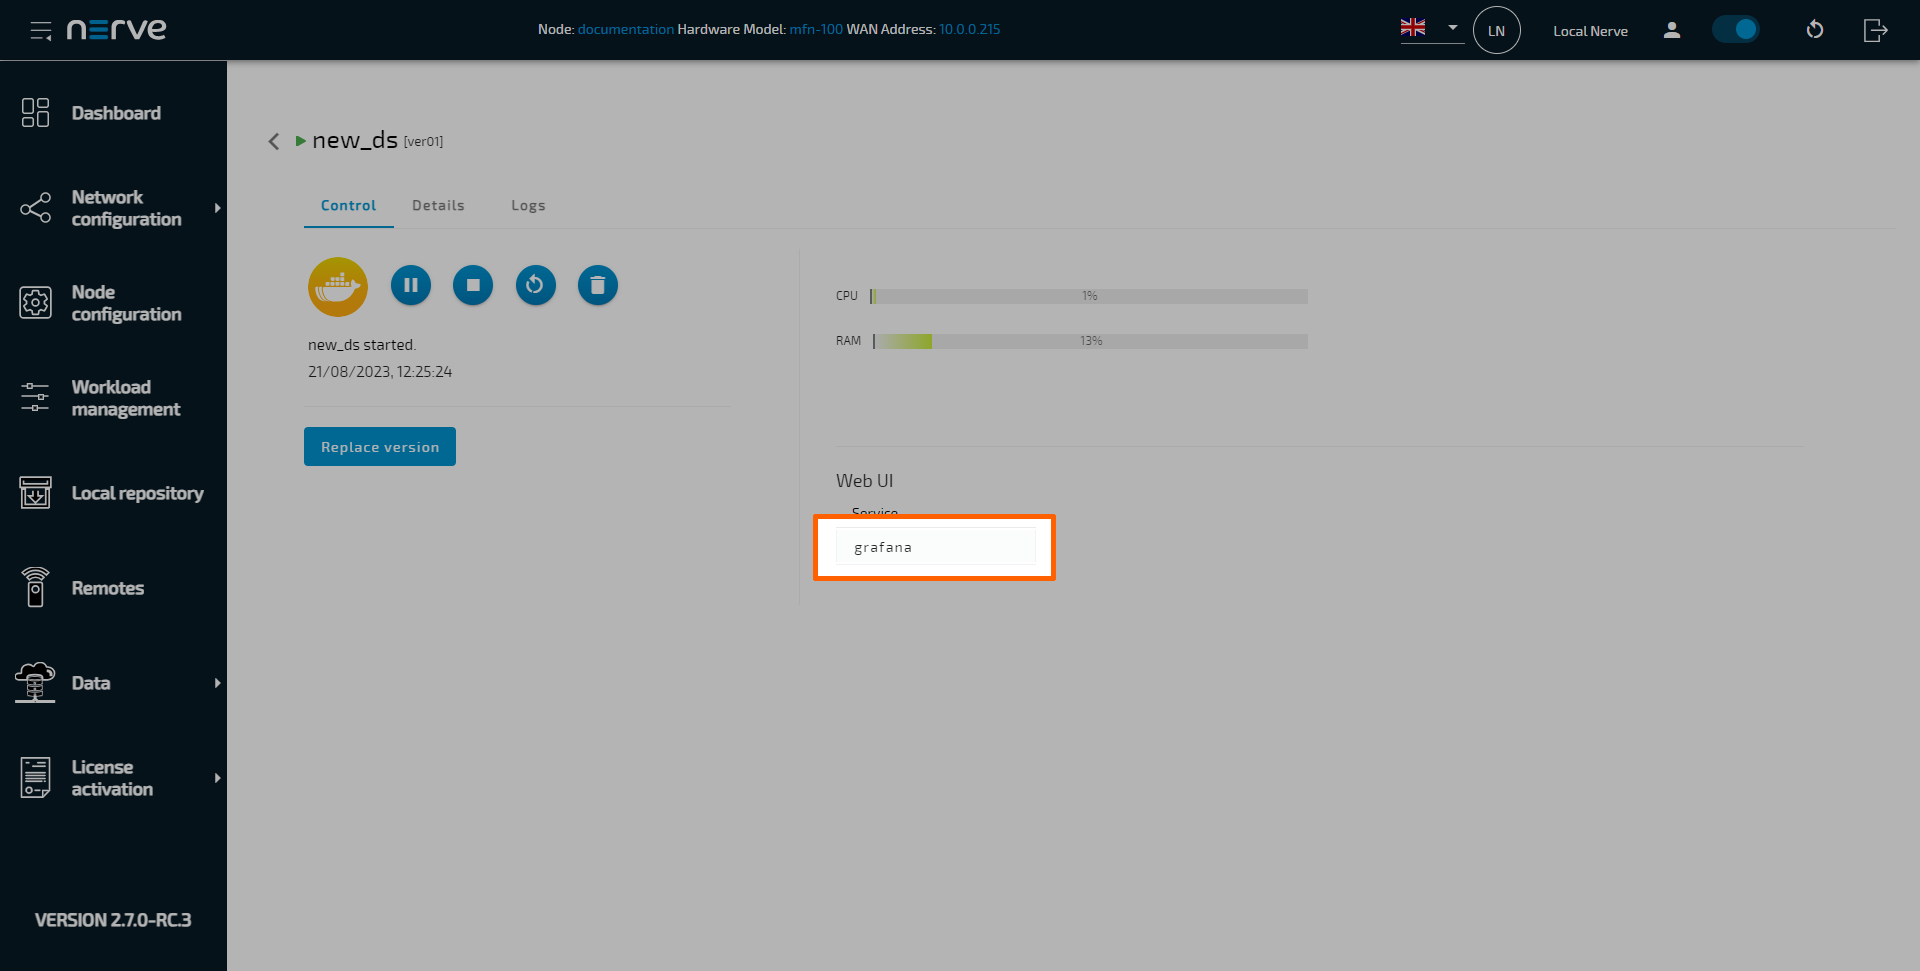
-
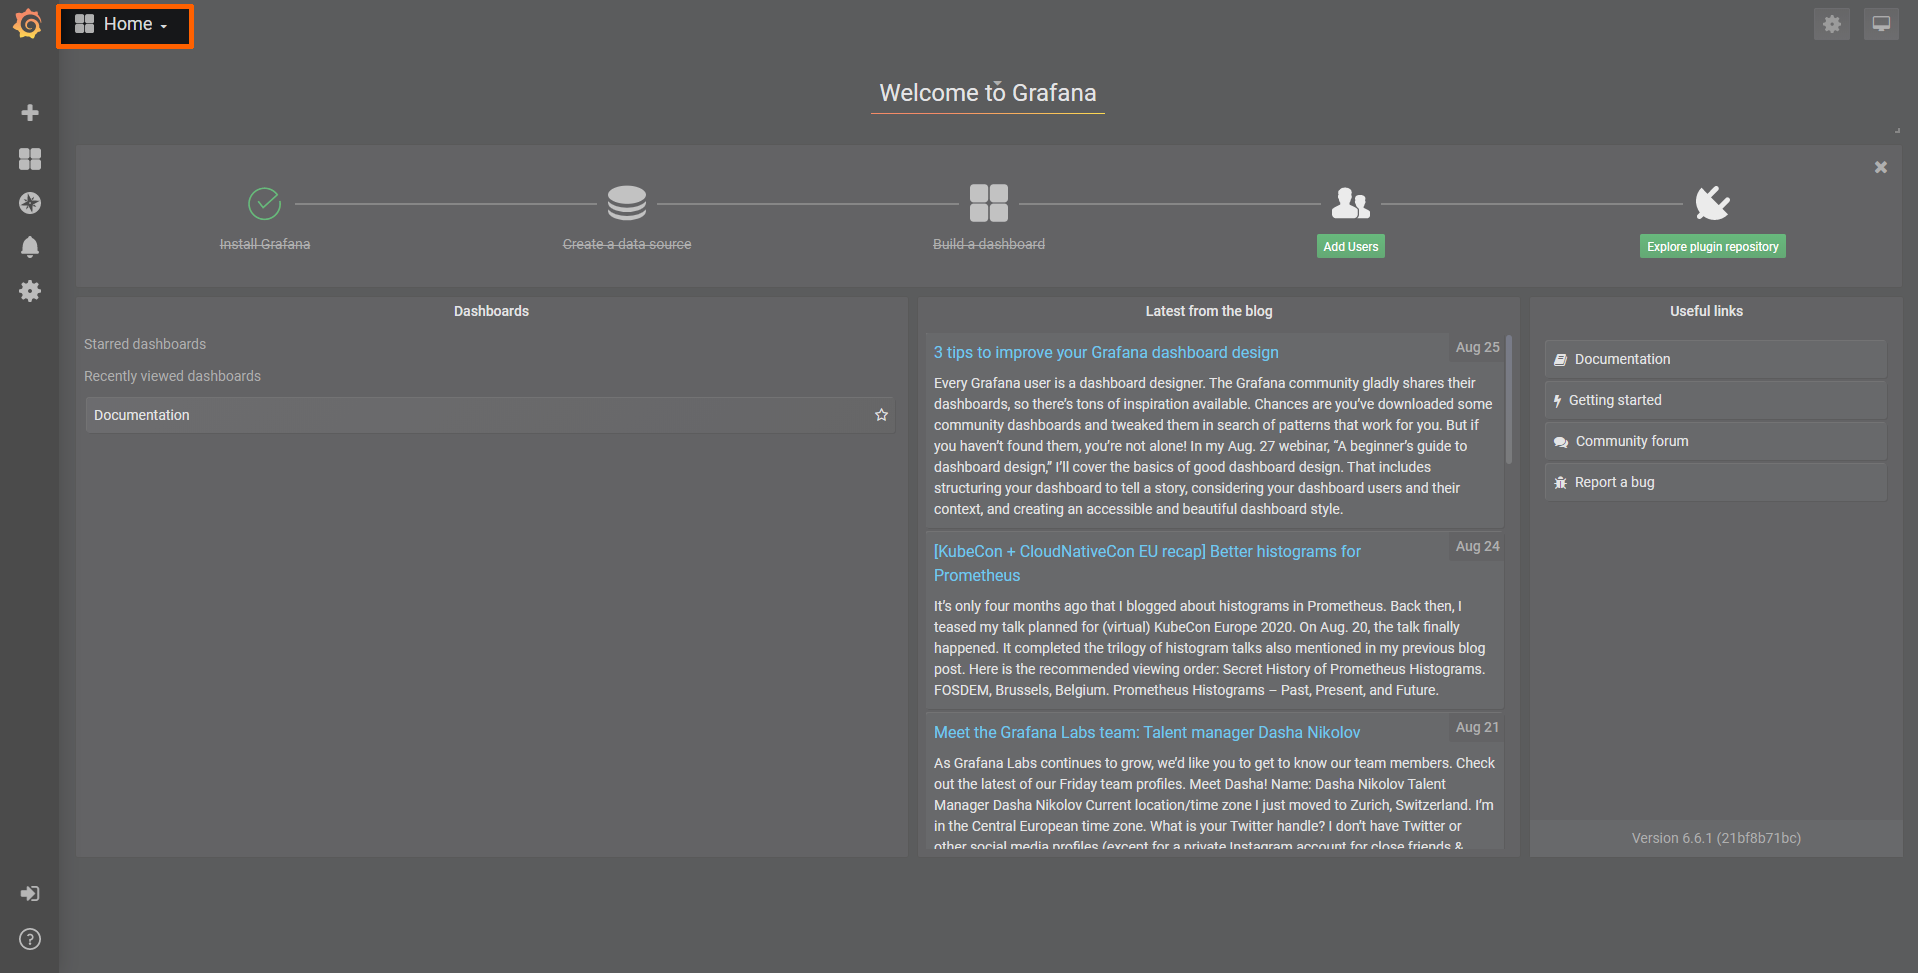
A new browser tab opens to show the home screen of Grafana. Login with the following credentials:
- Username:
admin - Password:
admin
Note
It is recommended to change the login credentials after the initial login.
- Username:
From here dashboards can be created as described below.
Creating a dashboard
The instructions below cover the general workflow of creating a dashboard.
- Access the visualization element on the node.
-
Select + > Dashboard in the navigation on the left. A box will appear.
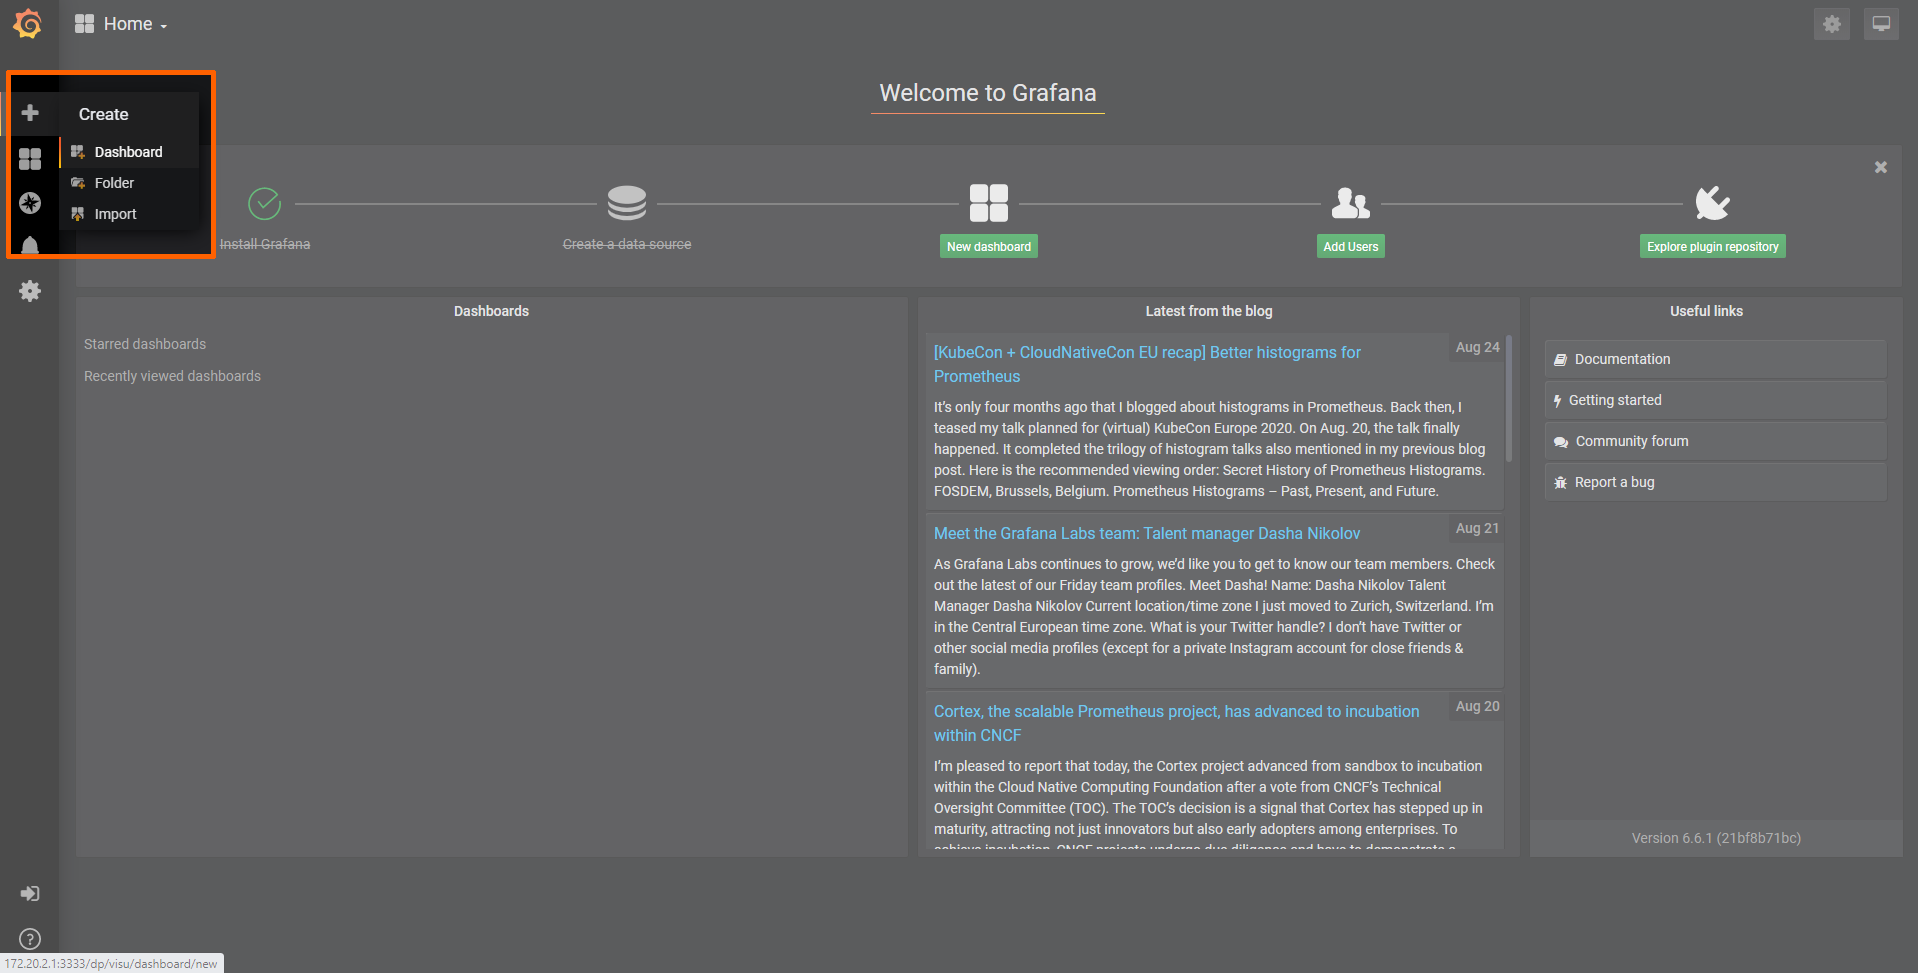
-
Select Add Query in the New Panel box.
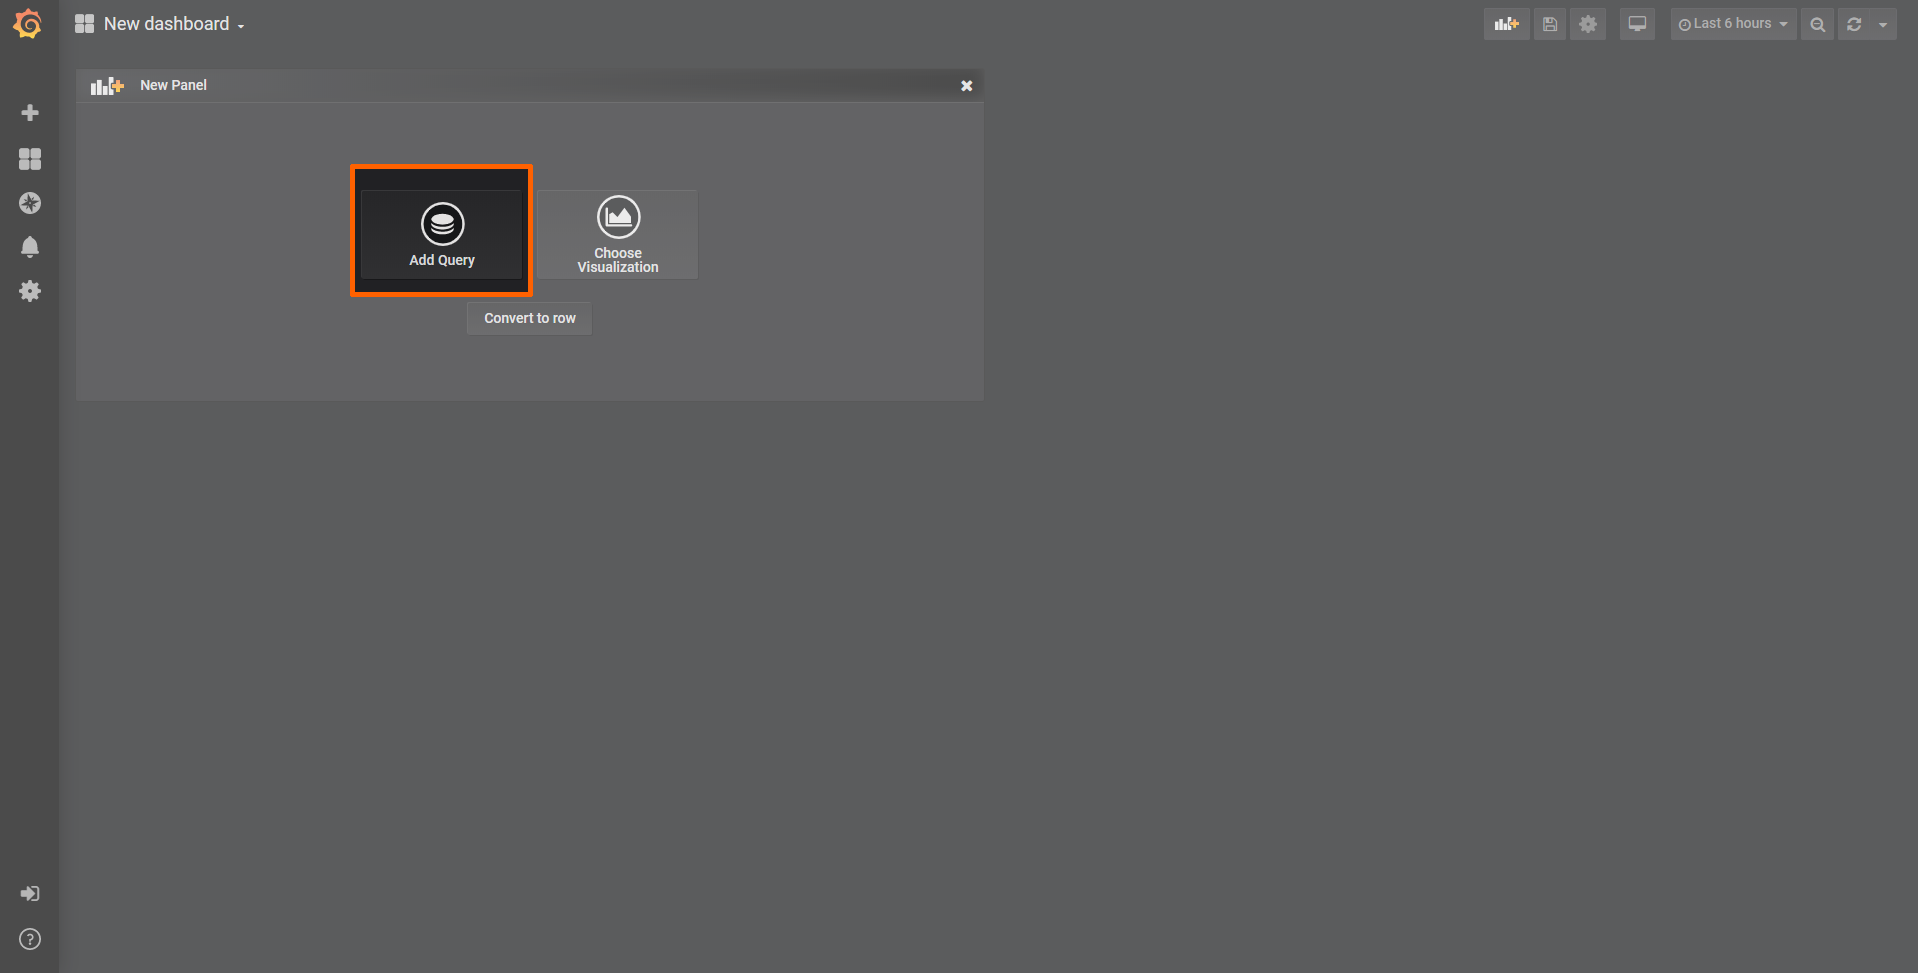
-
Select the data source from the drop-down menu. The name of the data source is the serial number of the node.
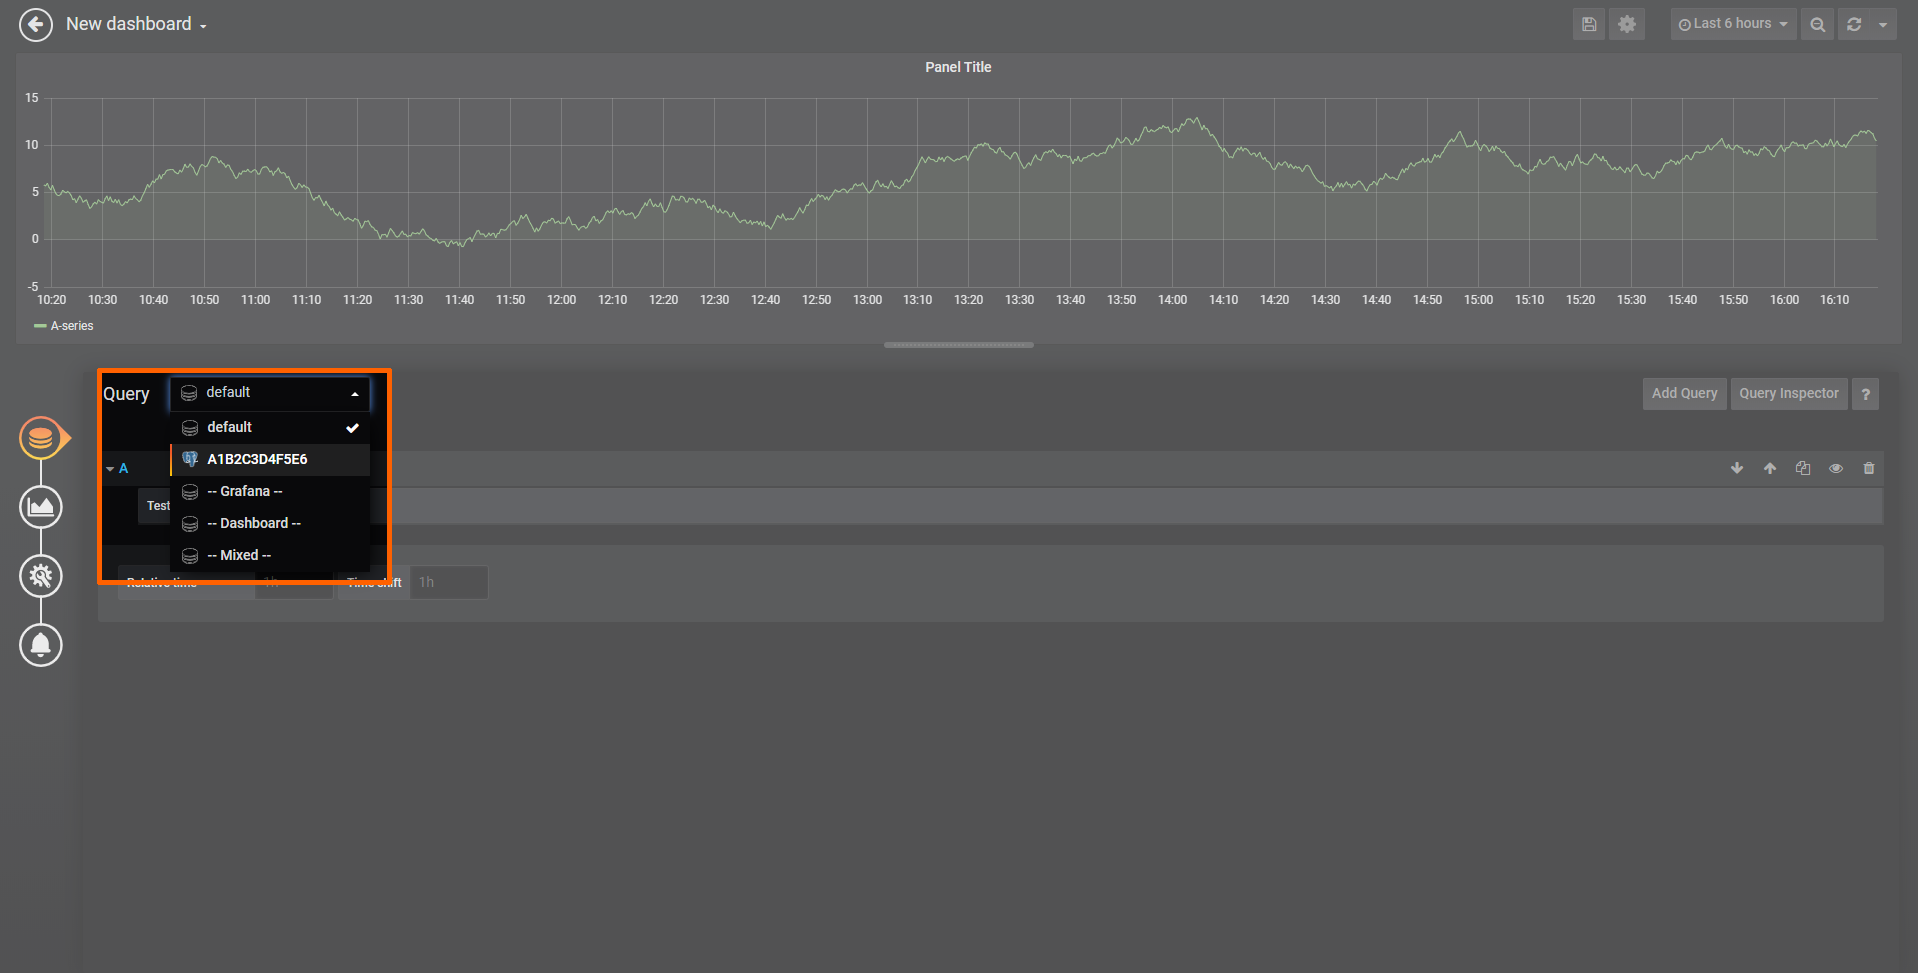
-
Fill in the query information below that appears below. This information depends on the use case and the Gateway configuration.
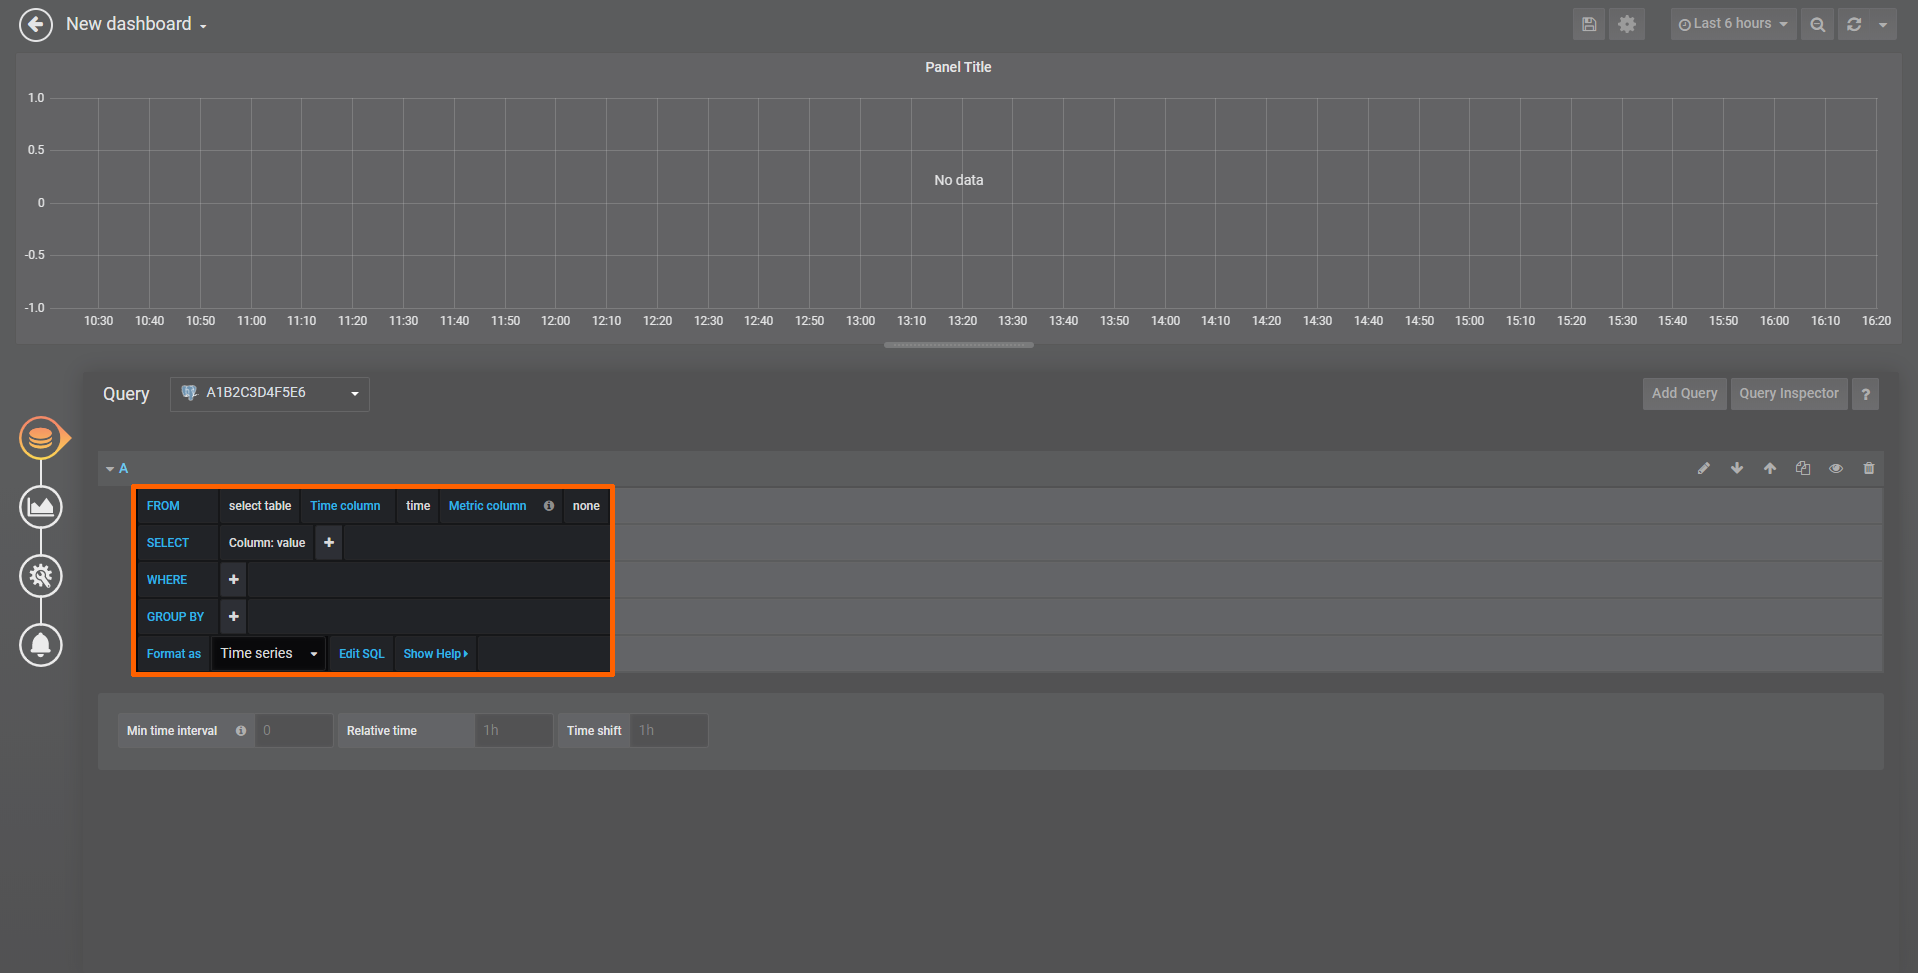
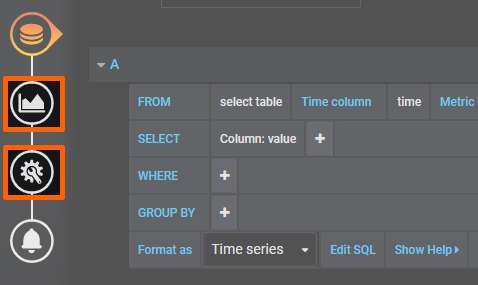
Note
Customize general settings and visualization settings by selecting General and Data in the navigation on the left. Refer to the Grafana documentation for more information.
-
Select the save icon in the upper-right corner to save the dashboard.
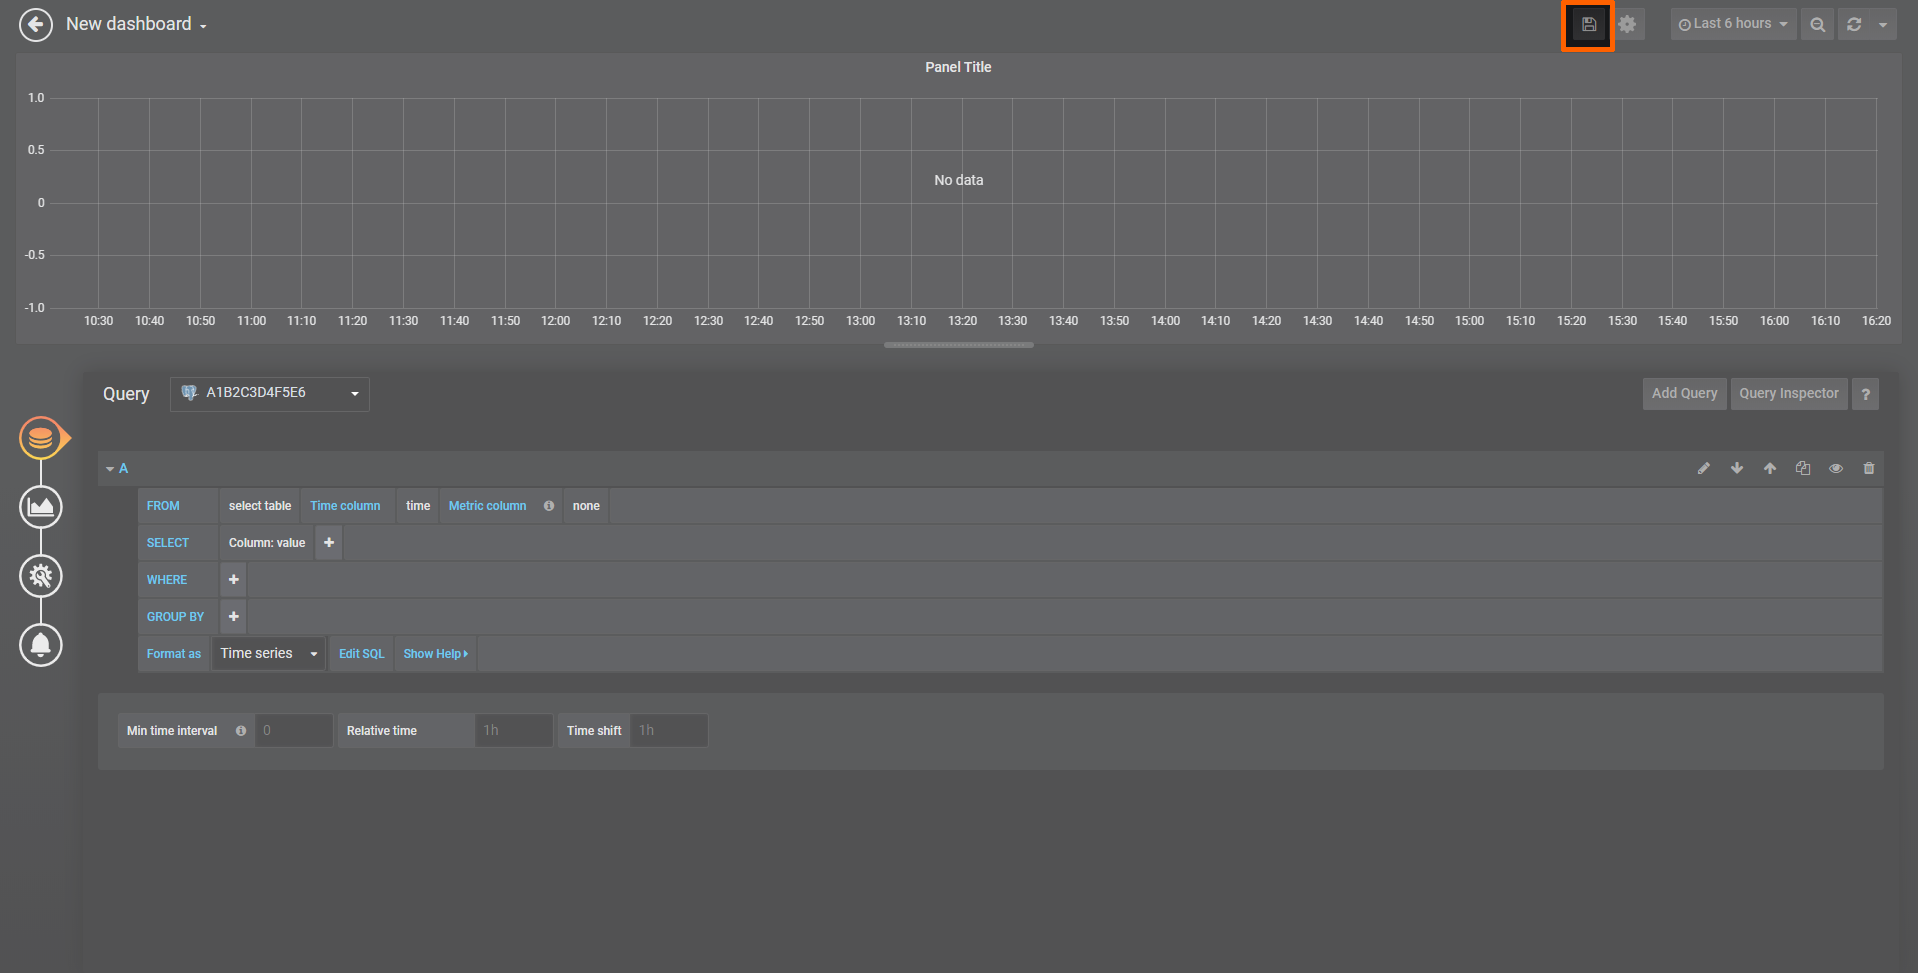
Access the dashboard from the home menu.
For specific examples on how to use Grafana with Nerve Data Services, refer to the Examples section.