Nodes
The nodes menu has two sub-menus in the navigation on the left and two tabs in the default view.
The node tree tab is the default view of the Management System. It displays all registered nodes in a node tree. It mainly serves an organizational purpose and does not impact the functionality of the nodes. Nodes and workloads can be managed in the node details view, which is reached through the node tree.
Selecting the node list tab displays a list of all available nodes that have been registered in the Management System. Add, remove, and edit nodes here.
Available updates for nodes can be found in the Updates sub-menu. Performed node updates can be viewed in the Update Log. When an update is performed, the update log also shows the current progress of the update.
Node tree
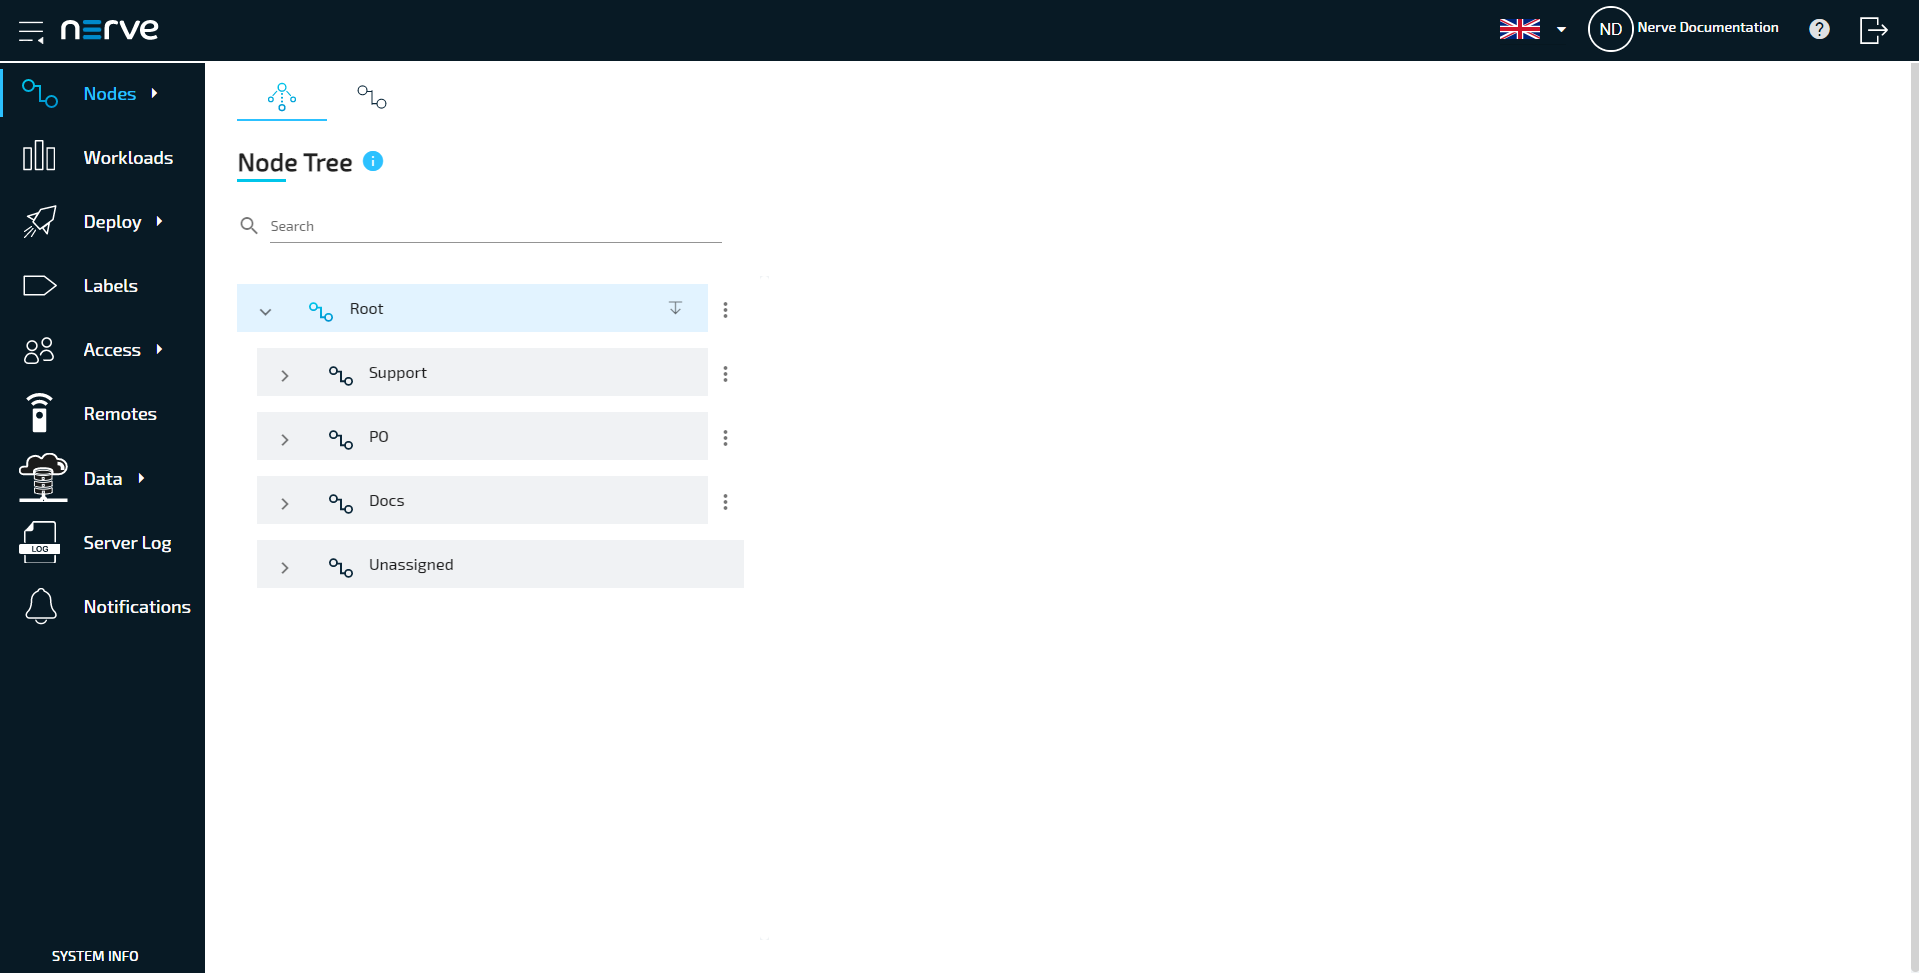
The node tree is the landing page of the Management System. It presents an overview of all nodes that are connected to the Management System, embedded into tree view elements. Being mainly a means of organization, it has no impact on the functionality of the nodes and their workloads. Select Nodes in the navigation on the left. Then select the node tree tab on the right.
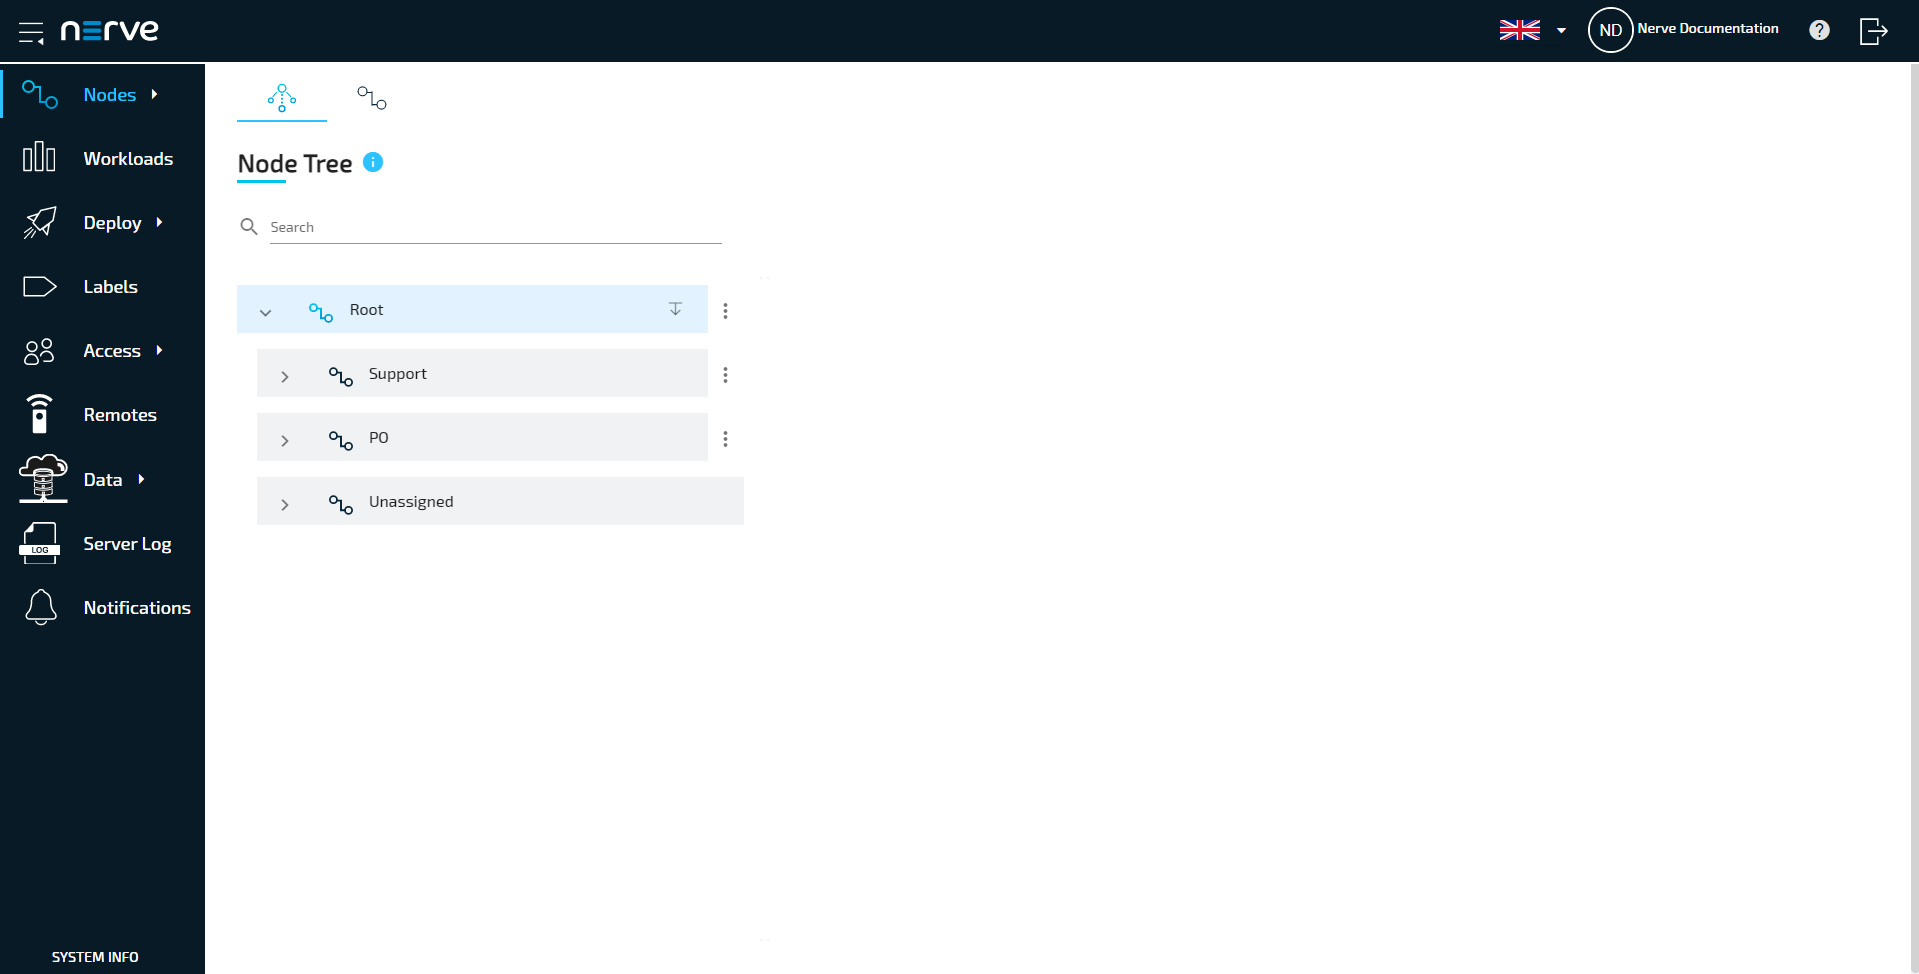
There is only one element under the root after the initial setup: Root > Unassigned. All nodes that are registered in the Management System are placed in the Unassigned element by default. From there they can be moved to new elements that have to be created first.
Creating a new element in the node tree
Before moving a node out of the Unassigned element, create a new element in the node tree. Elements in the node tree exclusively serve an organizational purpose.
- Select Nodes in the navigation on the left.
- Select the node tree tab on the right.
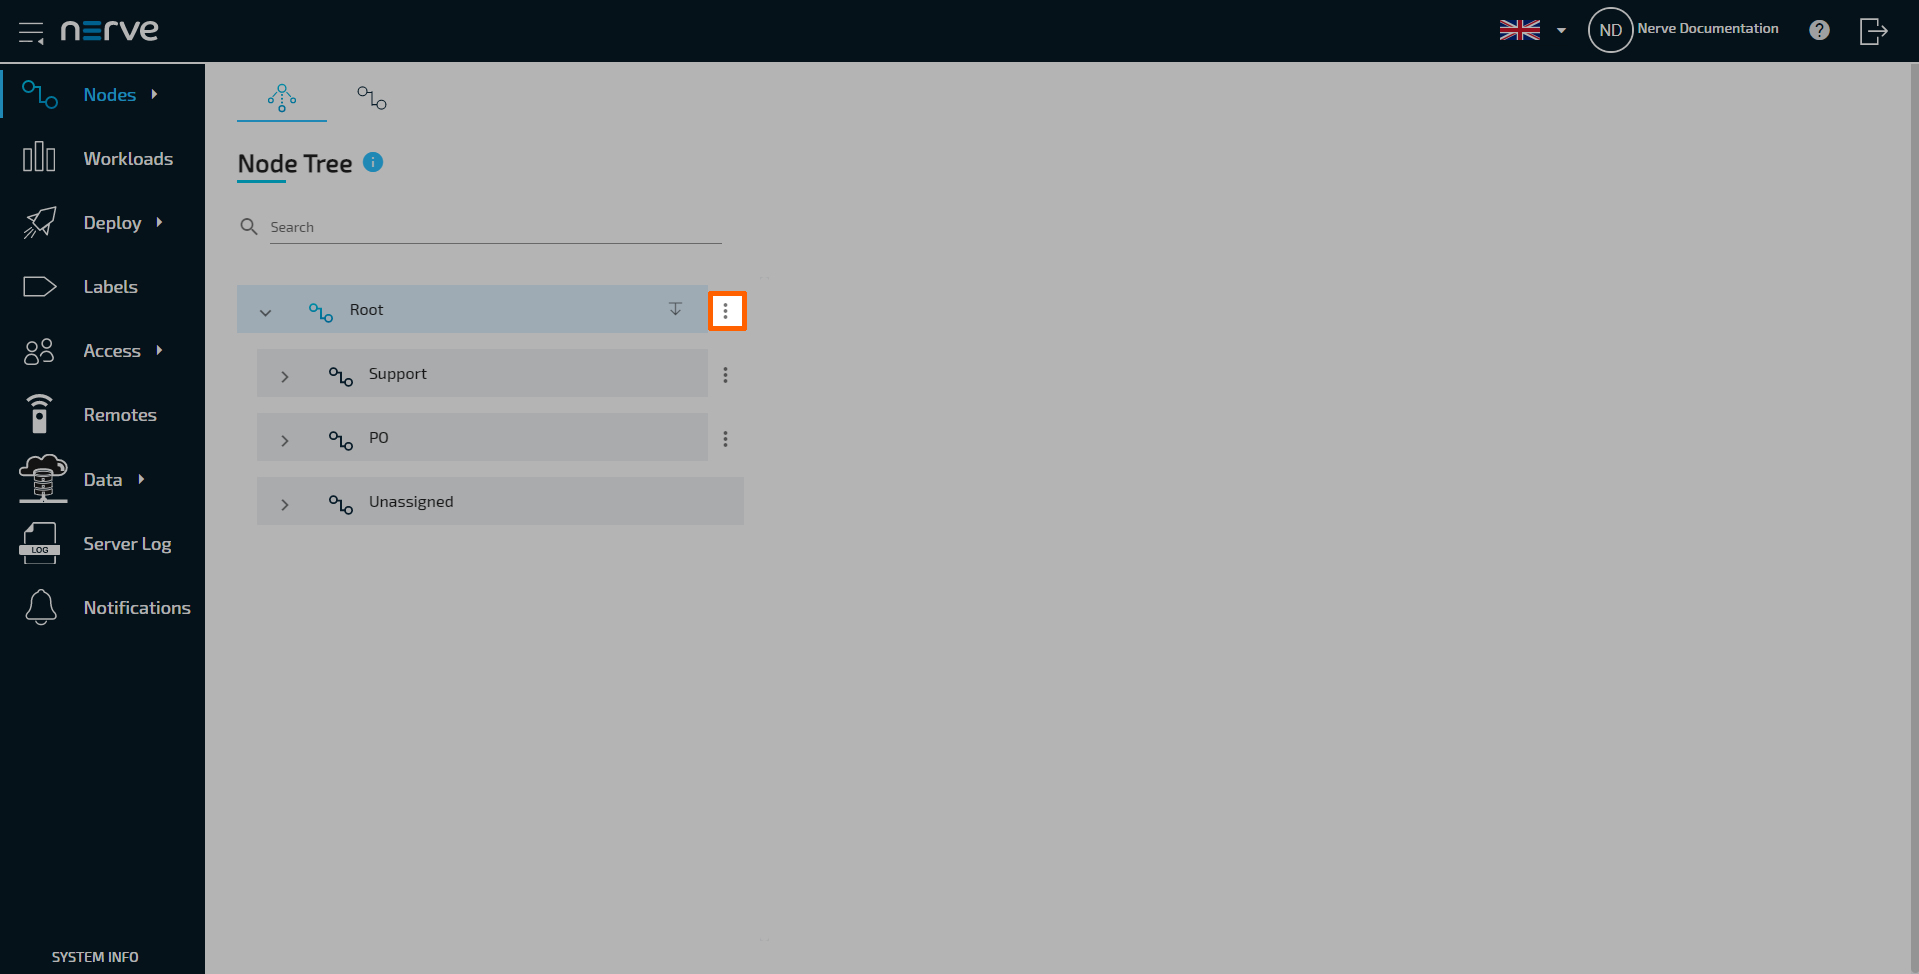
-
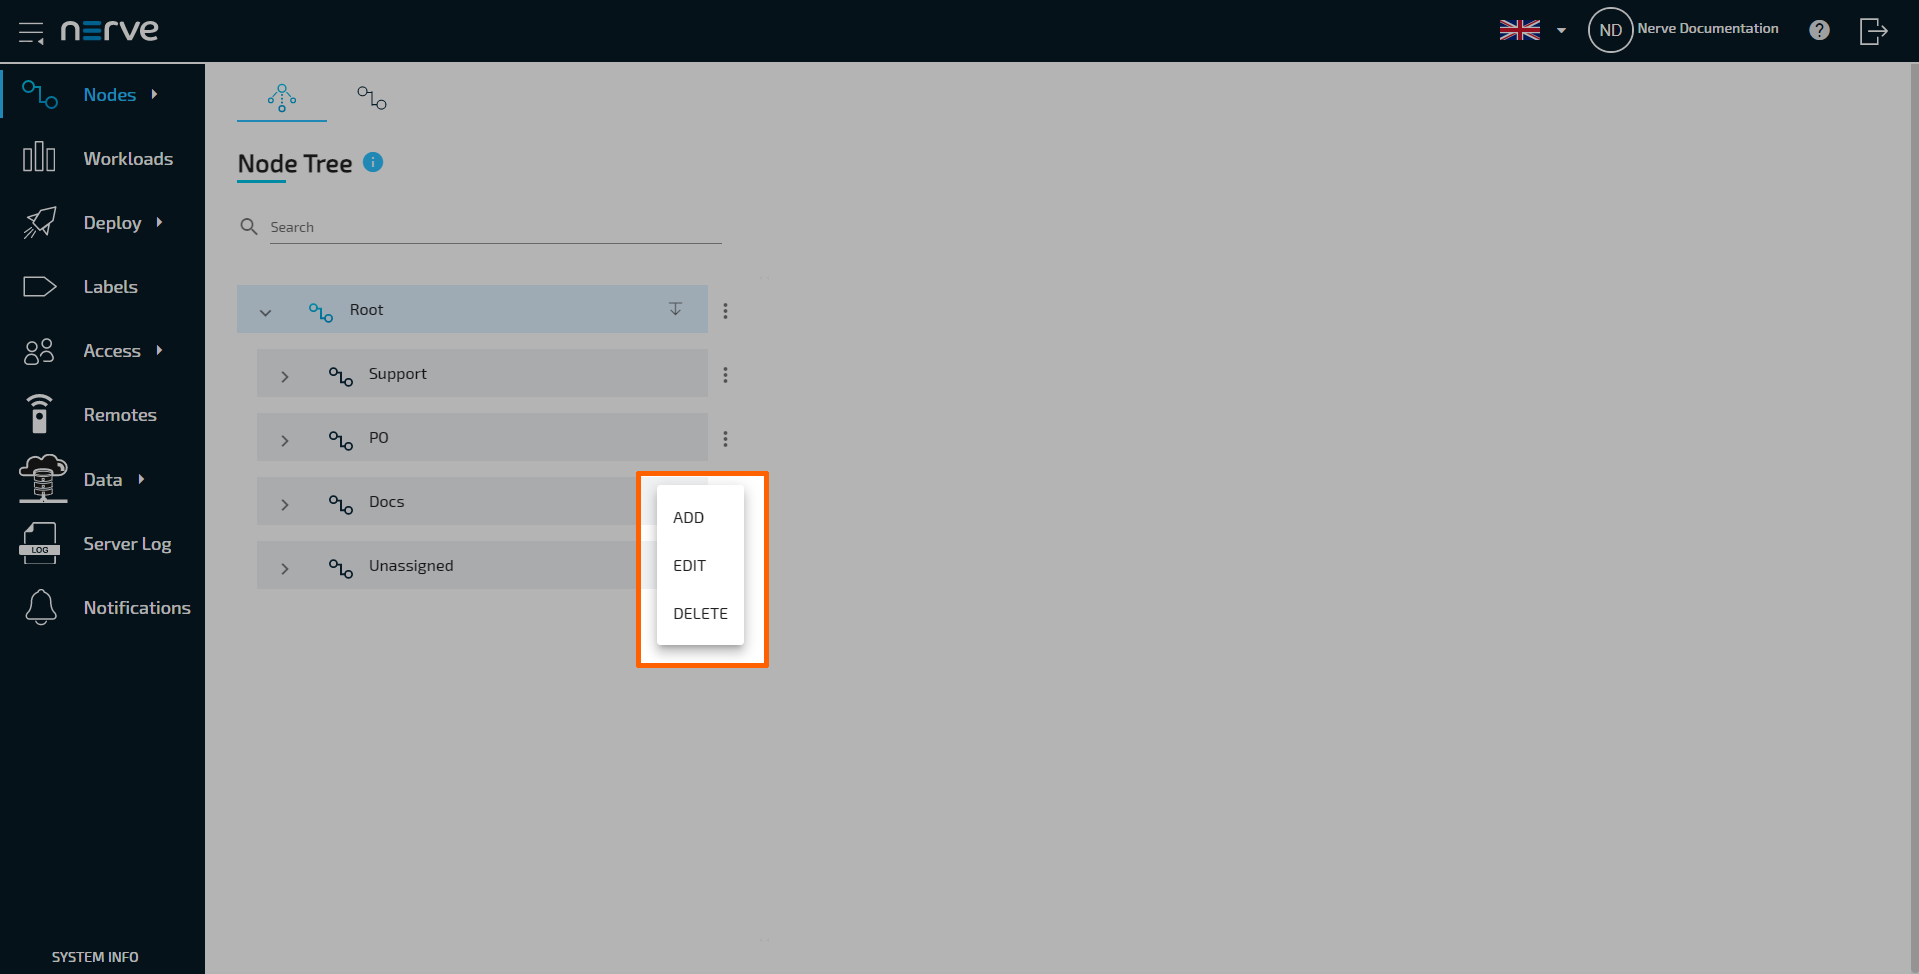
Select the ellipsis menu to the right of Root in the node tree.
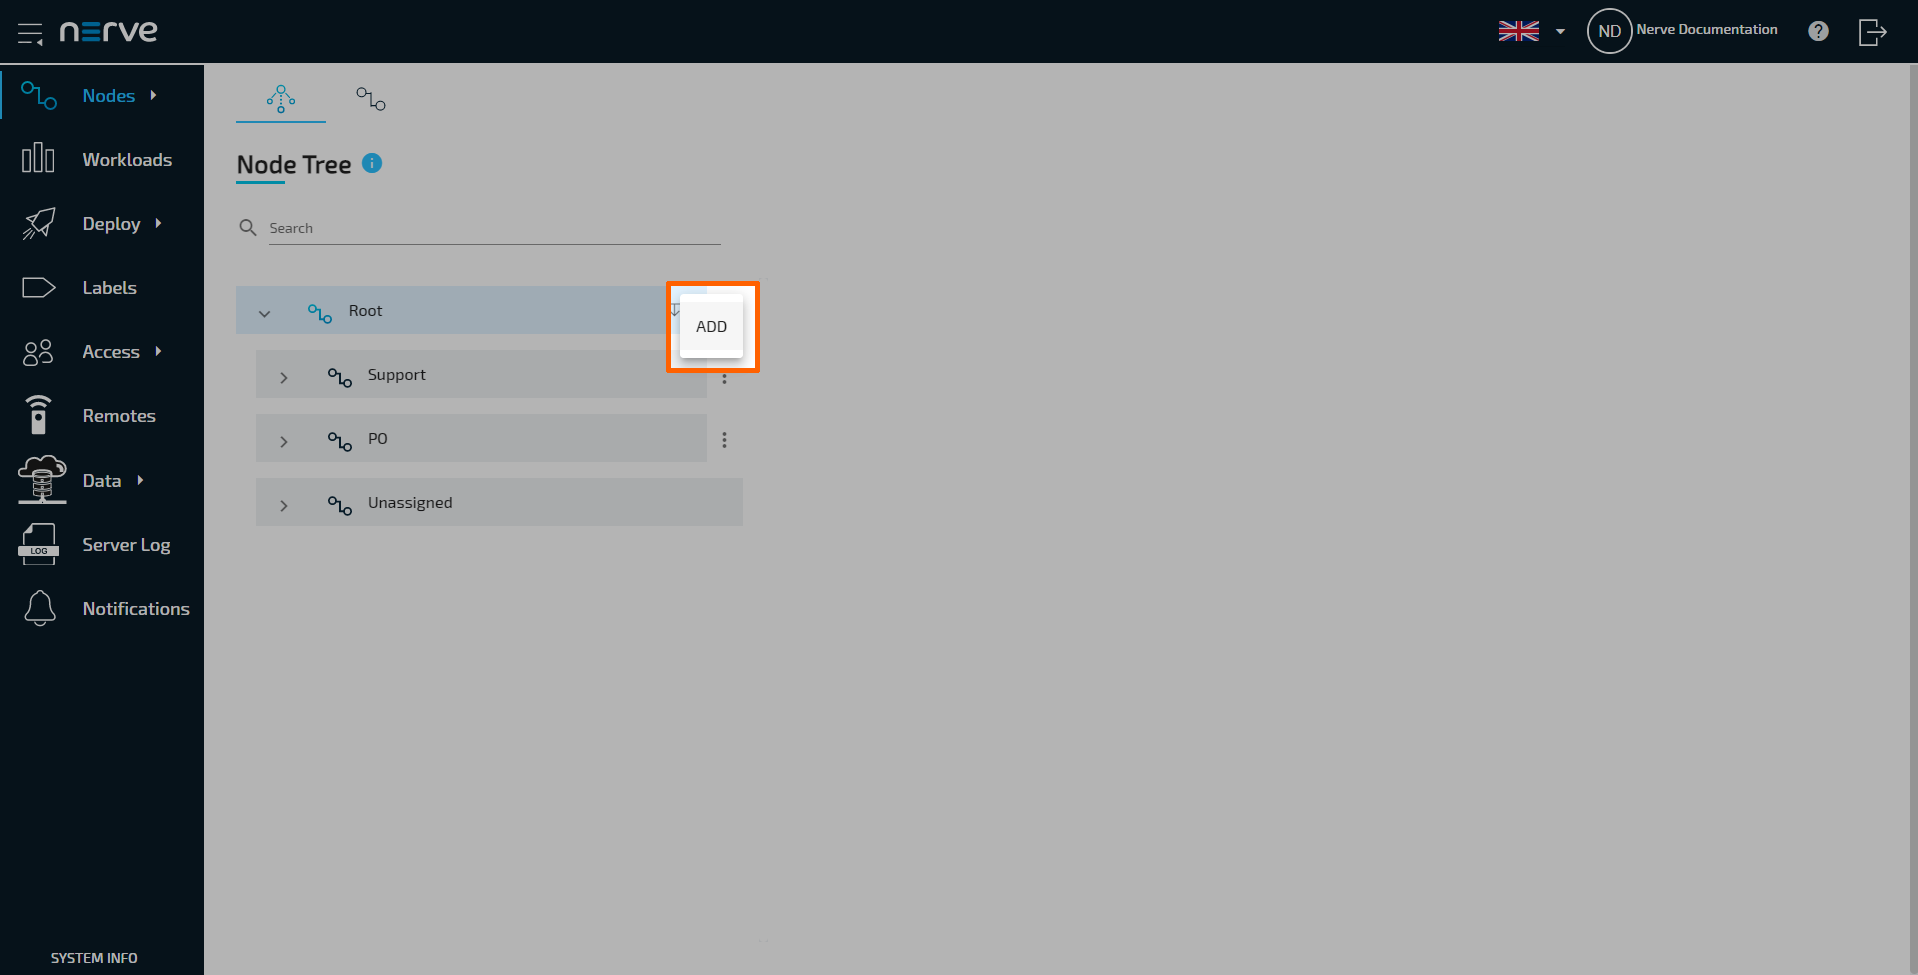
-
Select ADD in the overlay that popped up.
-
Enter the name of the new element in the field under Location.
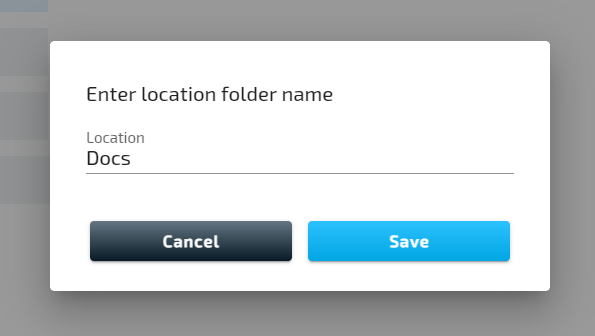
-
Select Save.
The new element now appears under the Root element.
Create more elements and freely modify the node tree. To the right of every created element, there is an ellipsis menu that opens up an overlay. Add additional elements, edit the names of elements or delete the elements here.
Note
- The order of the tree elements can be modified easily. Drag and drop an element to its new position.
- When a tree element is deleted, all of the nodes inside the element will be moved to Unassigned.
Moving a node from one tree element to another
Moving nodes in the node tree is very straightforward and intuitive and possible by drag and drop. Make sure that a new tree element is created before attempting to move a node.
- Select Nodes in the navigation on the left.
- Select the node tree tab on the right.
-
Expand the tree element of the node that will be moved. The default element is Root > Unassigned.
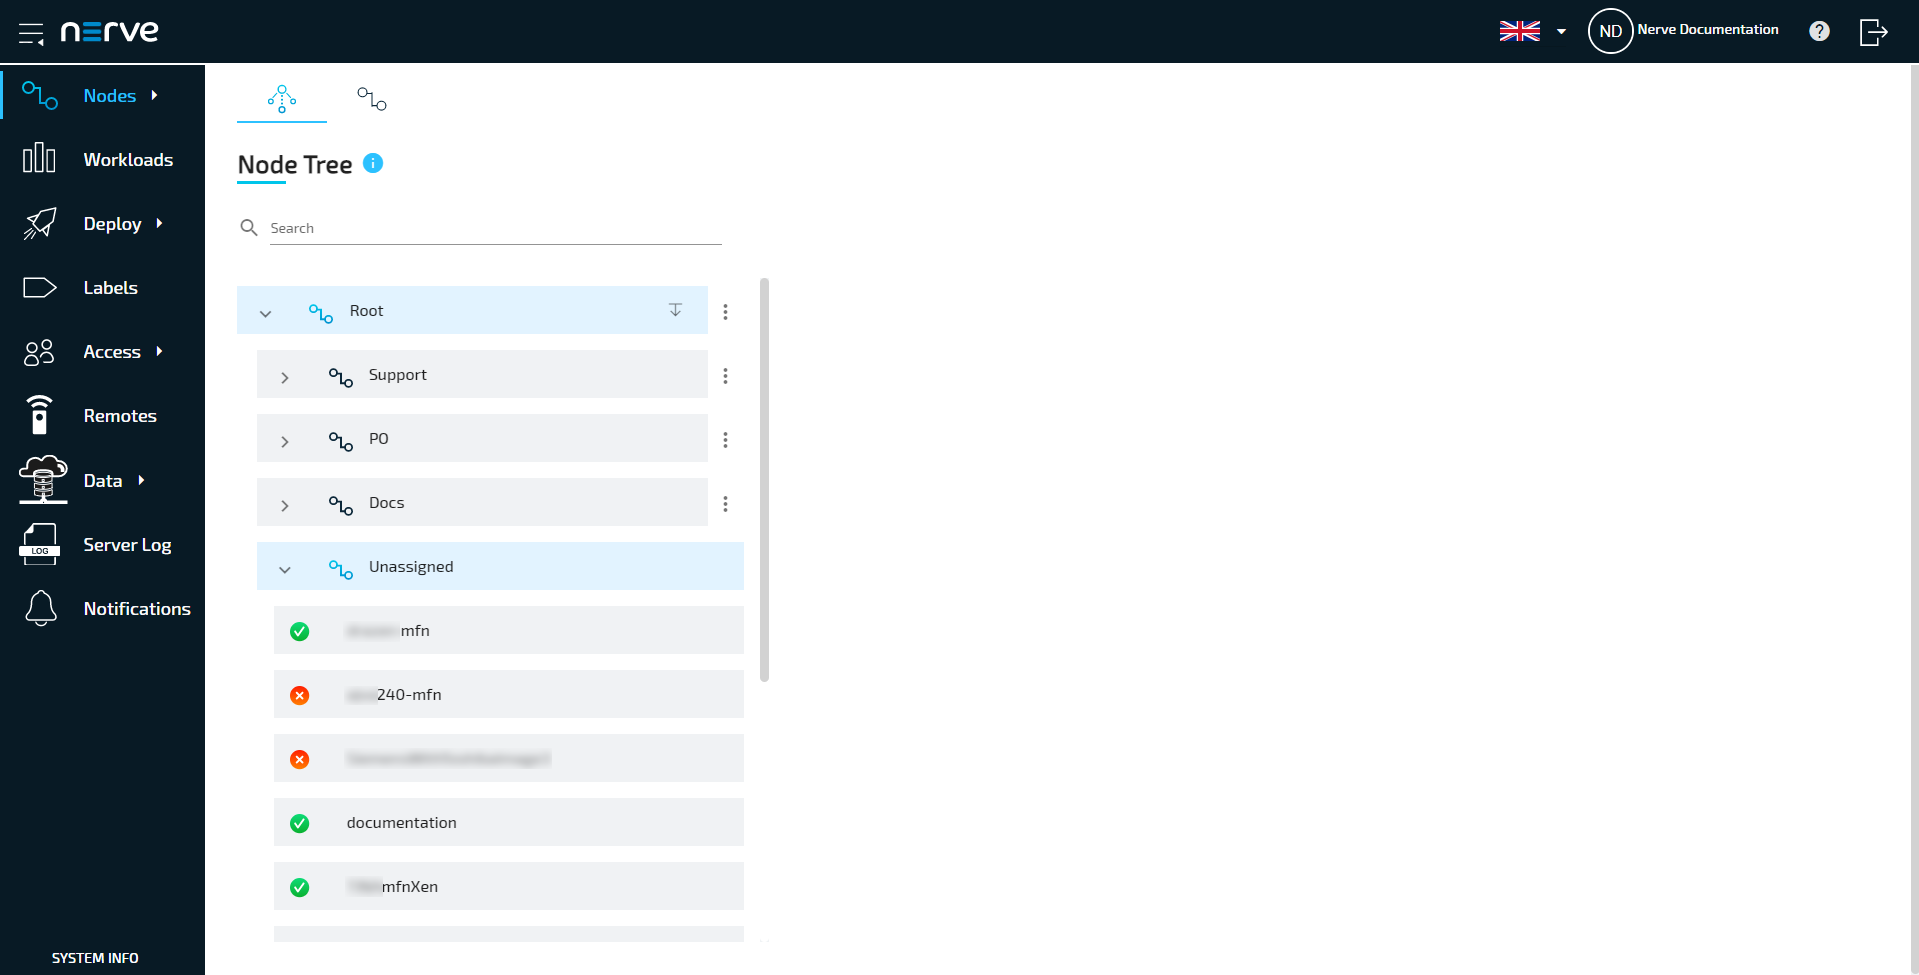
-
Choose the node to move.
-
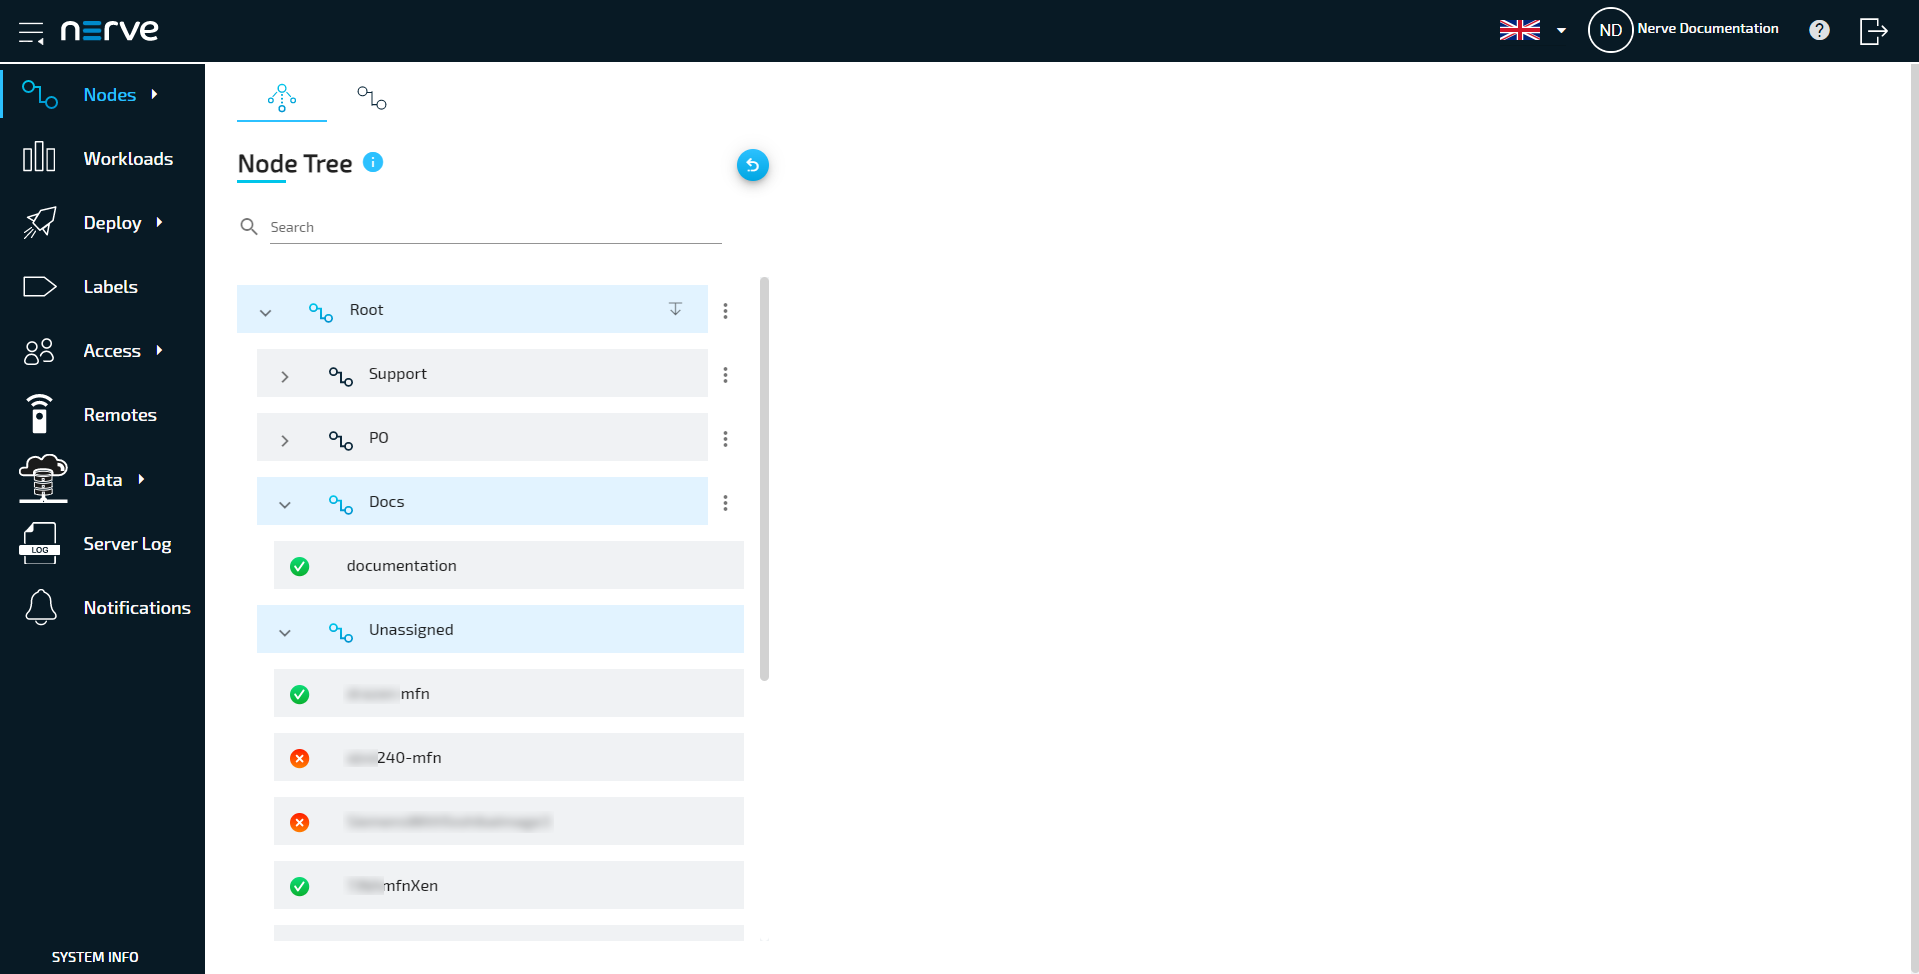
Drag and drop the node to the newly created element. Elements expand automatically once as they are hovered over.
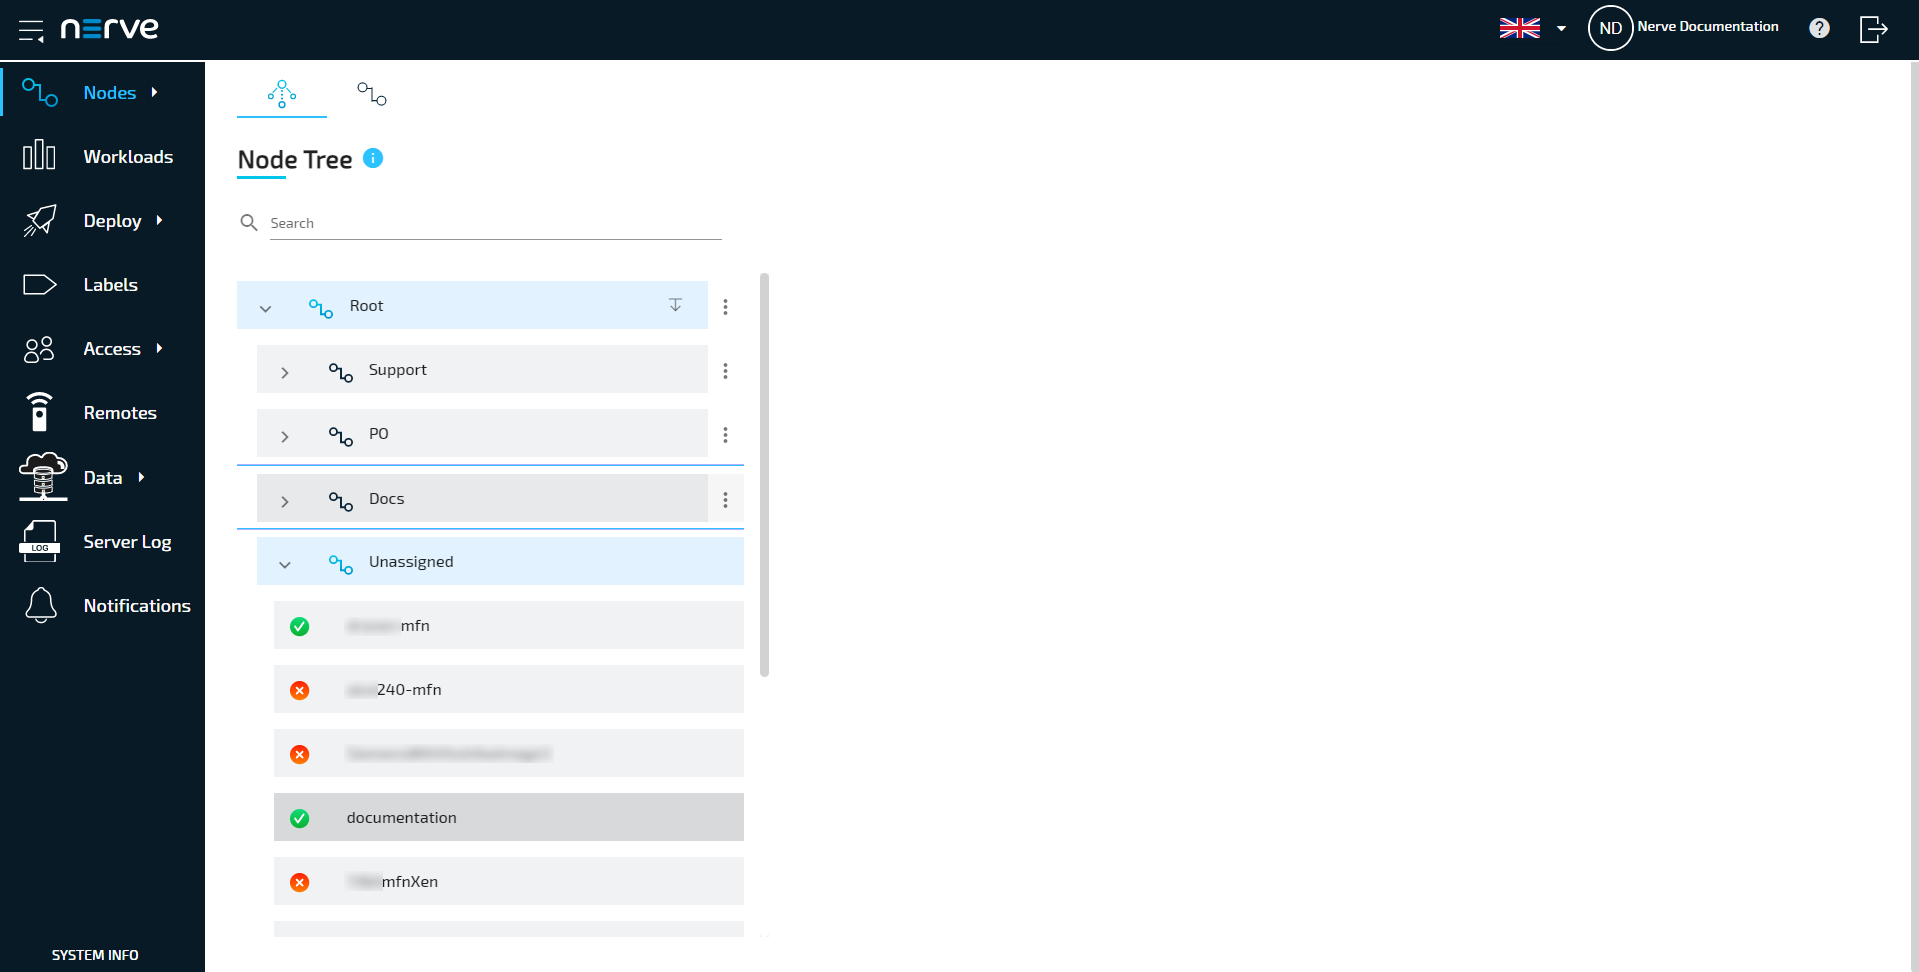
The node has now been moved to the new element.
Note
A node cannot be moved back manually to Unassigned once it has been moved to another element.
Managing nodes in the node tree
Once nodes are registered in the Management System, view their details next to the node tree. To view the details of a node, select the node tree element. Each node can have different tabs for different options depending on the user's permissions.
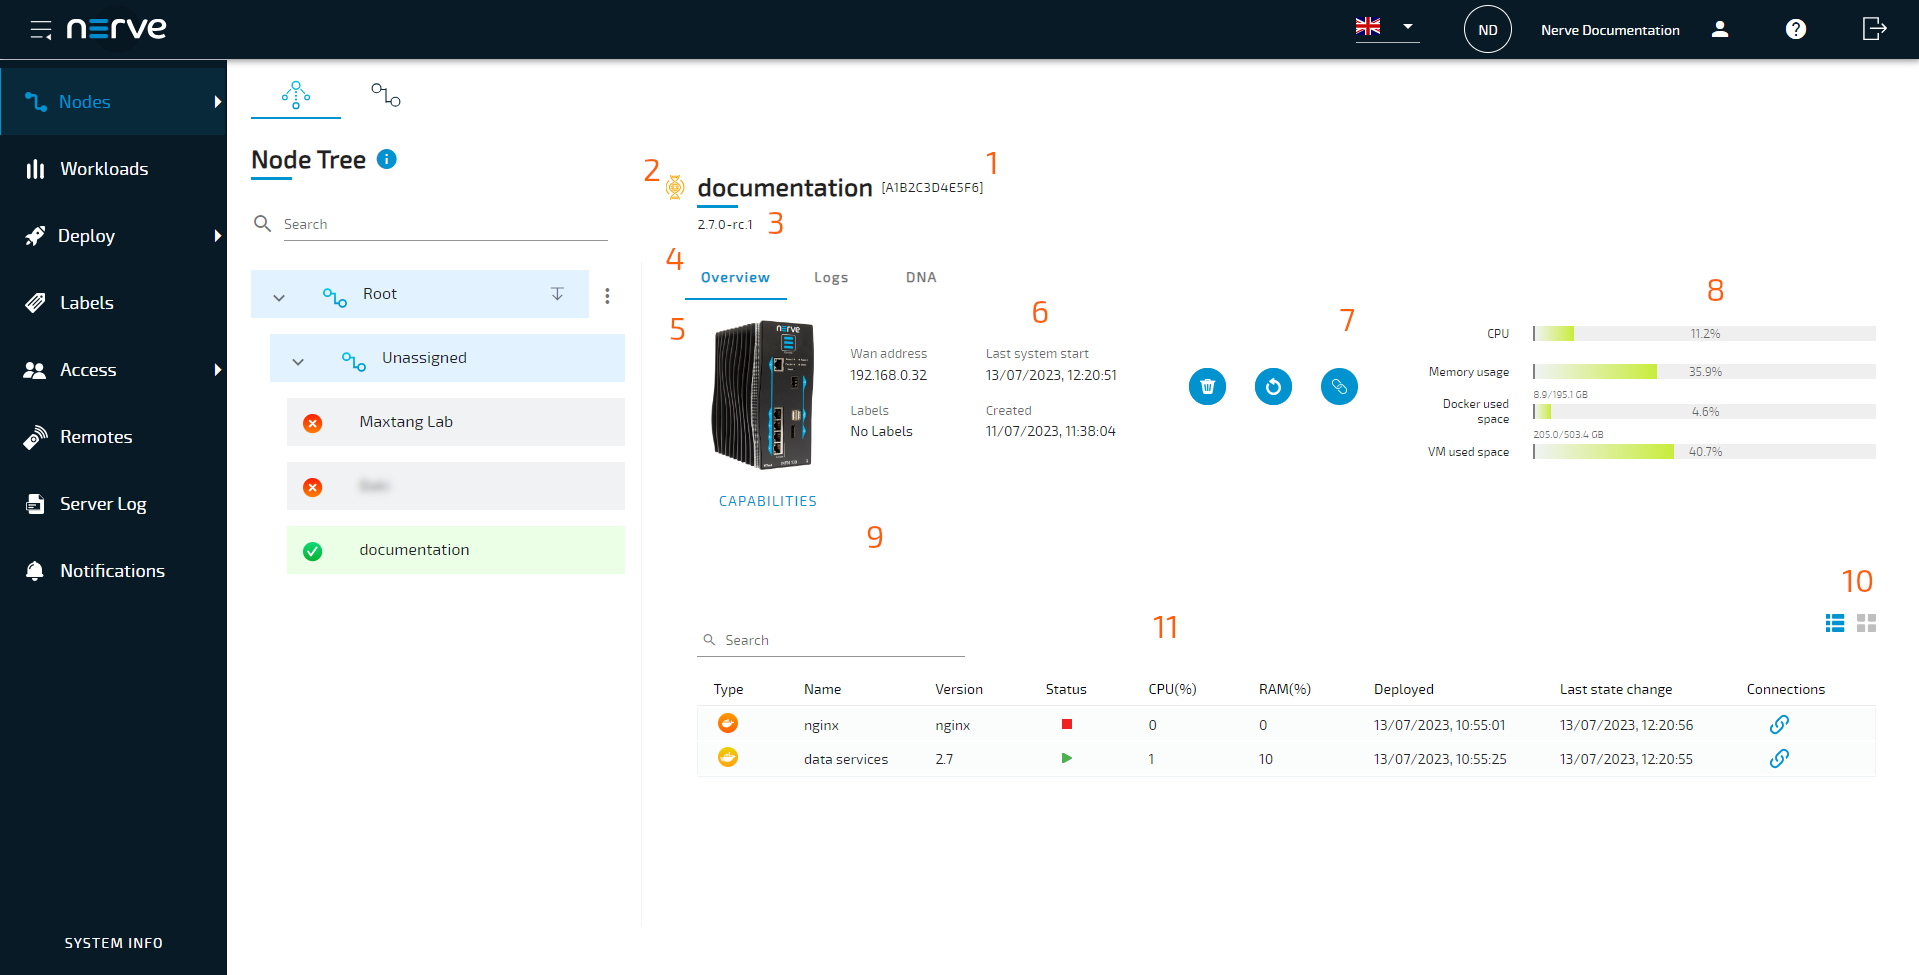
Overview tab
The overview tab is the main tab containing most of the features available. It is automatically active when a node is selected.
| Item | Description |
|---|---|
| Node name and serial (1) | Here the name and serial number of the node are shown. The serial number is next to the name in brackets. |
| State indicators (2) | DNA This  symbol shows the current DNA state of the node. It changes its color according to the state. Possible states are symbol shows the current DNA state of the node. It changes its color according to the state. Possible states are
Production mode Select this  icon to enable or disable the production mode. If the icon is displayed in green, the status is enabled. If the icon is shown in grey, the status is disabled. If the icon is shown in blue the production mode is reconfiguring. The production mode can be triggered also from the Local UI. For more information refer to Production mode icon to enable or disable the production mode. If the icon is displayed in green, the status is enabled. If the icon is shown in grey, the status is disabled. If the icon is shown in blue the production mode is reconfiguring. The production mode can be triggered also from the Local UI. For more information refer to Production mode |
| Node version (3) | The version of the node is displayed here, which is also the product version of Nerve installed on the node. |
| Tab selector (4) | Switch between different tabs to trigger different views. The tabs are:
|
| Device image (5) | An image of the hardware model is displayed here according to the device type that was selected when the node was added. |
| Node information (6) | Wan address This is the network address of the node that has been assigned by the DHCP server. Created This is the date when the node was added to the Management System in the format DD/MM/YYYY, hh:mm:ss.Last system start This is the timestamp of the last node restart in the format DD/MM/YYYY, hh:mm:ss.Labels Labels that are assigned to this node are listed here. Labels can be set in the Management System. Refer to Labels for more information. |
| Rebooting, deleting and remote connections (7) | Reboot node Selecting the reboot icon will reboot the node after a confirmation dialog. Select Yes to initiate the reboot. All running workloads will be stopped. After the reboot, the workloads will return to their previous state. Running workloads will be started. Stopped workloads will stay stopped. Delete node Selecting the garbage can icon removes the node from the Management System. The node needs to be registered again after removal. Connect Selecting the chain link icon opens an overlay, through which a remote connection to the node can be established. Refer to Remote Connections for more information. |
| System metrics (8) | The system metrics that are available in the Local UI dashboard are also visible here:
|
| Other commands (9) | CAPABILITIES The capabilities of each node are available as a list in both the Local UI and the Management System. A capability represents a specific feature or a set of features allowing the node to run workloads, to provide logs etc. |
| Workload view selection (10) | Toggle between table view and tile view for the list of workloads here. |
| Workloads overview (11) | Find workloads that have been deployed to the Nerve Device displayed here. The workloads can be displayed as tiles or as a list in a table. Table view gives the following information on workloads:
|
Logs tab
Select this tab for a way to access logging and monitoring dashboards in OpenSearch. Note that data is not collected out of the box with the exception of system logs. Users with the Admin role need to define which logs the node collects. Tick the checkbox next to a dashboard link and select Save on the right to start collecting data.
The dashboards are split into the following categories:
| Category | Items and descriptions |
|---|---|
| System | VIEW SYSTEM LOGS Selecting this will open a new window and show the system logs of the node. The internal node logs are aimed at Nerve service technicians in case of error and failure. Data is stored and visualized with OpenSearch. The amount of logs can be modified through system log settings by Nerve service technicians. Contact customer support for more information. VIEW SYSTEM METRICS Select this to view the node's resource utilization as a whole. |
| Docker | DOCKER WORKLOAD LOGGING Select this to view application logs sent from Docker workloads on the node to the Management System. DOCKER WORKLOAD MONITORING Select this to view gathered metadata about installed Docker containers, as well as the monitoring of their resource utilization. |
| Node Activity | Select the download button here to download the activity logs for all currently deployed workloads on the node at once. The downloaded file is in the CSV format and has a limit of 10.000 characters. Select the outgoing link button to access an OpenSearch dashboard displaying audit logs filtered to that specific node. |
For more detailed information, refer to Logging and monitoring.
DNA tab
The DNA tab contains a way to operate Nerve DNA on a node through the Management System UI. Refer to Nerve DNA UI in the Management System for more information on the content of the DNA tab. Also, refer to Nerve DNA for more information on Nerve DNA in general.
Volumes tab
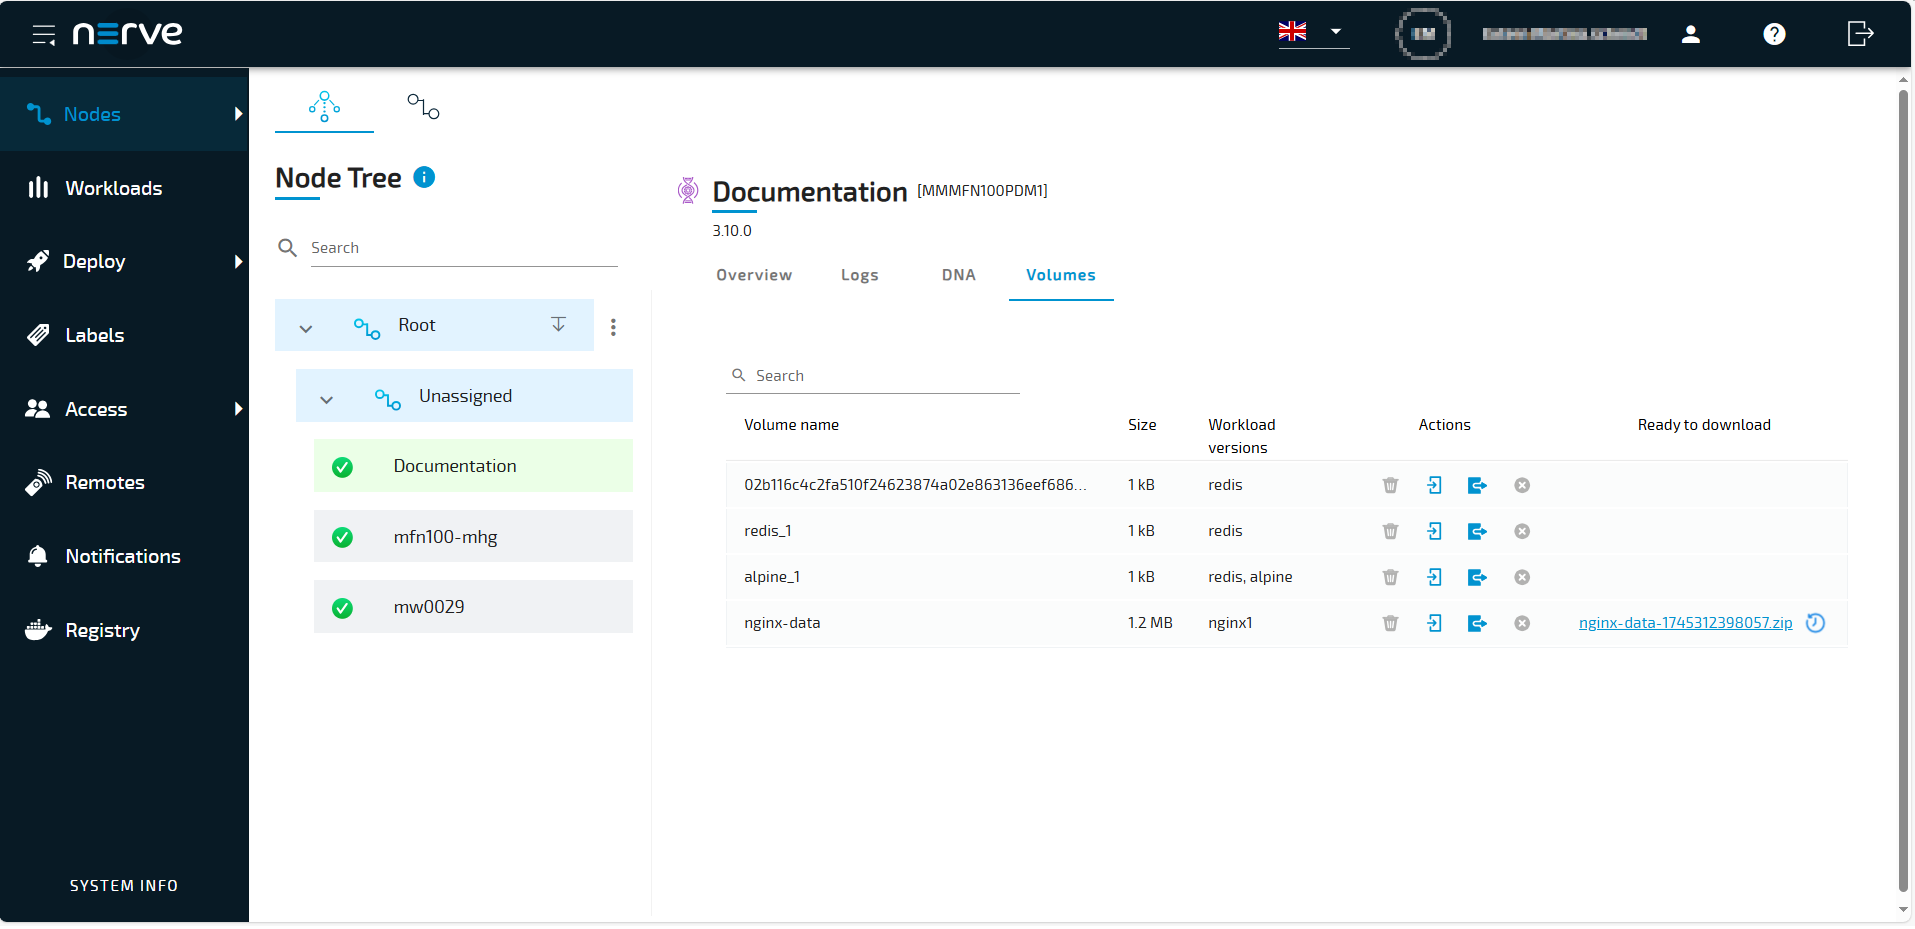 The Volumes tab provides a list of all available Docker volumes on the node.
The definition of the Docker volumes takes place during the provisioning of a Docker workload (for more information refer to Provisioning a Docker workload).
The Volumes tab provides a list of all available Docker volumes on the node.
The definition of the Docker volumes takes place during the provisioning of a Docker workload (for more information refer to Provisioning a Docker workload).
The list contains the following information:
- Volume name given during provisioning the Docker workload,
- The memory Size of the Docker volume.
- The Workload version to which the Docker volume is assigned to.
The following table gives you an overview which actions you can perform for a docker volume.
| Actions | Items and Description |
|---|---|
| Delete | Select the garbage can icon Note that you cannot delete Docker volumes from the node, when they are assigned to a Docker workload version. This is indicated by a gray garbage can icon |
| Import | To import data to a Docker volume, proceed as follows:
|
| Export | To export data from a Docker volume, proceed as follows:
|
| Cancel | Select the cancel icon  , to cancel the import or export. Note that this function is only available during an import or export. , to cancel the import or export. Note that this function is only available during an import or export. |
Node capabilities
The capabilities of each node are available as a list in both the Local UI and the Management System. A capability represents a specific feature or a set of features allowing the node to run workloads, to provide logs etc. As of now, most nodes share the same list of capabilities. In the future, with increasing modularity in the Nerve solution, the list will differ based on the specific Nerve solution running on the node.
Reach the list of node capabilities in the following locations:
| Location | Path |
|---|---|
| Local UI | Log in to the Local UI. > Select Node configuration in the navigation on the left. > Select Capabilities. |
| Management System | Log in to the Management System > Select a node from the node tree. > Select CAPABILITIES. |
Here is a list of all currently available capabilities:
| Capability | Description |
|---|---|
| CODESYS PLC | The CODESYS application is installed and the execution of CODESYS workloads is possible. |
| Docker Container | Docker container technology is included and the node can run Docker workloads. |
| Docker Compose | Docker Compose technology is included and the node can manage multiple Docker containers under one Docker Compose workload. |
| Logging via FluentBit | A daemon is running on the node that sends logs and metrics to the Management System. |
| Virtualization via ACRN | The node is running on the ACRN hypervisor. |
| Virtualization via KVM | The node is running on the KVM hypervisor. |
| Virtualization via XEN | The node is running on the XEN hypervisor. |
Node list
The topics covered in this chapter are mainly means of organization and have no impact on the functionality of the nodes and their workloads. Select Nodes in the navigation on the left. Then select the nodes tab  on the right to display the list of registered nodes.
Note
Operational functions of the nodes are located in the node details view in the node tree.
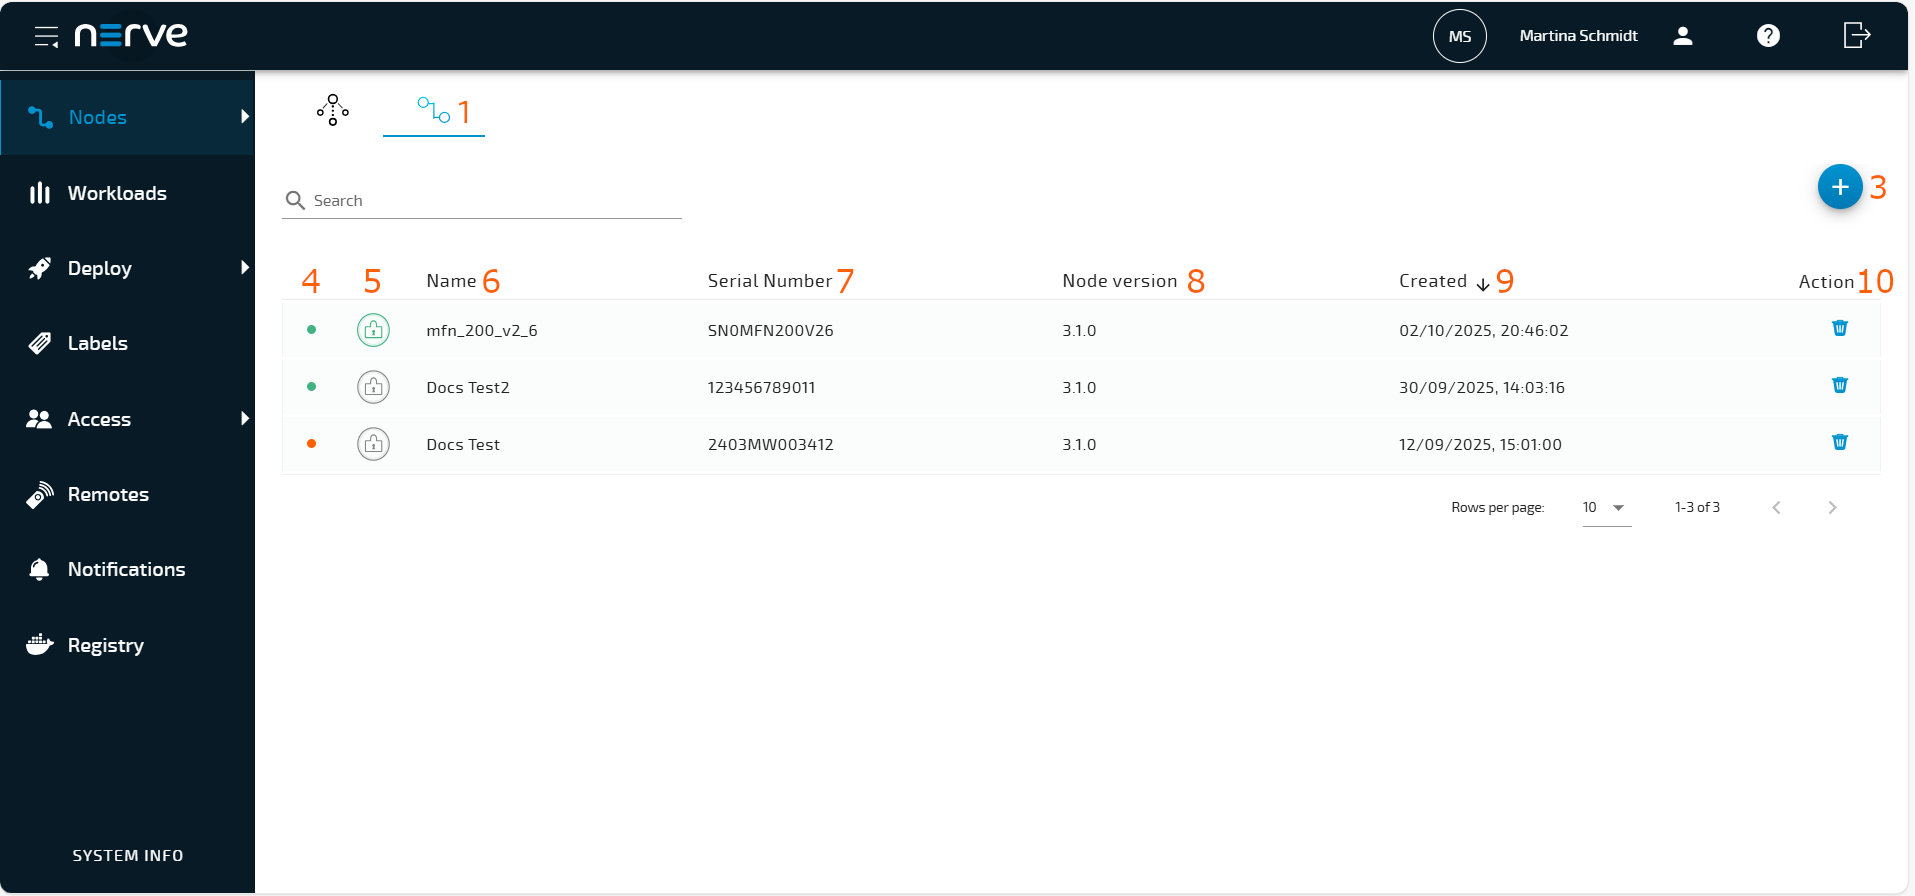
| Item | Description |
|---|---|
| Tab selection (1) | Switch between the node tree and the node list by selecting the appropriate tab. |
| Search bar (2) | Use the search bar to filter nodes by name. |
| Add new node (3) | Select the plus symbol to add a new node. |
| Node Status (4) | If a node is online or offline can be seen on the left of the list. Green indicates an online node while red shows an offline node. |
| Secure Boot (5) | The status of the secure boot and disk encryption. The color of the icon indicates the status. |
| Name (6) | This is the name of the node. The sorting of the list can also be switched from alphabetical to reverse alphabetical by selecting Name, as well as being sorted by creation date by selecting Created. |
| Serial Number (7) | This is the serial number of the node that was defined during node configuration. |
| Node version(8) | This is the version of the node reflecting the version of the Nerve software. |
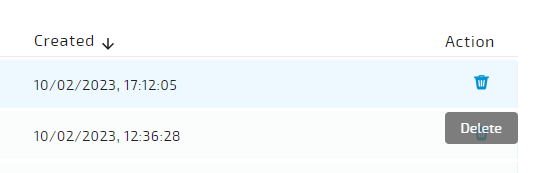
| Created (9) | This is the date the node was registered in the Management System in the format DD/MM/YYYY, hh:mm:ss. The list can be sorted by creation date when selecting Created. |
| Action (10) | This column contains icons representing actions. Selecting the Delete symbol here deletes the node, removing it from the Management System. |
Adding a node
Nodes can only be added to the Management System if they have been configured in the Local UI, as the serial number and secure ID of the node are required. Refer to Node configuration before continuing.
- Select Nodes in the menu on the left side.
- Select the nodes tab on the right to display the list of registered nodes.
-
Select the plus symbol
 (Add new node) in the upper-right corner.
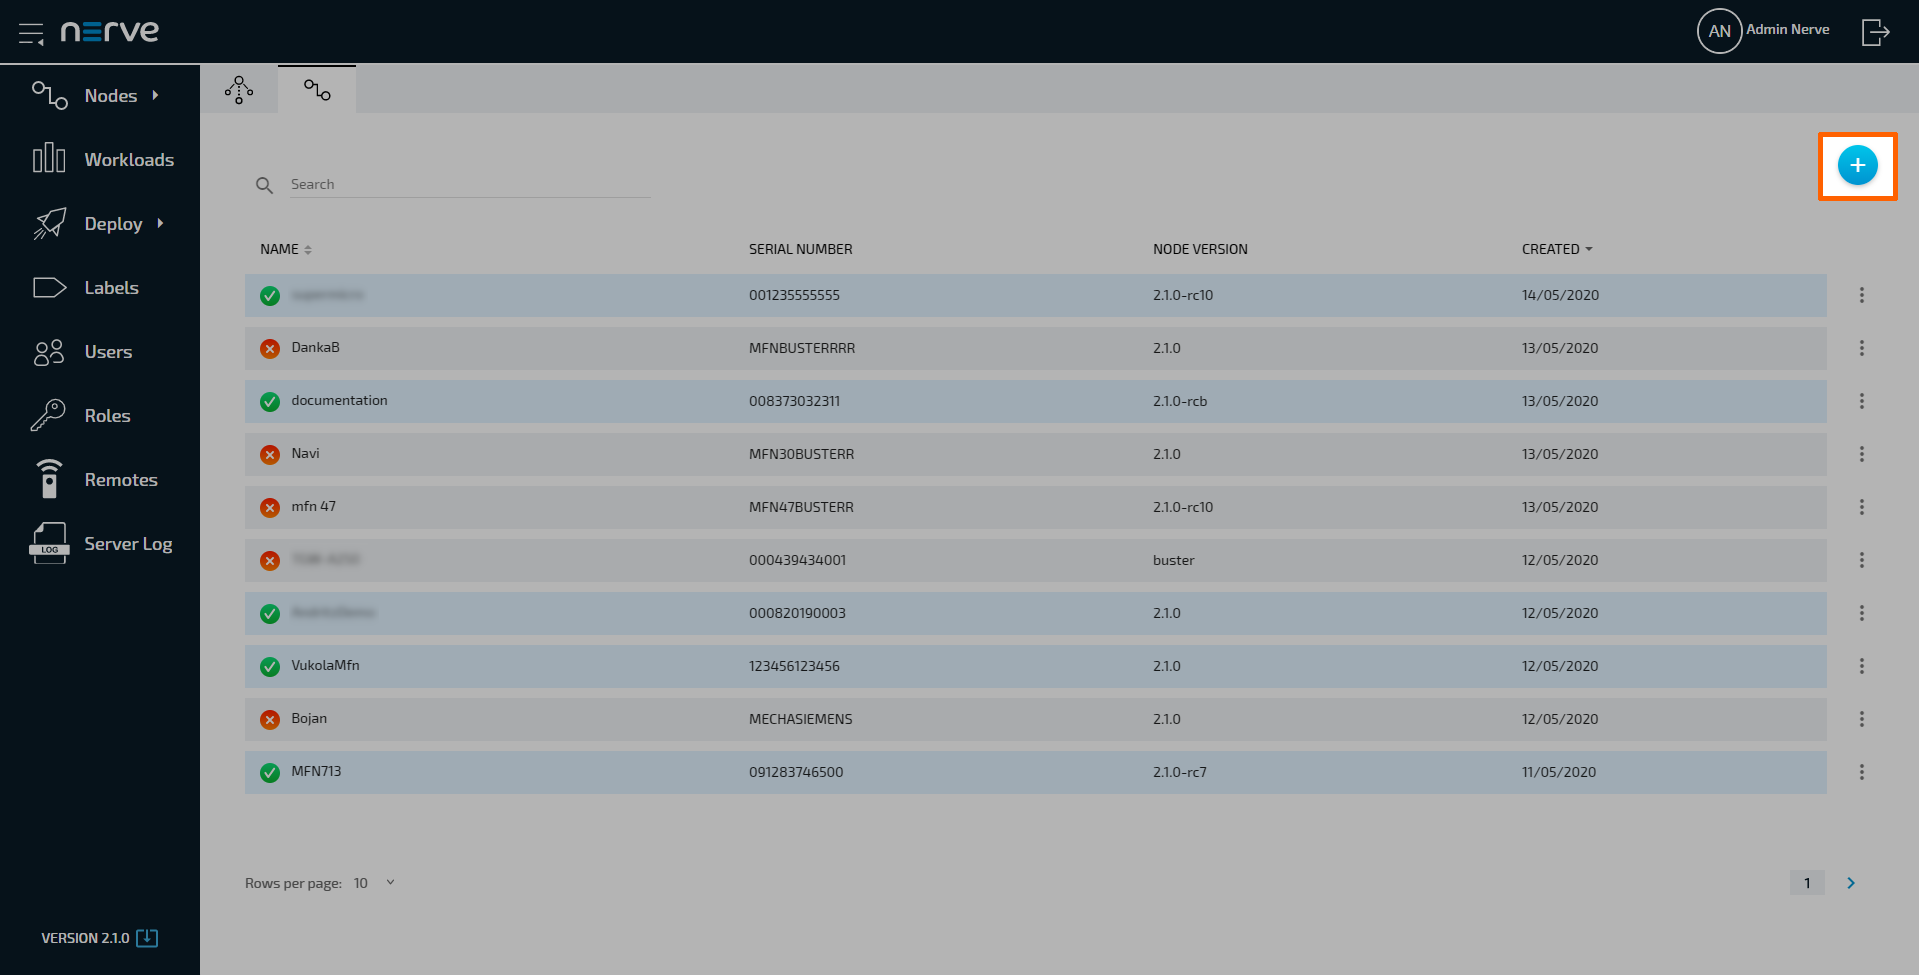
-
Enter the following information:
Item Description Name Enter the name for the node that will make it easy to identify. Secure ID Enter the secure ID that is generated when the node is configured in the Local UI. Refer to Node configuration for more information. Serial Number Enter the serial number of the Nerve Device that was defined during node configuration. Insert Label This field is optional. Add labels to the node for easier identification and workload deployment. Note that labels have to be created first before they can be assigned to nodes. Refer to Labels for more information. REMOTE CONNECTIONS This setting is optional at this point. Remote connections can be configured at any time.
Select Add Remote Screen or Add Remote Tunnel to configure a remote connection to the node.
Refer to Remote connections for more information and instructions for all remote connection types.
Note
The Nerve Device Name is recognized automatically, so the corresponding field is filled out with the value received from the node. Ensure that the added device for the node is qualified for the Management System. For more information refer to the Device Guide.
-
Select Save to save the changes.
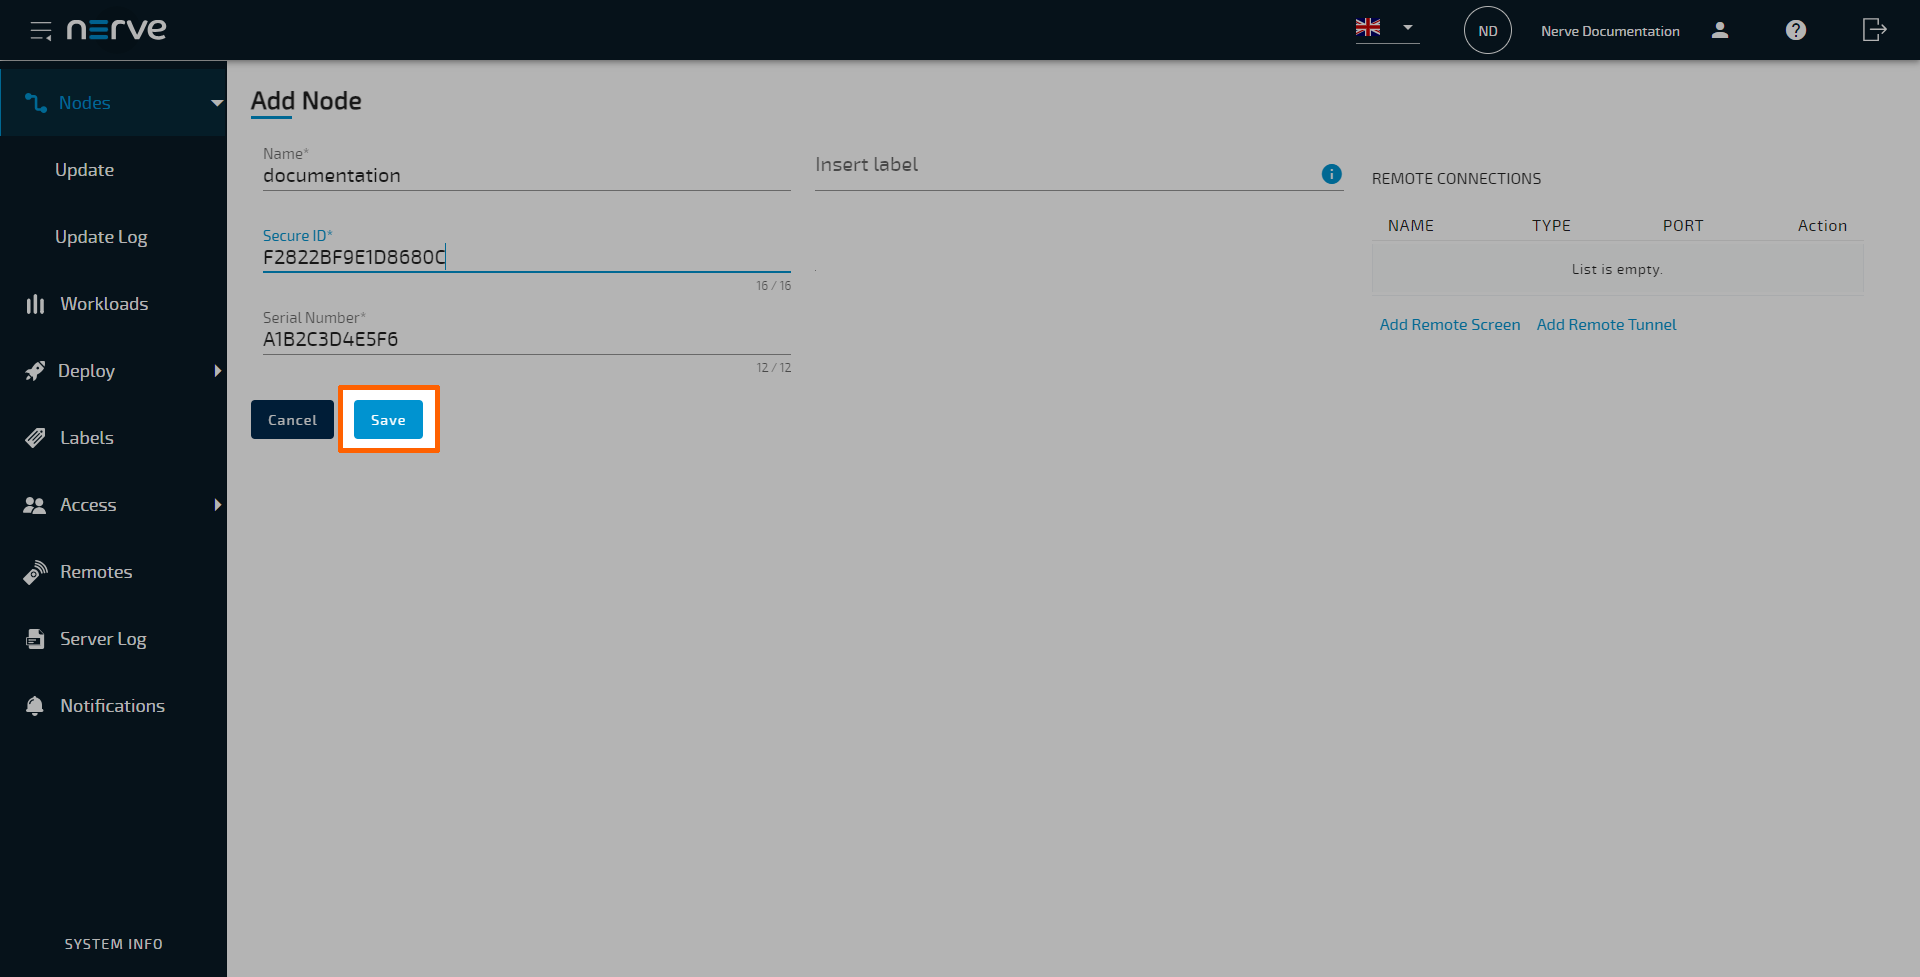
The node now appears in the node list and in Root > Unassigned in the node tree and can be worked with. At first, the node is marked as offline. It can take up to a minute until the node is shown as online in the Management System. The Management System refreshes automatically.
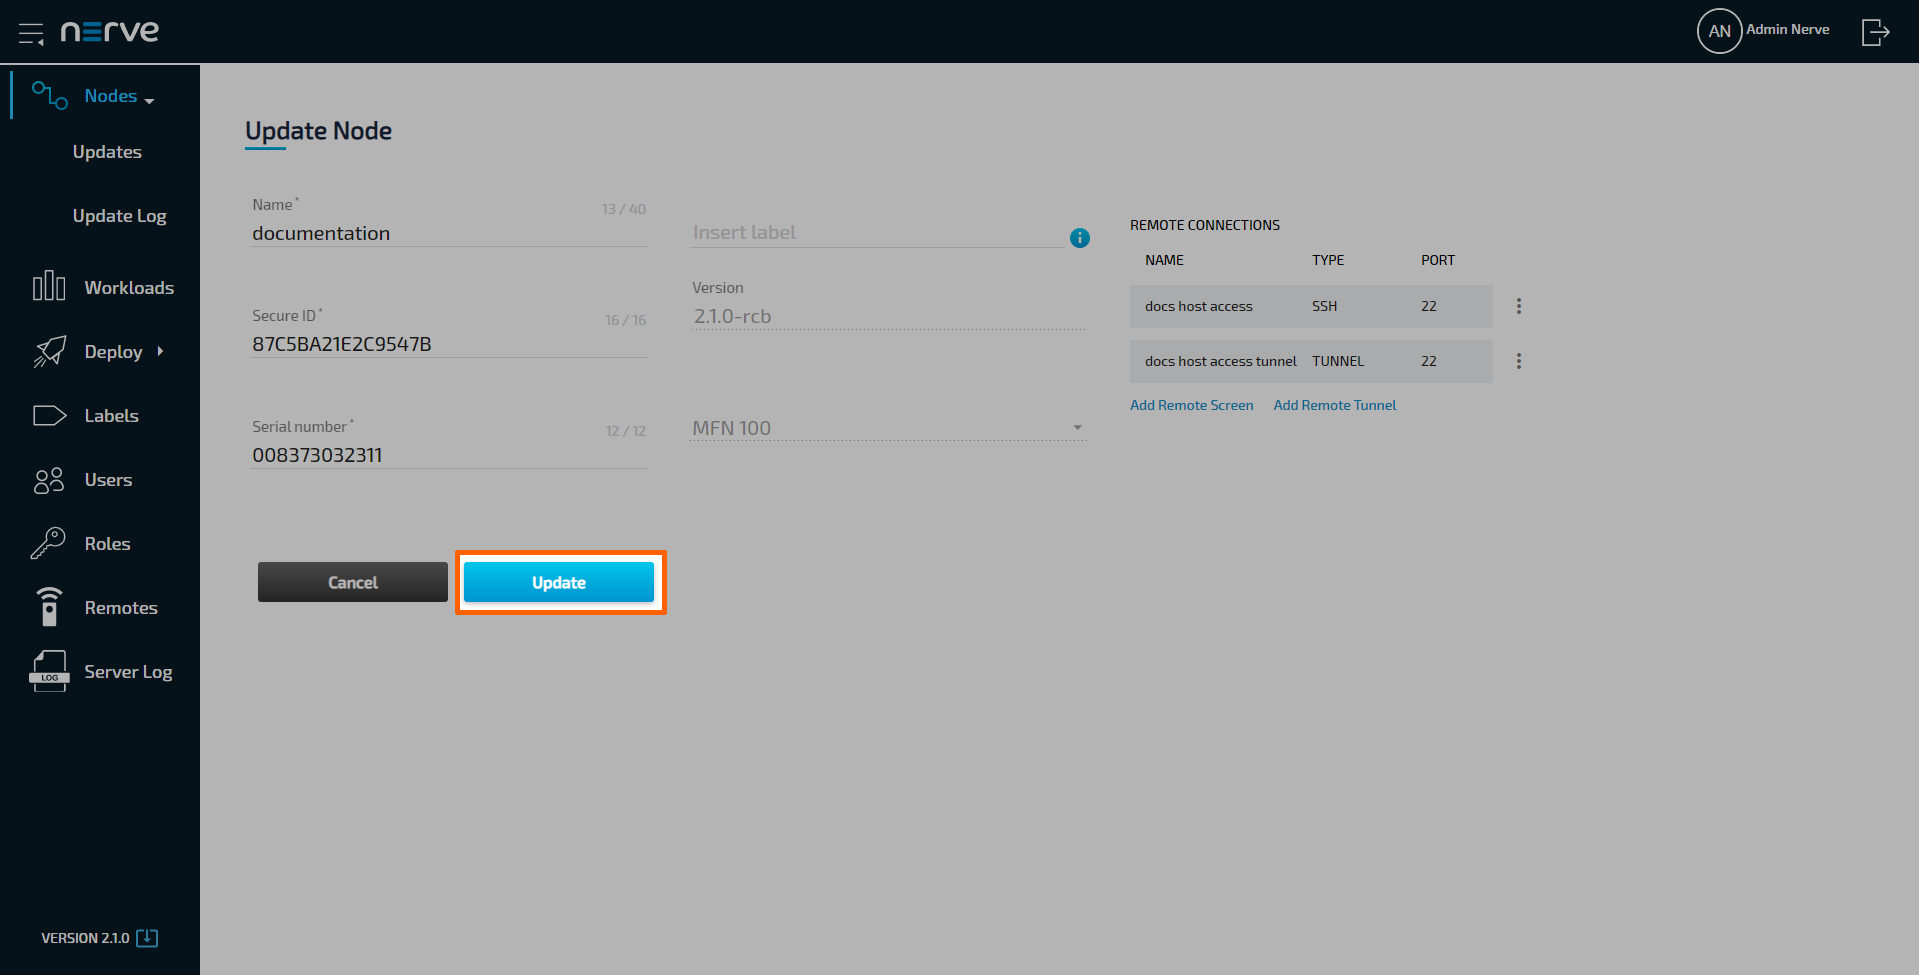
Editing the details of nodes
After registering a node, edit its details in the Nodes menu. Use the search bar at the top to search for nodes if a large number of nodes is registered.
- Select Nodes in the navigation on the left.
- Select the nodes tab on the right to display the list of registered nodes.
- Select a node from the list.
-
Edit the details of the node:
Item Description Name Enter the name of the node. Secure ID This is the ID generated during the node registration process. Do not edit this ID without a valid reason. Serial Number This is the serial number of the node. Do not edit the serial number without a valid reason. Timezone This is the time zone of the node. This setting cannot be edited here. The time zone setting is set in the Local UI. Refer to Node configuration for more information. Insert label This field is optional. Add labels to the node for easier identification and workload deployment. Refer to Labels for more information. Version This is the node version. This field cannot be edited. Device type This is the device the node is hosted on. This field cannot be edited. REMOTE CONNECTIONS This is a list of remote connections to the node stating the NAME, TYPE, and PORT of available remote connections. Add or delete remote connections here. Refer to Remote Connections for more information. Note
Changing the Secure ID or Serial Number of a node will break the connection between the node and the Management System.
-
Select Update to save the changes.
Updating a node to a new version
Nodes are updated through the Management System where currently available updates are listed. Note that nodes can only be updated in order, meaning that node versions cannot be skipped. When an update is started, a snapshot of the user data is made and running workloads are stopped. Reverting to the previous version is possible. Workloads remain stopped after an update or revert.
Note
- Before updating to a newer version, make sure to back up any user created data, e.g. gateway configuration files in the Data Services.
- By updating a node, the passwords to the Local UI and host access are reset if they have not been changed by the user. Local UI and host access passwords set by the user persist through updates.
- When updating older versions of nodes, refer to the compatibility matrix in the release notes to make sure if the incremental node update is possible from the used version of the node.
- Nodes below version 2.1.0 need to be updated manually by installing an image at the Nerve Device. Refer to Manual image installation for more information.
- Expand Nodes > Updates in the navigation on the left.
-
Select a node version from the list. Available nodes for the update to the selected version will appear on the right.
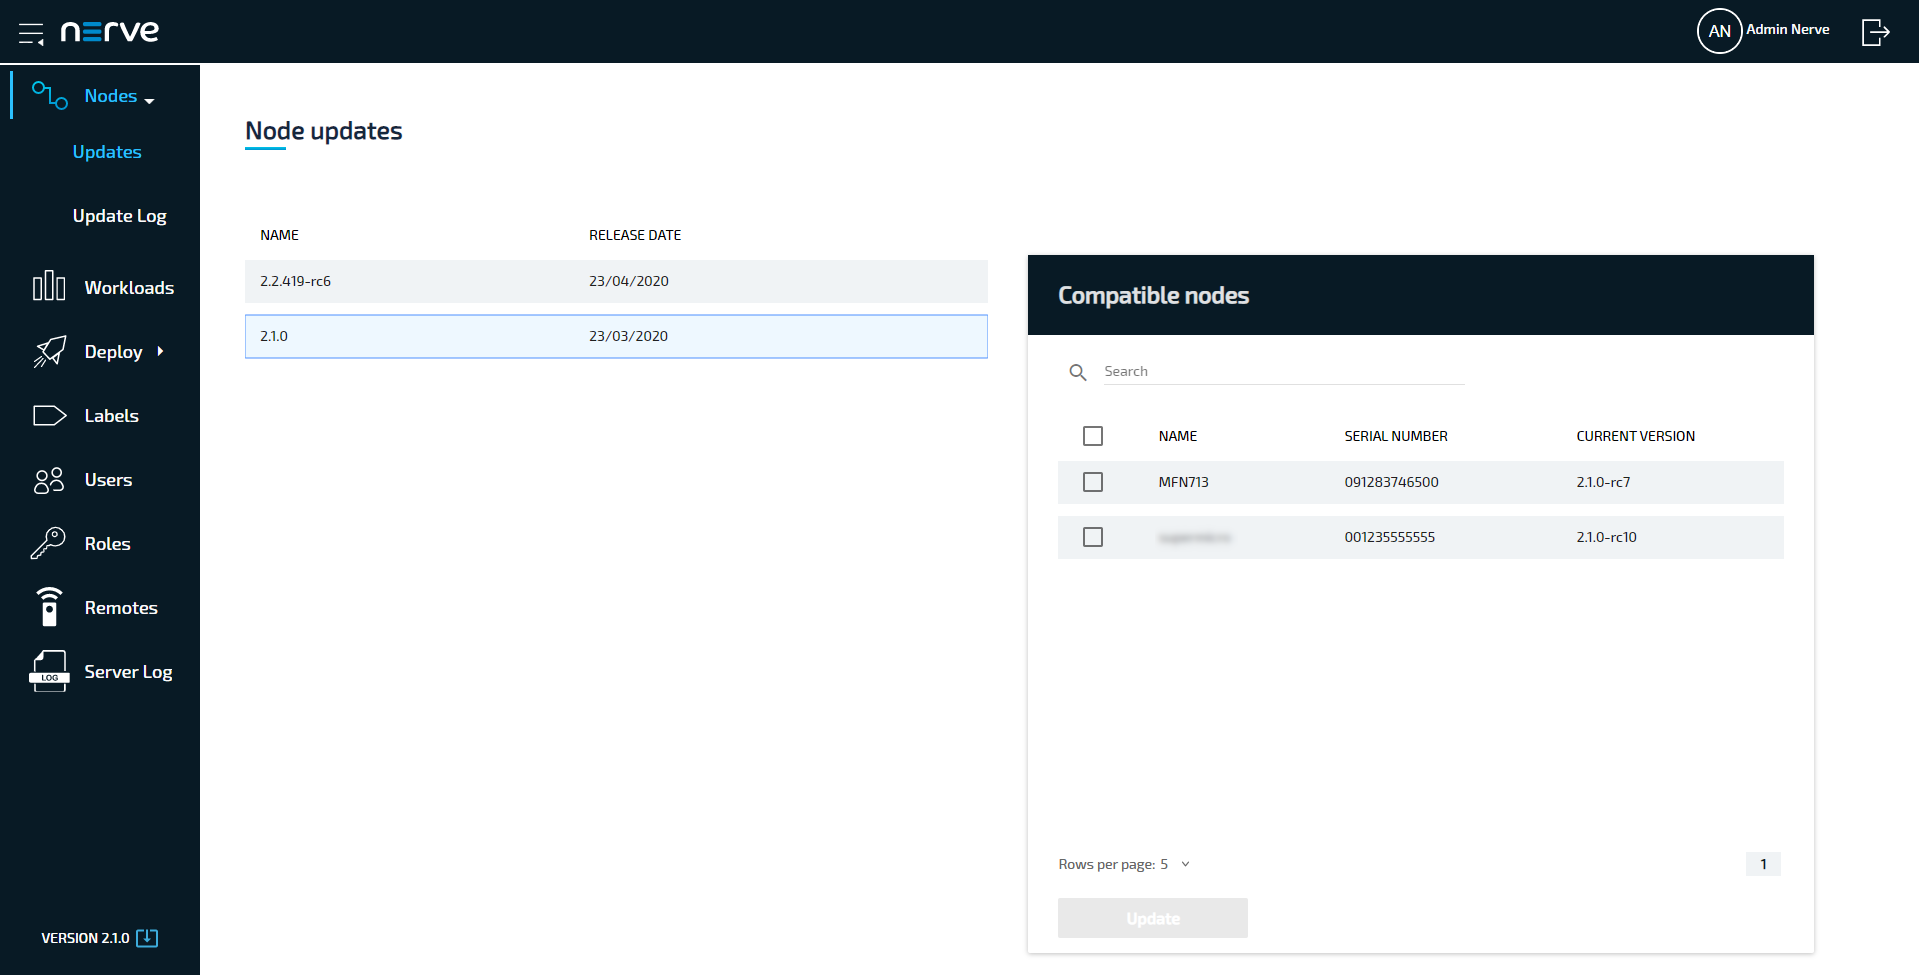
-
Tick the checkboxes next to the nodes that will be updated.
-
Select Update.
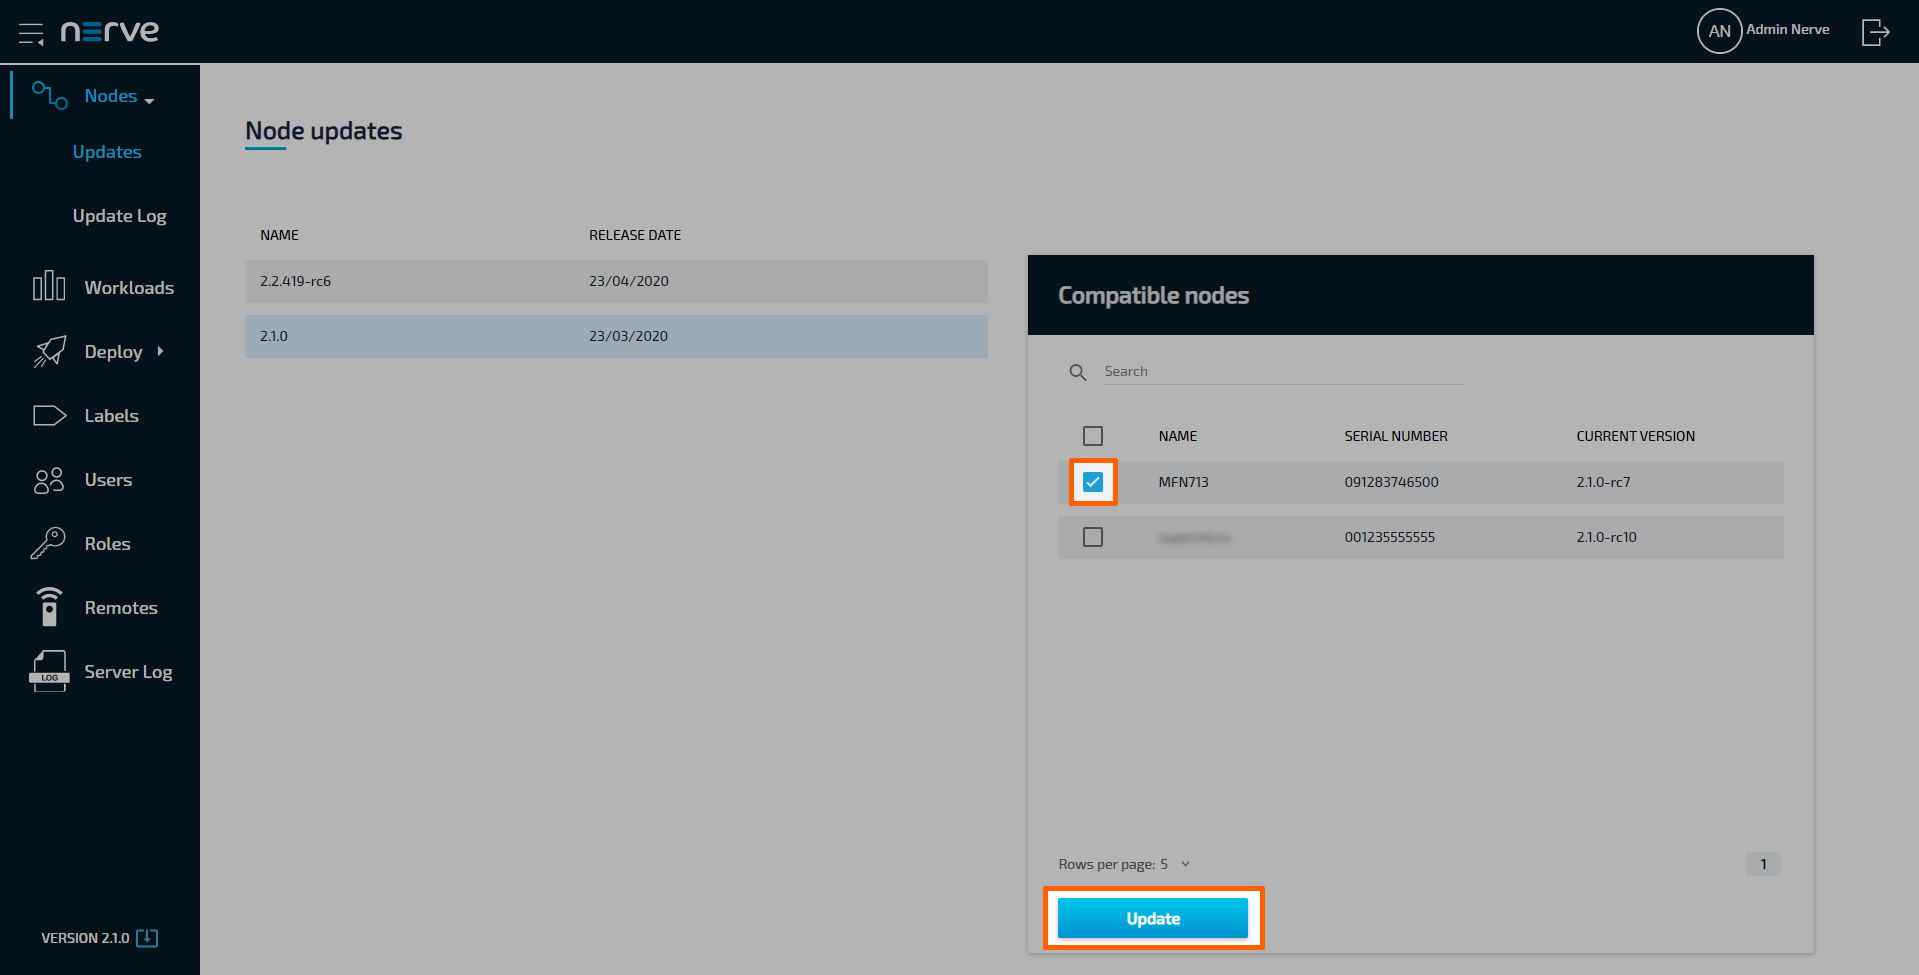
-
Select Yes in the pop-up window.
The Management System will display the log screen where the update is shown as in progress. The progress bar here shows the progress of the entire update campaign if more than one node has been selected before. Click the progress bar to see the progress of the update to each node.
Note
There are two possible error states in case the node update fails:
- Fail
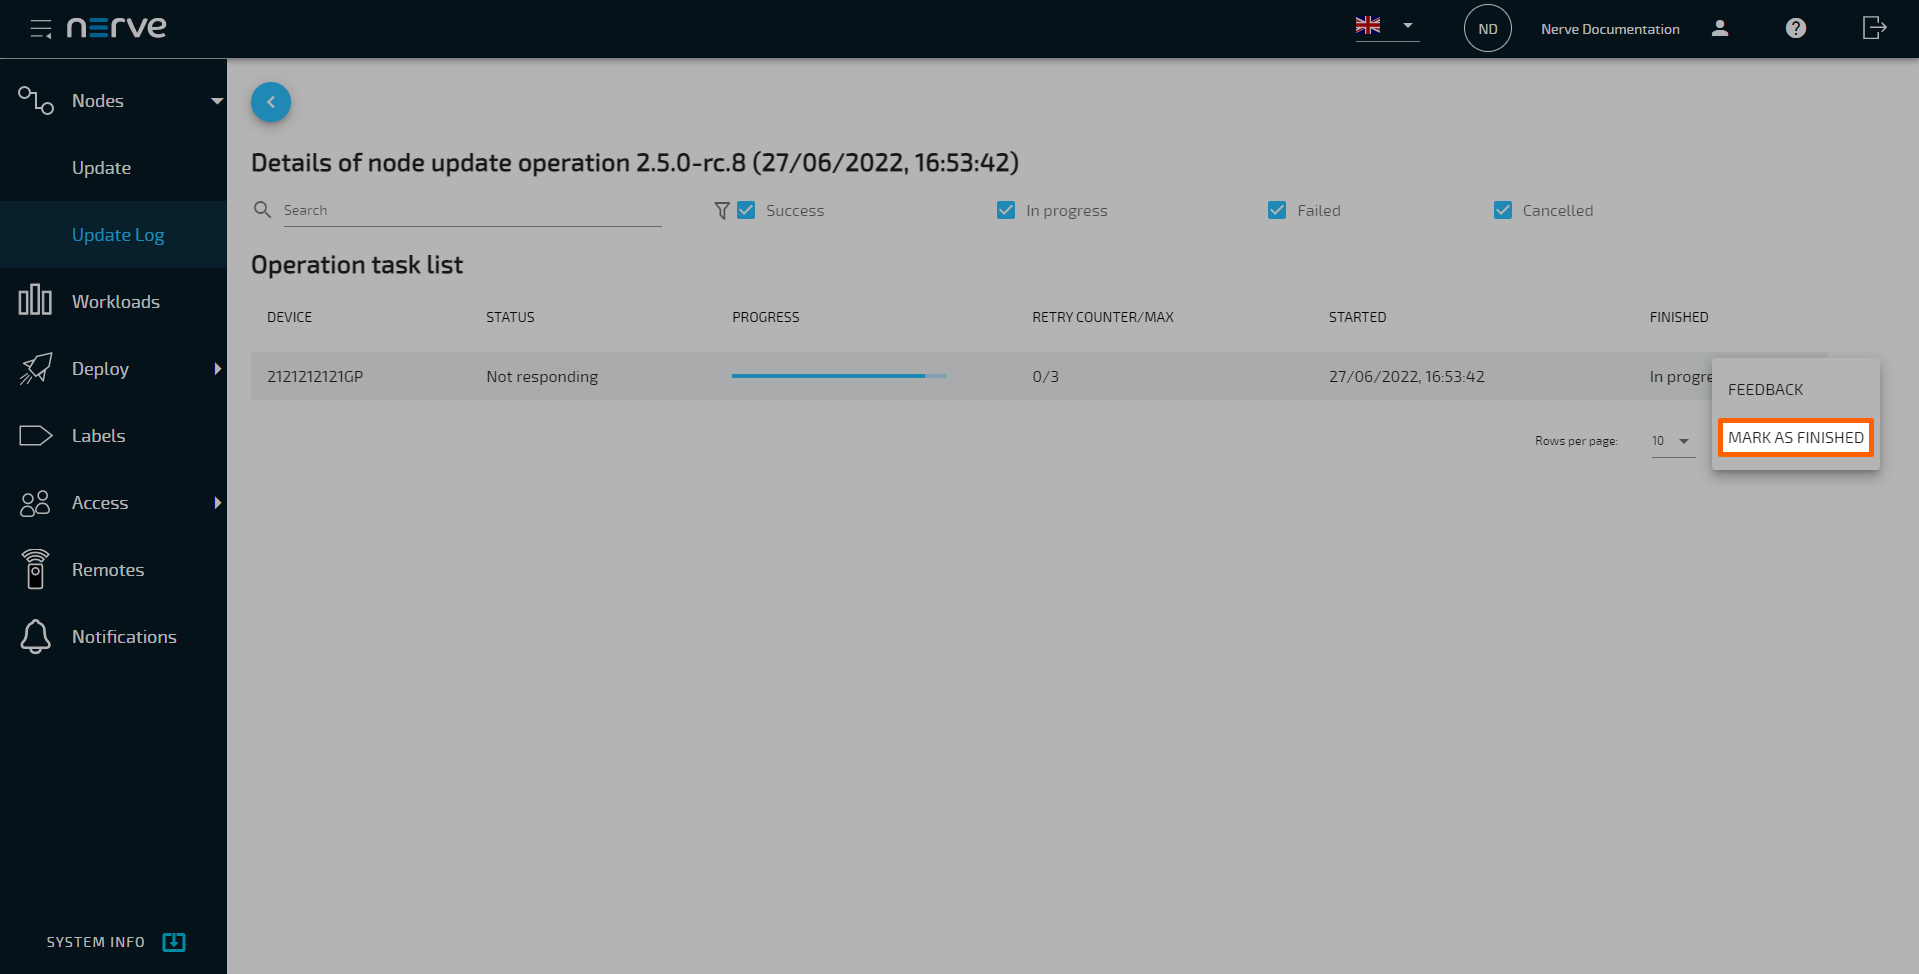
Support needs to take action. Contact TTTech Industrial customer support by writing an issue through the TTTech Industrial support portal. - Not Responding
In this case, attempt a physical reboot by unplugging the node from power and plugging it back in again. The node should come online with the new version installed. However, the update log will still show the update as In progress. Select the ellipsis menu in the update log and select MARK AS FINISHED to manually mark the node update as finished.
Removing a node
Note that generally there is no need in removing a node. Only remove a node in case of technical difficulties or by request of customer support. To remove a node, select the corresponding Delete icon in the Action column on the right side of the node list.