Logging and monitoring
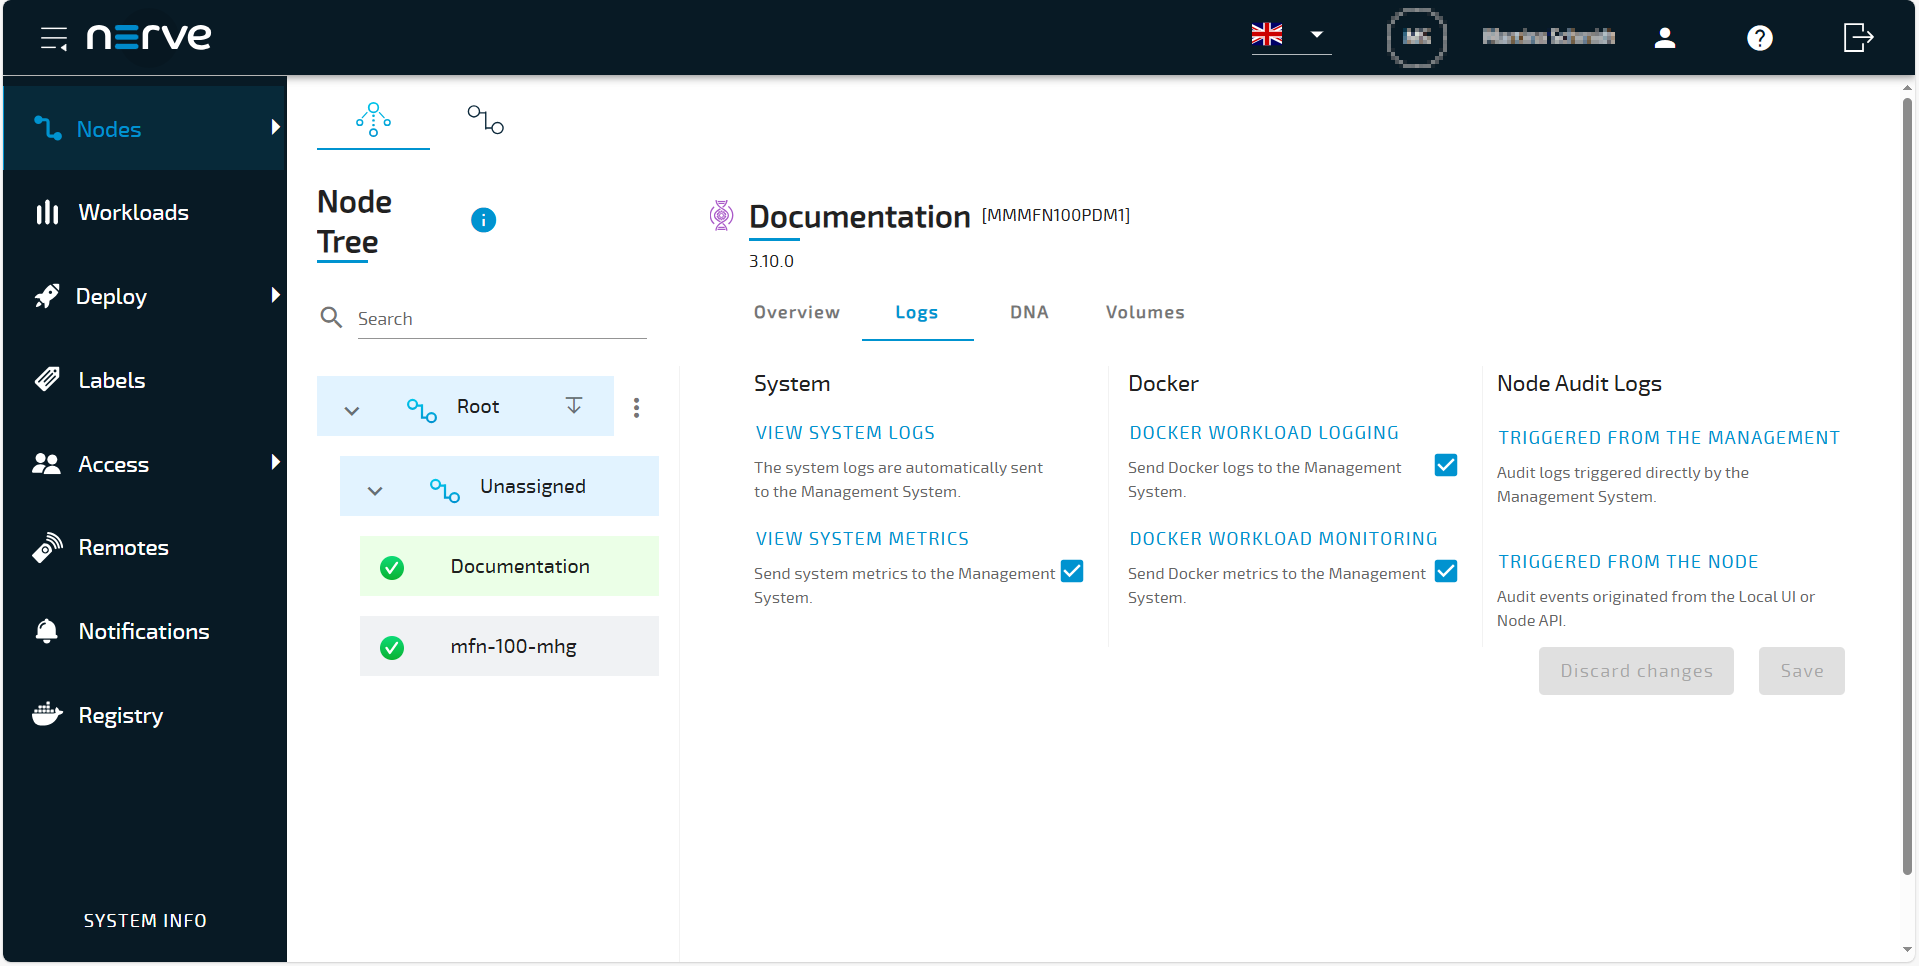
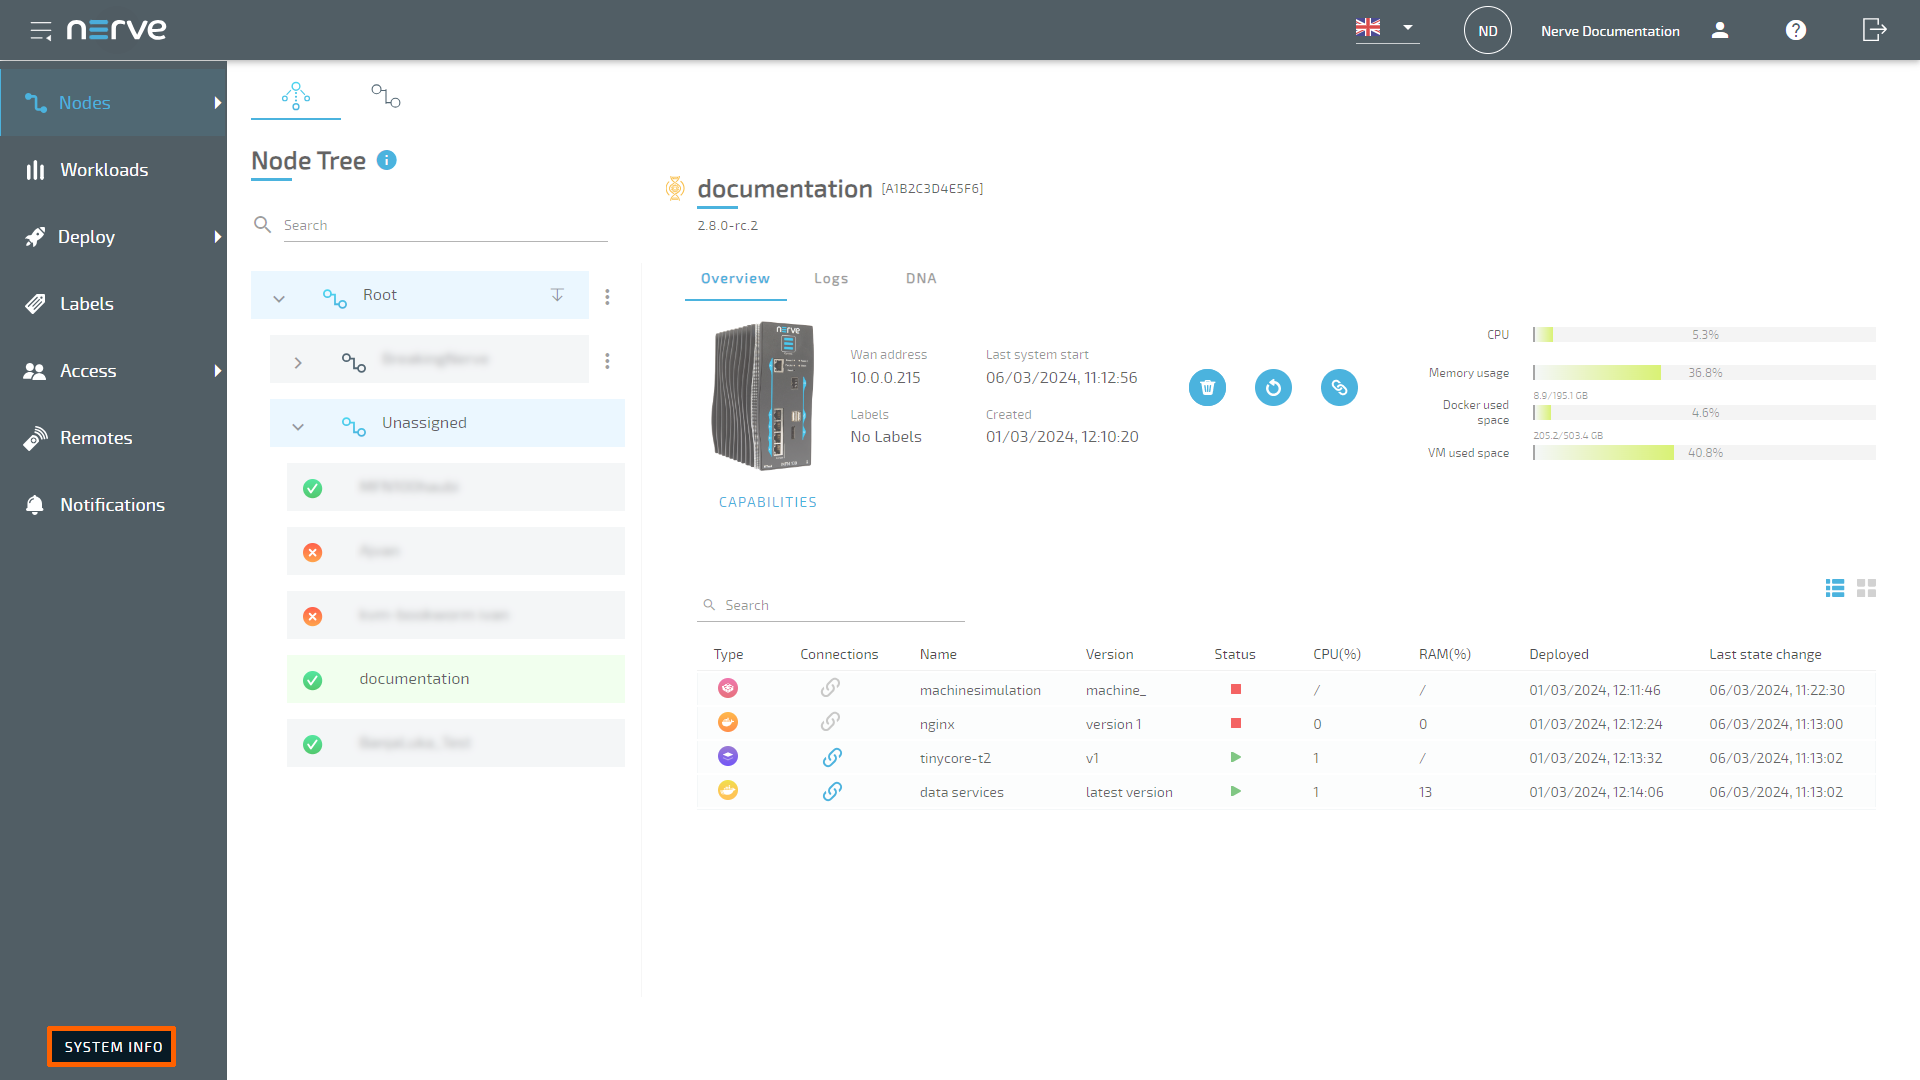
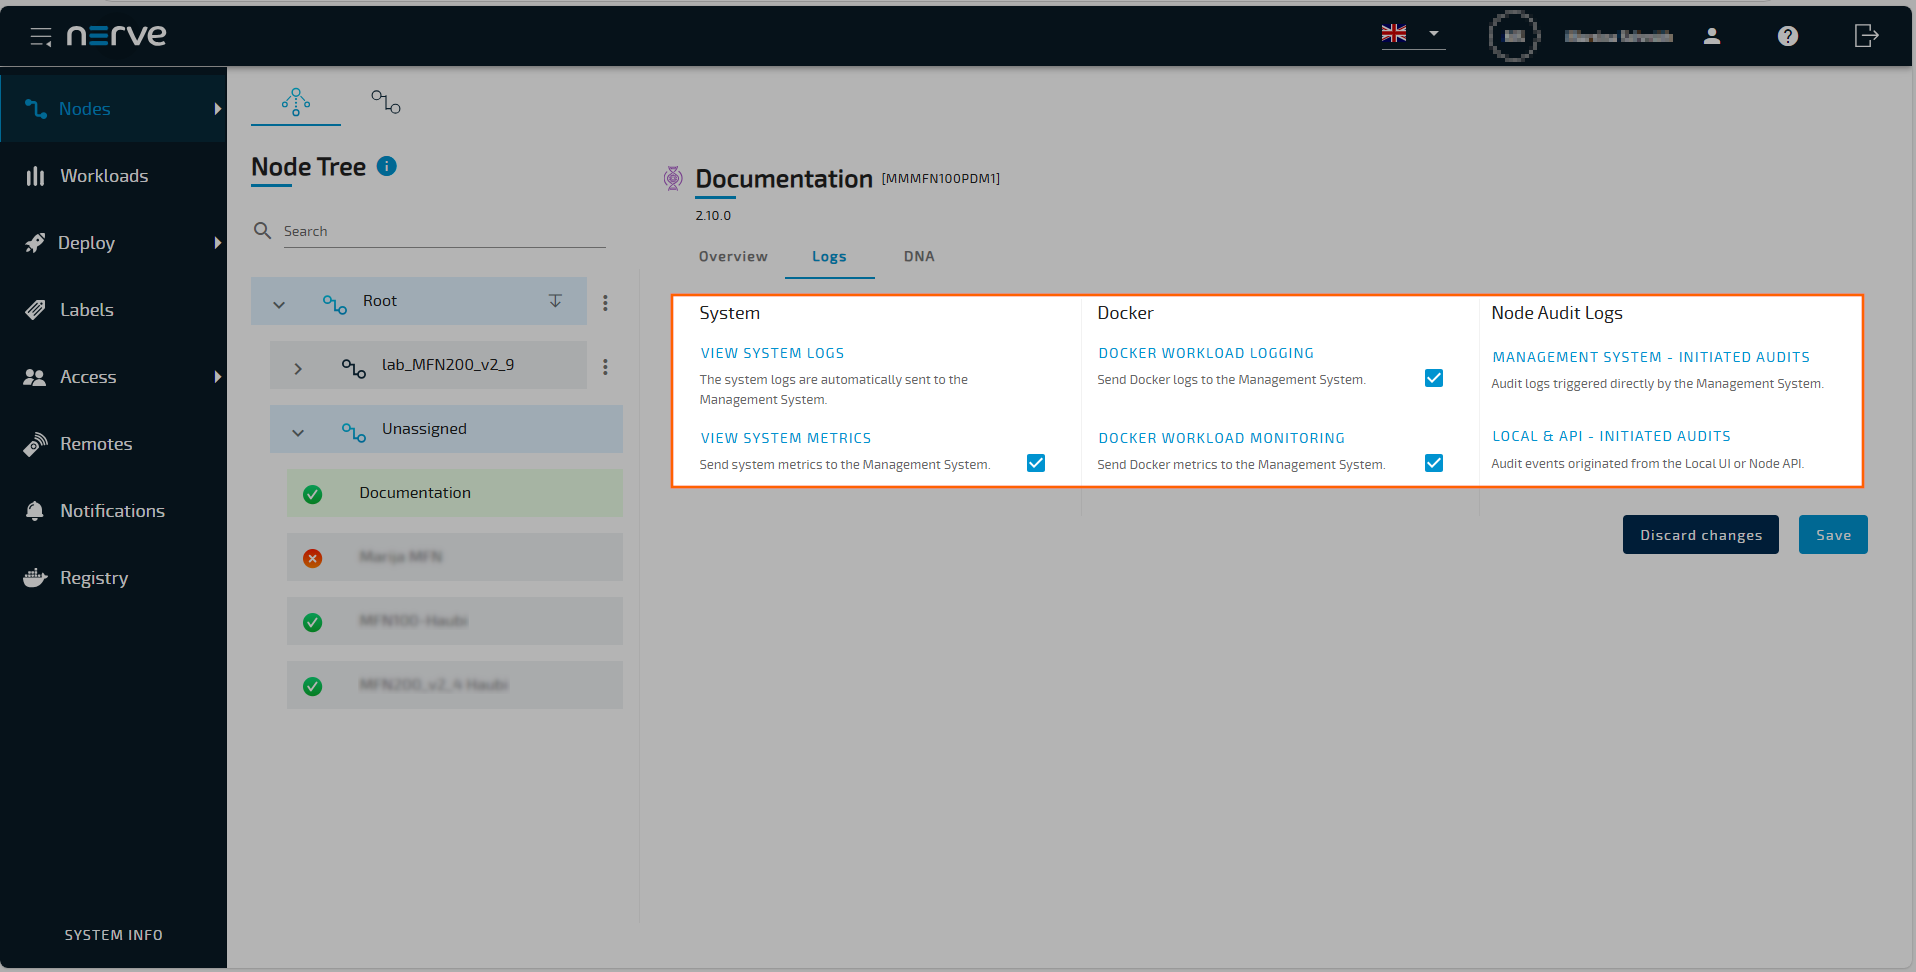
Data is gathered for Docker workloads, Docker Compose workloads and system parameters regarding resource usage. Metrics are then sent to OpenSearch in the Management System and visualized in OpenSearch Dashboard. Logging and monitoring options can be configured for each node in the node details view in the Management System:
- Log in to the Management System.
- Select Nodes in the navigation on the left.
- Select the node tree tab.
- Select a node in the node tree.
-
Select the Logs tab.
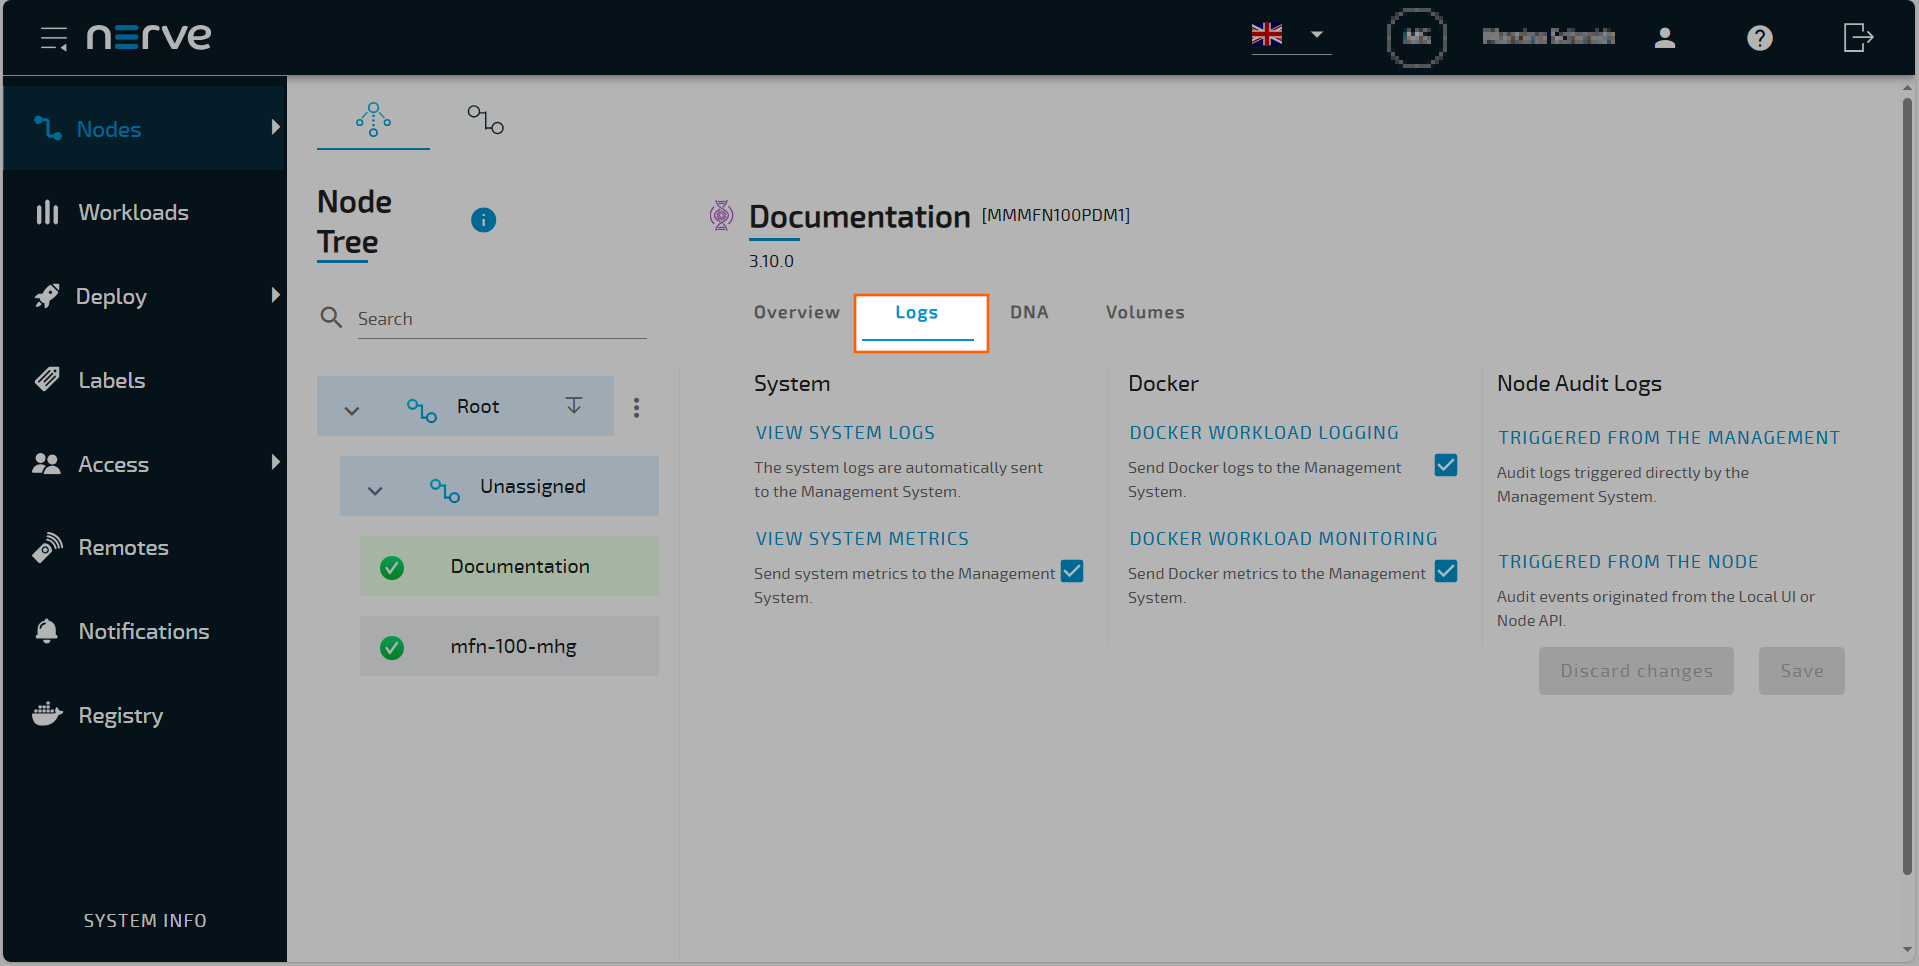
From here, tick the corresponding checkbox of a dashboard and select Save to enable logging or monitoring on that node. Note that system logs do not need to be activated, as they are collected by default. Each dashboard can be accessed by selecting the dashboard link. A new browser tab opens, displaying the selected dashboard. Note that all dashboards are also available if the node is offline.
Note
Some OpenSearch knowledge could be beneficial when working with the dashboards. Refer to the official OpenSearch documentation (refer to latest available Version 2.18.0) for more information on OpenSearch.
Node system logs
Selecting VIEW SYSTEM LOGS will open a new window and show the system logs of the node. The filters are set by default to error and warning. You can add predefined filters by selecting +Add filter. The internal node logs are aimed at Nerve service technicians in case of error and failure. Data is stored and visualized with OpenSearch. The amount of logs can be modified through the system log settings by Nerve service technicians. Contact customer support for more information.

Log levels
If you have permission to change the logging level configuration for a node, the Log Levels section is displayed. For users who do not have permission this section is not visible at all. For more information about roles and permissions, refer to Roles and Permissions.
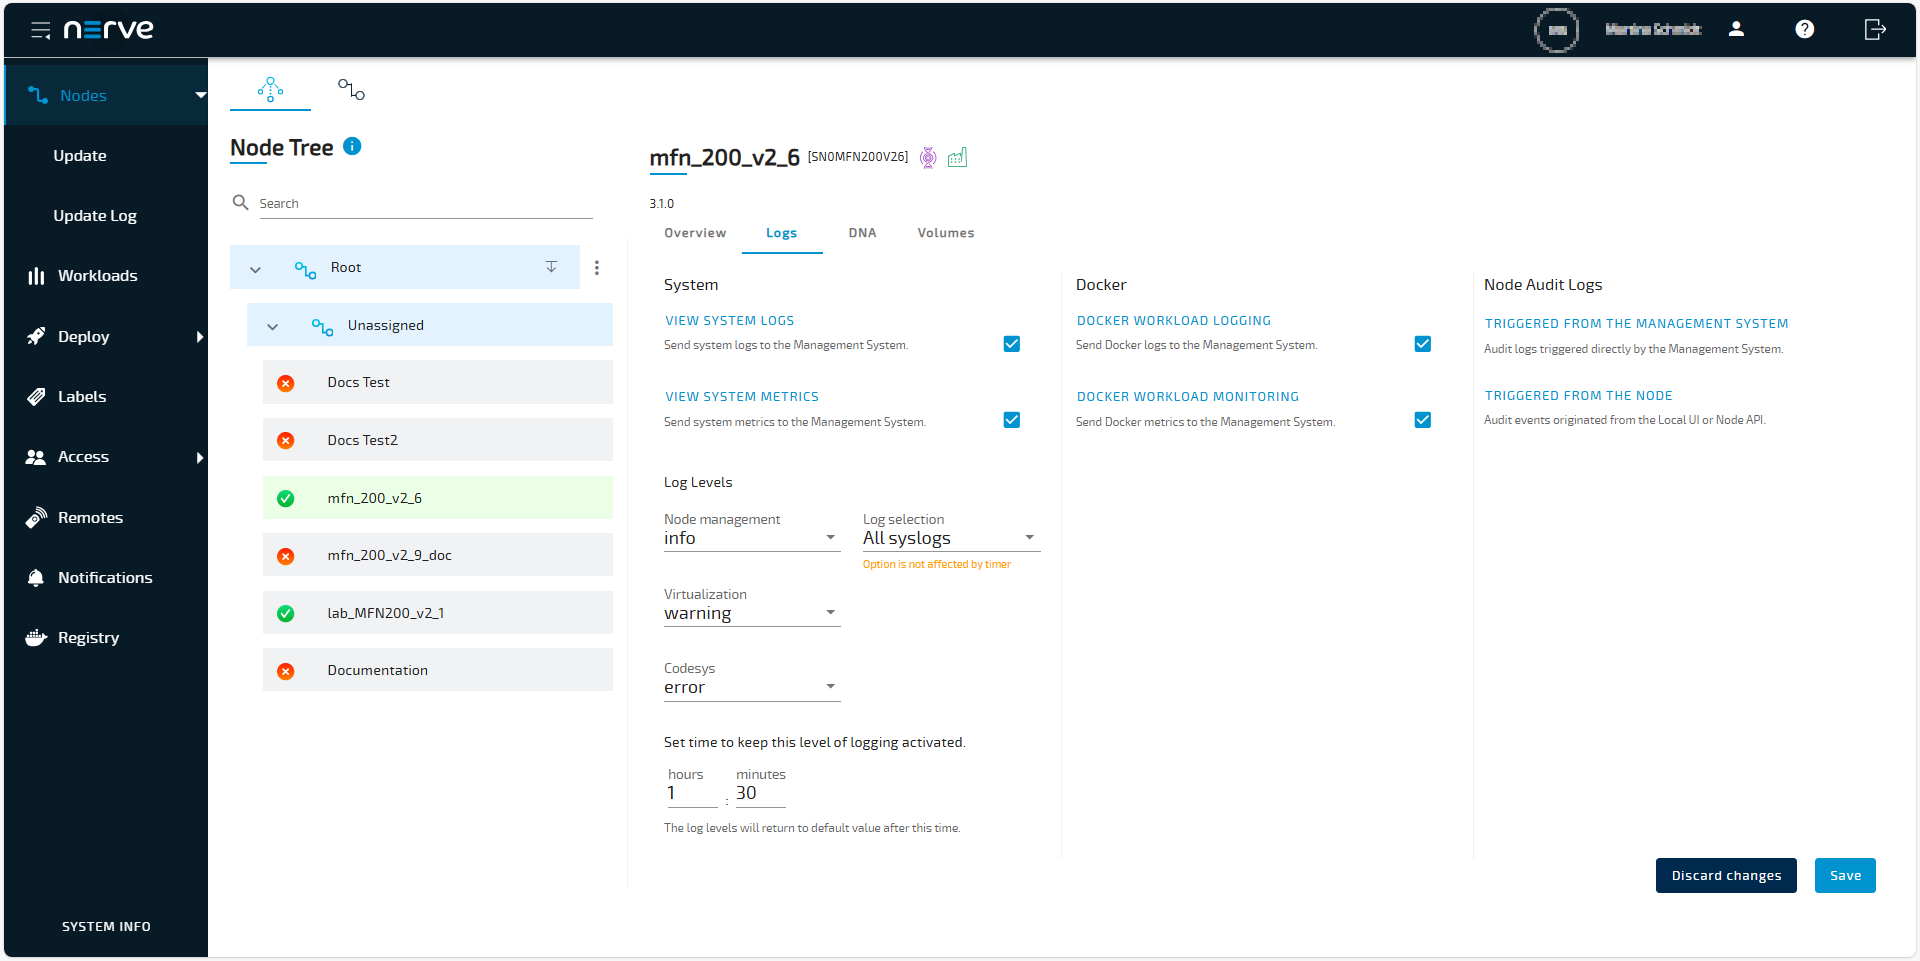
You can define log levels, to control the amount of data in the logs that are interesting for you. Log levels can be set for Node management, Virtualization and CODESYS. The log levels that you can choose for Node management are: debug, info, warn and error. The log levels that you can choose for Virtualization and CODESYS are: debug, info, warning, error and critical.
The default levels are set to following:
- Node management: info
- Virtualization: warning
- CODESYS: warning
Set time to keep this level of logging activated
Within this section, you can define the time span for which the chosen logging level remains active. This helps control how long relevant data is collected without overwhelming the system. After changing the log levels, you can set the duration for which these changes will take effect. The default value is 1 hour. The maximum value is 23 hours. Once the time span has expired, the log levels are reset to their default values.
Log selection
If the checkbox  next to VIEW SYSTEM LOGS is checked you can configure which system logs are uploaded. Choose Nerve only to disable all system logs and save network bandwidth. Choose All syslogs to upload all system logs. Note that this setting is not effected by the set time span below. By unchecking the box no system logs will be uploaded, this is intresting for applications with low bandwith connections.
Node system monitoring
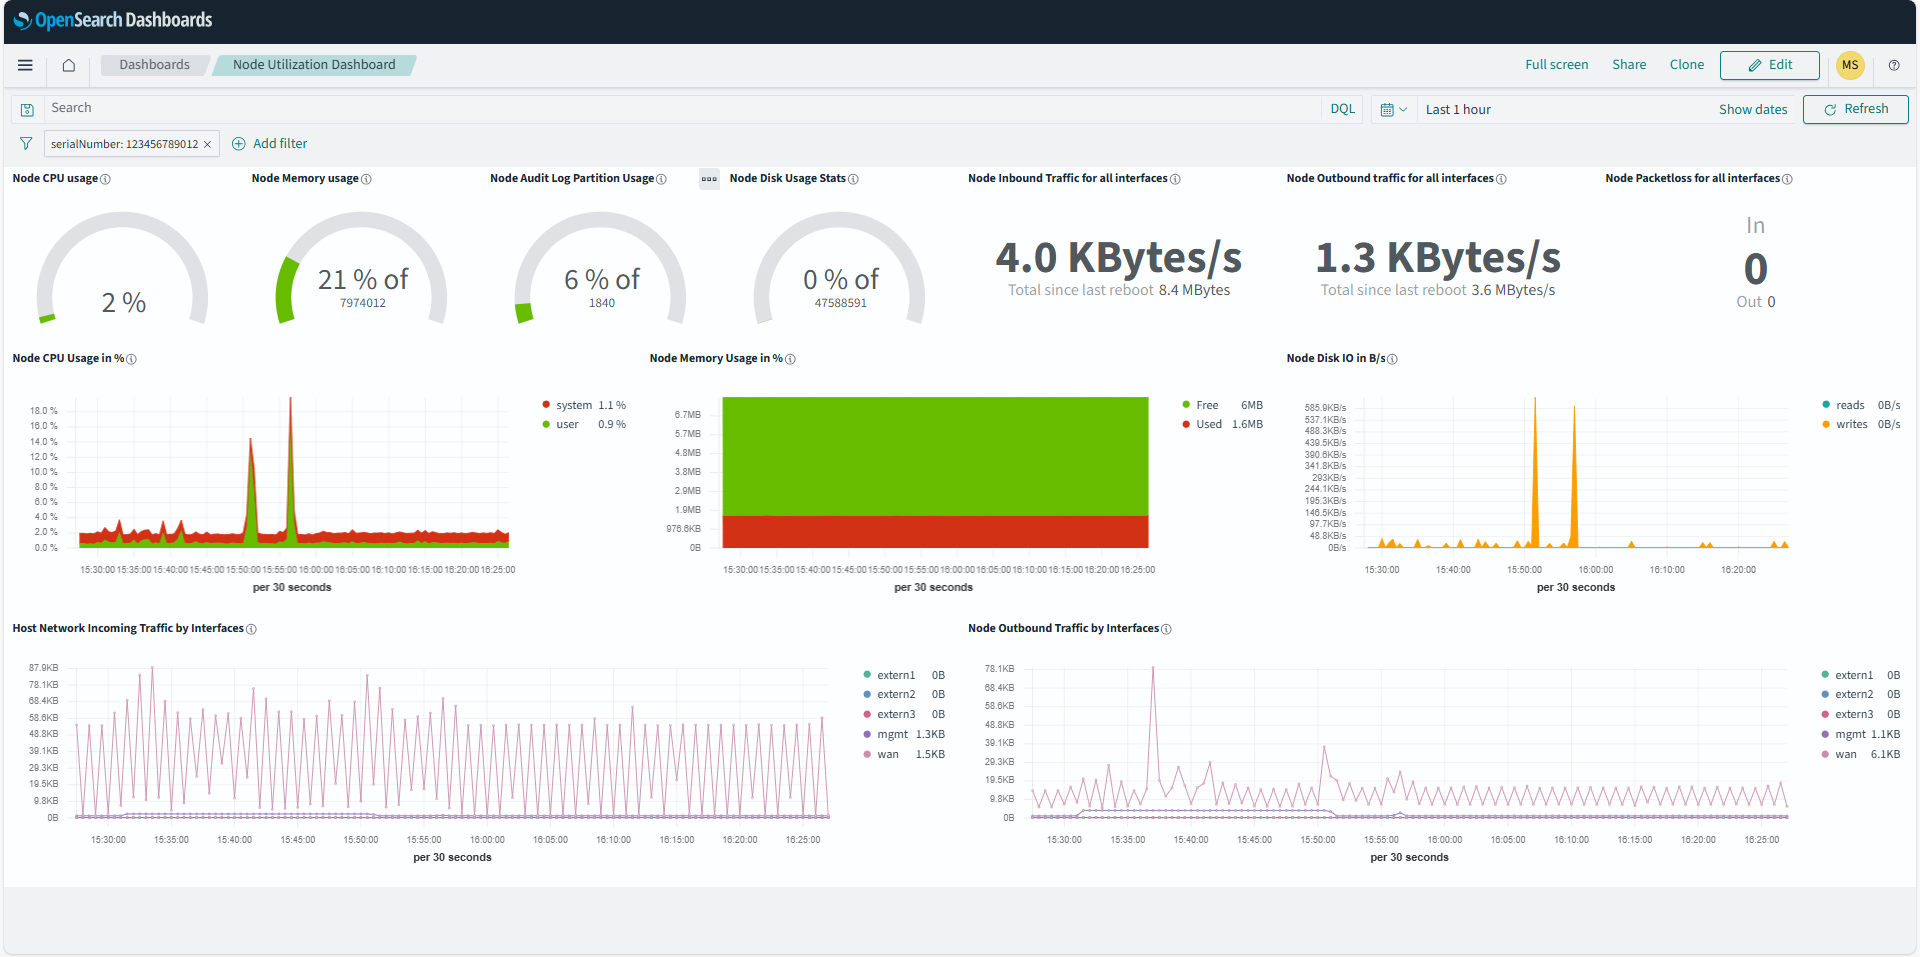
Resource utilization of the system as a whole is tracked when system monitoring is enabled. Refer to the screenshot and the table below for more information on the data that is gathered and displayed. Tick the checkbox next to VIEW SYSTEM METRICS to enable the tracking of system data.
Selecting VIEW SYSTEM METRICS will open a new window and show a dashboard with information about the utilization auf the node.
| Item | Description |
|---|---|
| Node CPU usage [%] | Gauge chart This chart displays the currently used total percentage of the CPU. Line graph The line graph displays the CPU usage in percent over time. Data is displayed scaled over time. In general, the data displayed here is according to how CPU usage is understood in Linux. For an explanation on how CPU usage is handled in Linux, refer to this link. |
| Node Memory usage [%] | Gauge chart This chart displays the currently used total percentage of memory, as well as the total memory available in byte. Memory used for virtualization is not included. Line graph The line graph displays the total amount of memory used over time. Data is displayed scaled over time. Memory used for virtualization is not included. |
| Node Audit Log Partition Usage [%] | This graph shows the current usage of the node audit partition as a percentage. It is recommended to set up an alert when the usage approaches its limit to prevent running out of space on the log partition. For more information how to set up an alert, refer to Setting up an alert. |
| Node Disk Usage stats [%] | This graph displays the currently used total percentage of disk space on the host, as well as the total disk space available in byte. |
| Node Inbound Traffic for all interfaces [B/s] | This is the current amount of incoming data, as well as the total amount of data transferred since the last reboot. |
| Node Outbound traffic for all interfaces [B/s] | This is the current amount of outgoing data, as well as the total amount of data transferred since the last reboot. |
| Node Packetloss for all interfaces | Here the number of lost incoming packets and lost outgoing packets is displayed. |
| Node Disk IO [B/s] | This graph displays the amount of reads and writes on the disk. Reads show how much data per second has been read while writes show the amount of data that has been saved or deleted. |
| Host Network Incoming Traffic by Interfaces | This is the amount of incoming data over time. The list to the right of the graph shows the average amount of traffic per interface. Note that this list also includes internal interfaces in this version. |
| Node Outbound Traffic by Interfaces | This is the amount of outgoing data over time. The list to the right of the graph shows the average amount of traffic per interface. Note that this list also includes internal interfaces in this version. |
Docker workload logging
The logs of the Docker workloads on a node are collected in the centralized logging system, allowing the analysis of logs from multiple workloads and nodes.
Logs are collected from the standard Linux streams stdout (for debug messages) and stderr (for error messages). So for user created workloads this means that logs need to be sent to these streams to be collected. Note that the logs are most suitable to be read by developers with expert knowledge and should also be configured by developers.
Tick the checkbox next to DOCKER WORKLOAD LOGGING to enable the tracking of Docker workload logs.
To display logs of a certain workload, collected logs can be filtered by selecting +Add filter in the Docker workload logging dashboard in OpenSearch.
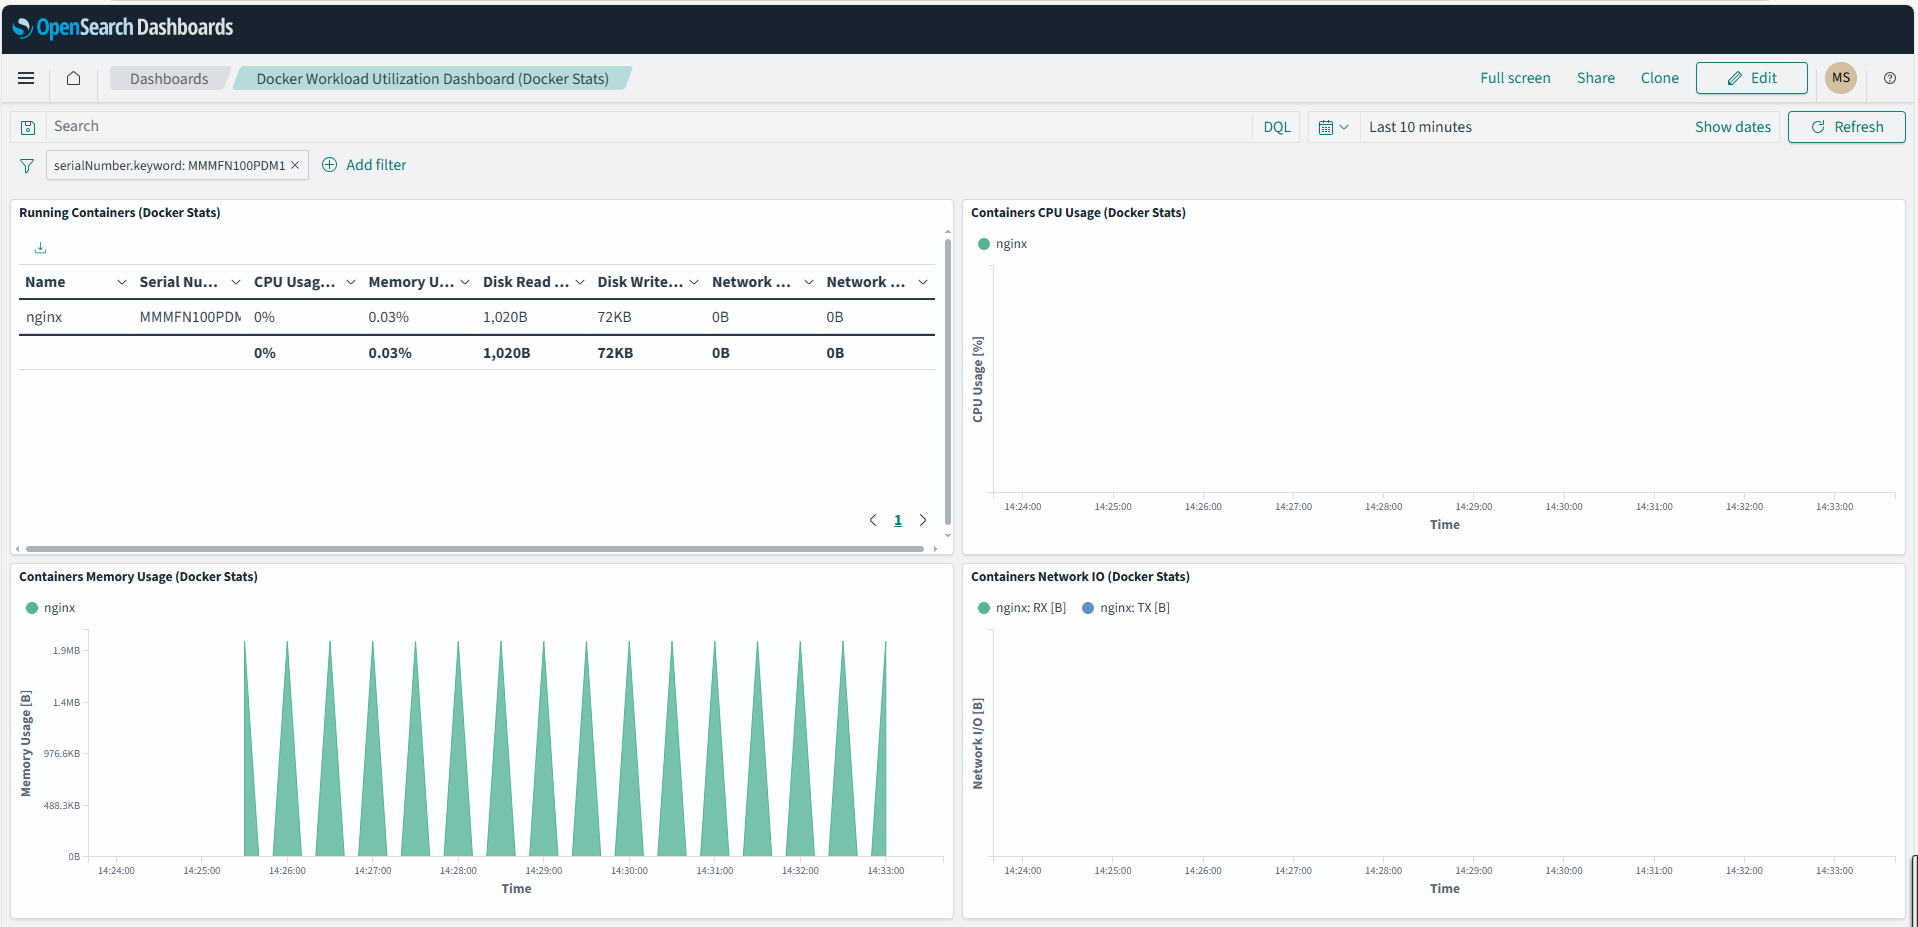
Docker workload monitoring
Metadata of the overall state of Docker workloads is gathered in the Management System. A list of installed containers and their resource utilization is displayed in this dashboard.
Tick the checkbox next to DOCKER WORKLOAD MONITORING to enable the tracking of Docker workload data.
| Item | Description |
|---|---|
| Running Containers | This is a list of user-installed Docker containers with details. Name This is the name of the Docker container as defined with the Container name setting when provisioning the workload. Serial Number This is the serial number of the current node. CPU usage [%] This is an average value of how much of the total CPU a Docker workload has used. DiskIO This is the sum of reads and writes over the defined time span. Mem [%] This is an average percentage of how much of the total memory a Docker workload has used. Mem RSS [B] This is an average value of how much resident set size (RSS) memory a Docker workload has used. Refer to this link for a general explanation on RSS. |
| CPU Usage | This is a graph of CPU usage in percentage over time. Note that the percentages here are in relation to the total amount of available CPU. Also, the display behaves according to standard OpenSearch Dashboard behavior, meaning that CPU usage might be displayed as being at zero even though the CPU is busy. This is due to the graph showing only new data coming in and disregarding values that stay constant over a certain amount of time. |
| Containers Network IO | This is a graph showing the incoming and outgoing data for each container over time. Inbound and outbound traffic are marked separately per container. |
| Container Memory Usage | This is a graph of the total amount of memory used over time. |
Audit logs for the Management System
Audit logs are a systematic and chronological record of events, activities, or transactions within a system. These logs capture a wide range of information, including who performed an action, what the action was, when it occurred, and the outcome of the action. As such, they are a distinct security capability, providing forensics capability and traceability about past actions, and are crucial for several purposes, such as security, compliance, troubleshooting, and performance monitoring.
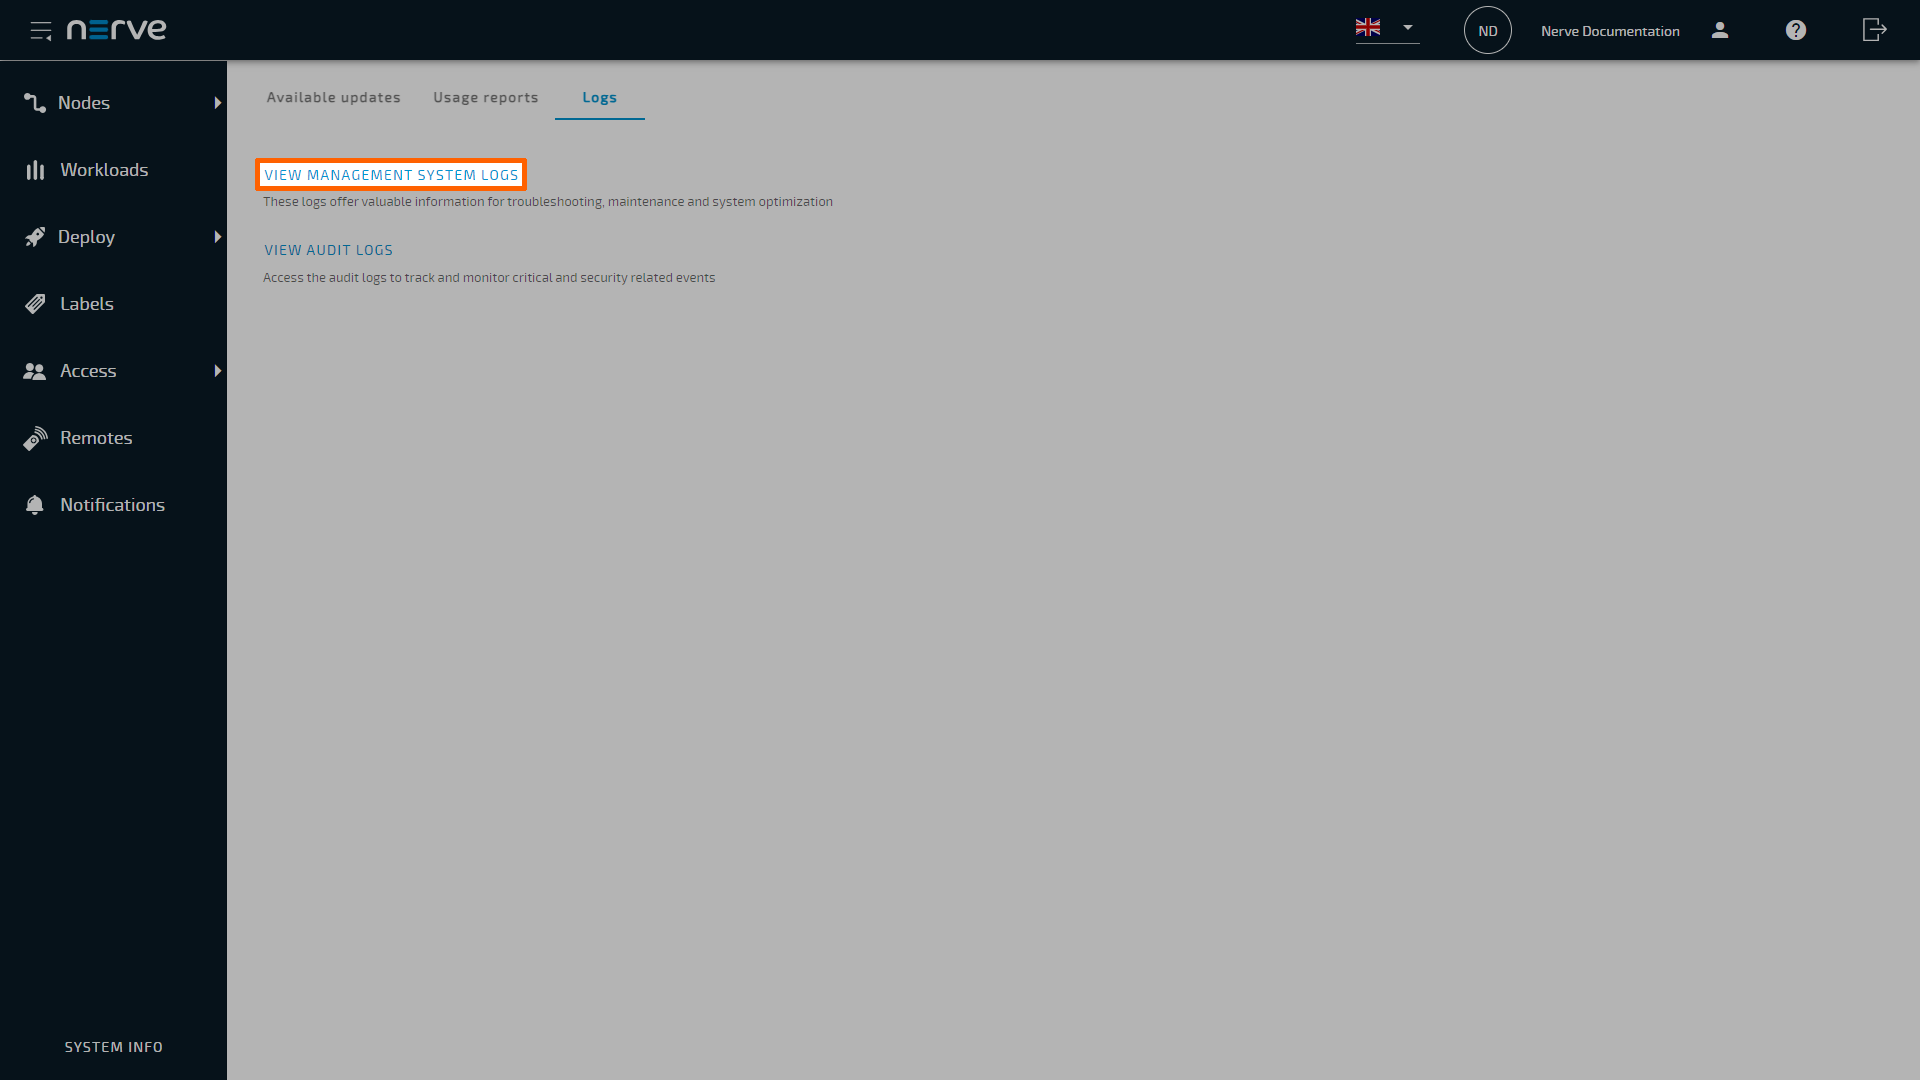
The audit logs for the Management System are presented in an OpenSearch dashboard. Access the dashboard within the SYSTEM INFO section in the Management System:
Note
- Only users with the Admin role or the UI_SERVER_AUDIT:VIEW permission assigned to their role can access the audit logs.
- Audit logs are retained for 6 months.
- Access the Management System.
-
Select SYSTEM INFO at the bottom-left.
-
Select the Logs tab.
-
Select VIEW AUDIT LOGS.
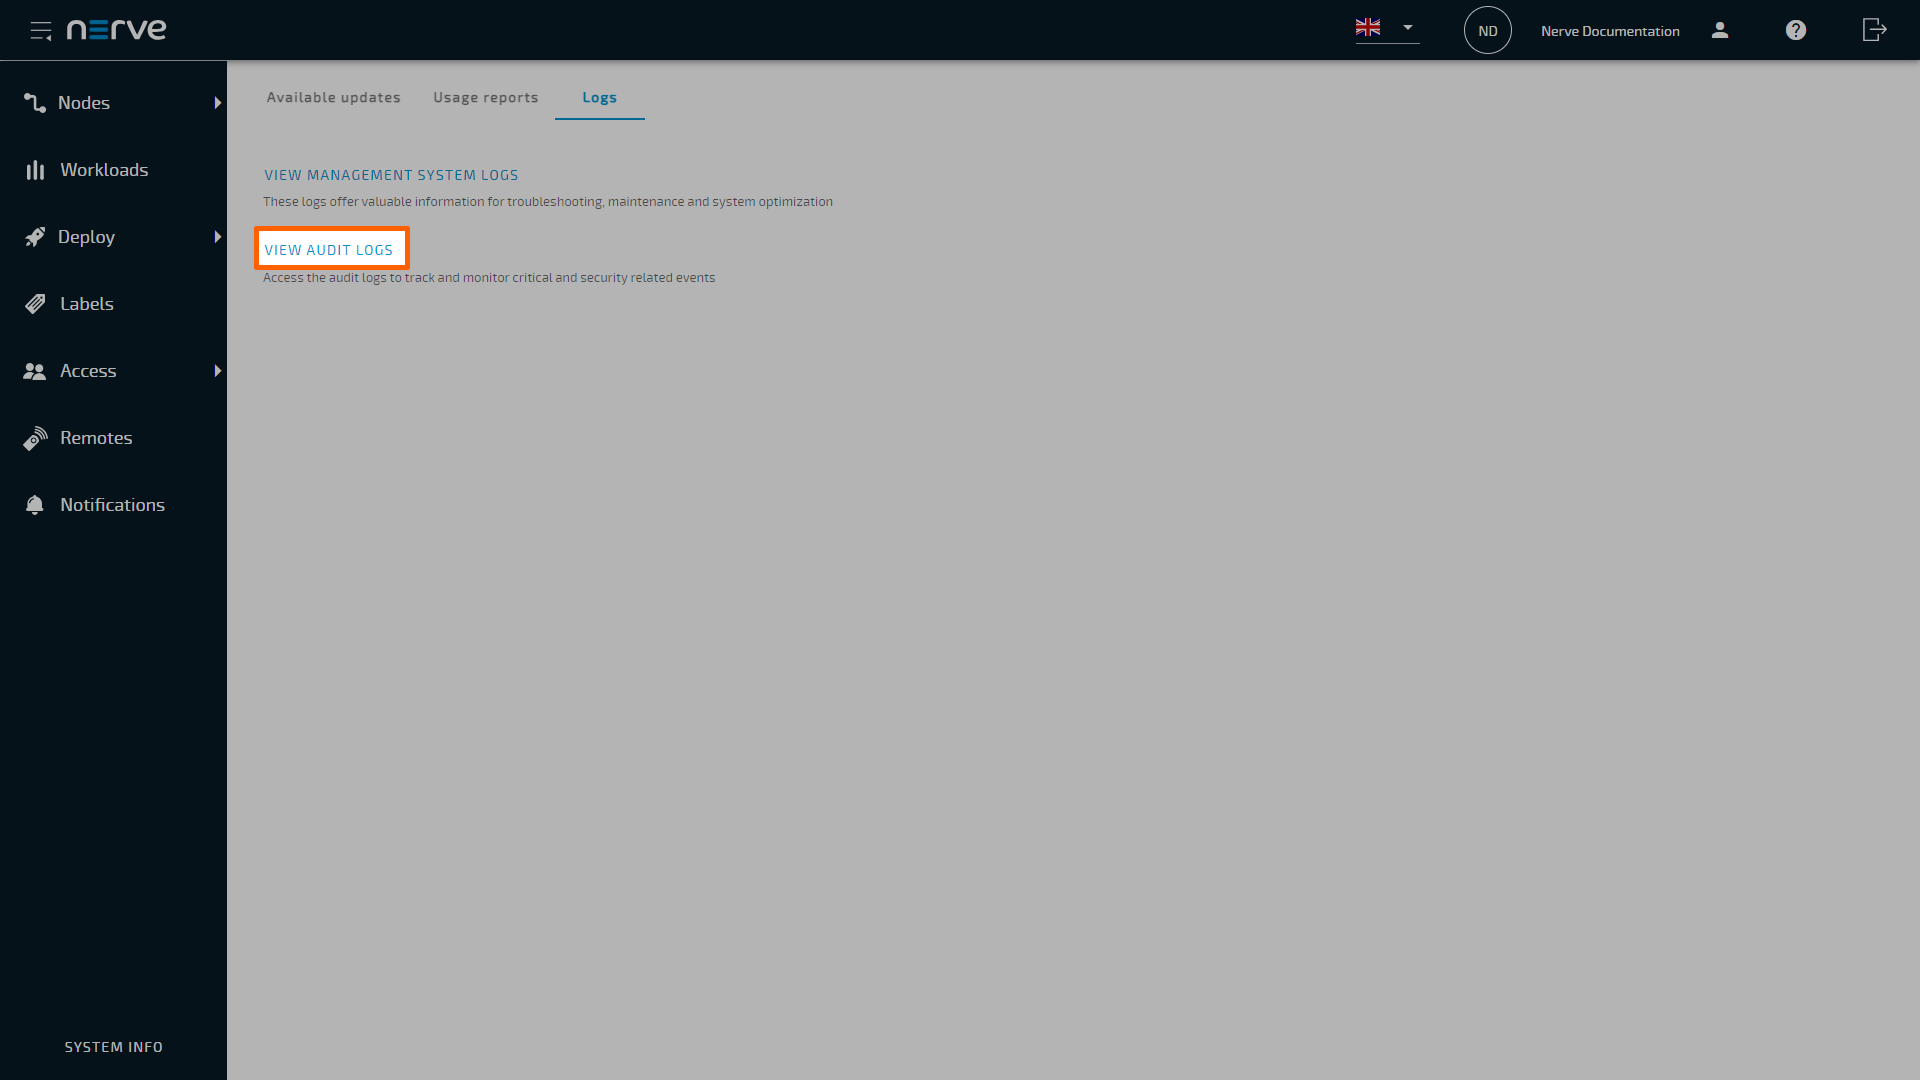
An OpenSearch Dashboard window will open in a new browser tab, showing relevant log entries.
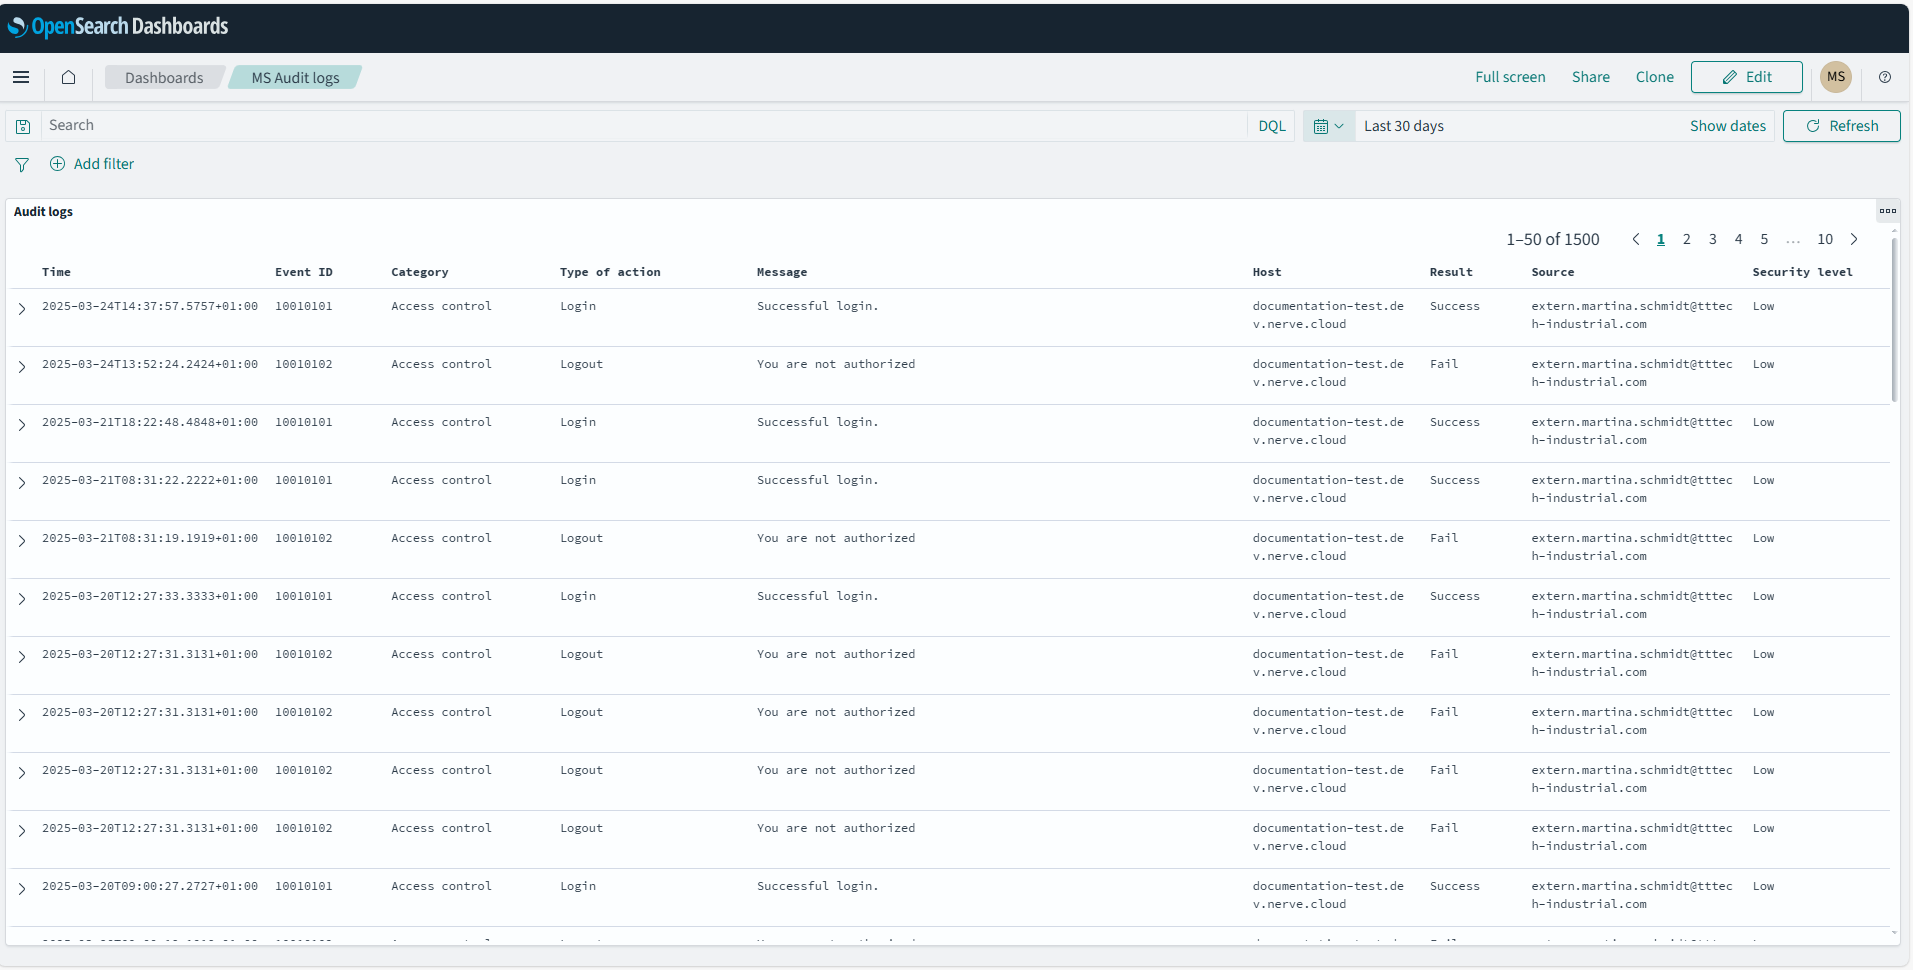
Inspect a log entry to show the full range of fields. The fields contain the following information:
| Field | Description |
|---|---|
| @timestamp | Timestamps are shown in the format MMM DD, YYYY @ hh:mm:ss.sss. The time is taken from the browser's time zone settings. |
| Additional info | This category is optional. Depending on the event logged, additional information will be displayed here. The information contained in this filed can be used to ease searching for additional logs. Examples of information that could be shown:
|
| Category | This states the area the log applies to. Examples of categories are:
|
| Event ID | An internal code that represents the most important details of a log entry. It consists of:
|
| Host | This shows where the log message originates from. It can be a Management System URL or a node serial number. |
| Message | This is the main information field. It describes the actual event in written text and can contain detailed information like error messages, IDs, image paths and more. Refer to the additional info field if the content of the message field is insufficient. |
| Result | This contains the event result and can be either Success or Fail. |
| Security level | This contains an estimation of the security risk of the event and can be either Low, Medium or High. |
| Source | This shows the user, process or component that triggered the event. It will show:
|
| Type of action | This field describes the type of event that has occurred. Examples are:
|
| _id | This is a field generated by OpenSearch. It contains a unique identifier that is attached to the log. |
| _index | This is a field generated by OpenSearch. It contains the name of the index that all Management System logs are stored under. |
| _score | This is a field generated by OpenSearch. It is not used for audit logs and will not contain any information. |
| _type | This is a field generated by OpenSearch. It is not used for audit logs and will not contain any information. |
| label | This field shows the label of the log that states the type of log. In the case of audit logs, it will contain audit. |
| level | This field shows the nature of the log. It serves the purpose of differentiating between logs contain information or error messages. It can contain info or error. |
Event ID code
The Event ID code is an eight digit number, with every two digits signifying an aspect of the event. Its meaning is generated left to right, meaning that the first digits pair determines the possible value of the second digit pair and so on. The digits stand for the following:
Event ID code pattern: NNXXYYZZ
|
Take a look at the flowchart below for possible digits. Keep in mind that the ID is constructed the following way: NN XX YY ZZ. To keep the overview simple the last digits ZZ are omitted in view below.
Refer to the tables below for a list of sources that signify the first two digits NN.
| NN | Source of audit logs |
|---|---|
| 10 | Audit logs for the Management System (description in this section.) |
| 20 | Audit logs for the node For more information, refer to Local UI |
graph LR
  A[Management System - 10] --> B[System - 01];
  A[Management System - 10] --> C[Workloads - 02];
  B[System - 01] --> D[Access control - 01];

  C[Workloads - 02] --> F[Deploy - 01];
  C[Workloads - 02] --> G[CRUD - 02];
  C[Workloads - 02] --> H[Workload control - 03];
  C[Workloads - 02] --> I[DNA - 04];
  C[Workloads - 02] --> J[Workload backup - 05];
  C[Workloads - 02] --> K[Workload snapshot - 06];
  C[Workloads - 02] --> L[Remote connections - 07];

  A[Management System - 10] --> T[Role - 03];
  T[Role - 03] --> RA[CRUD - 01];

  A[Management System - 10] --> 04[Node - 04];
  04[Node - 04] --> 0401[Node reboot - 01];
  04[Node - 04] --> 0402[CRUD - 02];

  A[Management System - 10] --> 05[Node tree - 05];
  05[Node tree - 05] --> 0501[CRUD - 01];

  A[Management System - 10] --> 06[Usage reports - 06];
  06[Usage reports - 06] --> 0601[Monthly report - 01];

  A[Management System - 10] --> 07[Node update - 07];
  07[Node update - 07] --> 0701[A/B Update - 01];

  A[Management System - 10] --> 08[Notifications - 08];
  08[Notifications - 08] --> 0801[CRUD - 01];

  A[Management System - 10] --> 09[Labels - 09];
  09[Labels - 09] --> 0901[CRUD - 01];

  A[Management System - 10] --> 10[Docker Compose service - 10];
  10[Docker Compose service - 10] --> 1001[Control - 01];

  A[Management System - 10] --> 11[Monitoring and logging - 11];
  11[Monitoring and logging - 11] --> 1101[Node level - 01];

  A[Management System - 10] --> 12[Node - User management - 12];
  12[Node User management - 12] --> 1201[List updates triggered by user - 01];
Refer to the table below for a list of events that signify the last two digits ZZ. Note that the Message and Additional info fields in the audit logs dashboard give more context to each event:
| XX Object | YY Category | ZZ ID | Action |
|---|---|---|---|
| System | Access control | 01 | Login |
| 02 | Logout | ||
| 03 | User registration | ||
| 04 | Management System language set | ||
| 05 | User profile updated | ||
| 06 | Personal user profile updated | ||
| 07 | User profile deleted | ||
| 08 | User profile activated | ||
| 09 | Request credentials reset | ||
| 10 | Reset password action | ||
| 11 | Login with MFA | ||
| 12 | MFA Validation | ||
| 13 | MFA Activation | ||
| 14 | Reset MFA Secret | ||
| Workloads | Deploy | 01 | Workload deployment initiated |
| 02 | Workload deployment validated and started | ||
| 03 | Workload deployment successful, failed or canceled | ||
| 04 | Workload deployment restarted (single) | ||
| 05 | Workload resources allocation initiated | ||
| 06 | Workload configuration files applied | ||
| 07 | Workload resources allocation updated | ||
| 08 | Workload deployment restarted (multiple) | ||
| 09 | Workload deployment manually marked as success | ||
| 10 | Workload deployment manually marked as fail | ||
| 11 | Workload deployment log deleted | ||
| CRUD | 01 | Workload creation initiated | |
| 02 | Workload creation successful | ||
| 03 | Docker image download successful | ||
| 04 | Workload version creation initiated | ||
| 06 | Workload settings update initiated | ||
| 07 | Workload settings update successful | ||
| 08 | Workload version settings update initiated | ||
| 09 | Workload version settings update successful | ||
| 10 | Workload deleted | ||
| 11 | Workload version deleted | ||
| Workload control | 01 | Workload undeployed | |
| 02 | Workload suspended | ||
| 03 | Workload resumed | ||
| 04 | Workload stopped | ||
| 05 | Workload restarted | ||
| 06 | Workload started | ||
| DNA | 01 | Target configuration downloaded | |
| 02 | Current configuration downloaded | ||
| 03 | Reconfiguration initiated by re-applying the target configuration | ||
| 04 | Reconfiguration cancelled | ||
| 05 | Reconfiguration initiated by applying a new target configuration | ||
| 06 | Reconfiguration finished, target configuration successfully applied | ||
| Virtual machine backup | 01 | Backup creation initiated or failed | |
| 02 | Backup creation successful or failed | ||
| 03 | Backup creation retry initiated | ||
| Virtual machine snapshot | 01 | Snapshot creation initiated | |
| 02 | Snapshot creation successful or failed | ||
| 03 | Snapshot deletion initiated | ||
| 04 | Snapshot deletion successful of failed | ||
| 05 | Snapshot reversion initiated | ||
| 06 | Snapshot reversion successful or failed | ||
| 07 | Snapshot schedule configured | ||
| 08 | Scheduled snapshot successful or failed | ||
| 09 | Snapshot schedule deletion initiated | ||
| 10 | Snapshot schedule deletion successful or failed | ||
| Remote connections | 01 | Remote connection to workload version or node established or failed | |
| 02 | Remote connection pending to connect | ||
| 03 | Remote connection connected | ||
| Connection is successfully established/restored. (Nerve Connection Manager) | |||
| 05 | Disconnection of a remote connection from a workload version or node successful or failed | ||
| 06 | Approval of remote connection to workload version or node successful or failed | ||
| 07 | Remote connection terminated | ||
| Connection is successfully removed/disconnected. (Nerve Connection Manager) | |||
| Role | CRUD | 01 | Create role |
| 02 | Update role | ||
| 03 | Delete role | ||
| Node | Node reboot | 01 | Node reboot |
| 02 | Node network state | ||
| CRUD | 01 | Update node | |
| 02 | Create node | ||
| 03 | Delete node | ||
| Node tree | CRUD | 01 | Tree object added |
| 02 | Tree object moved | ||
| 03 | Tree object edited | ||
| Usage reports | Monthly reports | 01 | Automatic monthly reports |
| 02 | Download of report | ||
| Node update | Monthly reports | 01 | Node Update initiated |
| 02 | Update validation | ||
| 03 | Node Update finished | ||
| Notifications | CRUD | 01 | Update notification |
| 02 | Create notification | ||
| 03 | Delete notification | ||
| Labels | CRUD | 01 | Create label |
| 02 | Update label | ||
| 03 | Delete label | ||
| 04 | Merge label | ||
| Docker Compose service | Control | 01 | Service start |
| 02 | Service stop | ||
| 03 | Service restart | ||
| Monitoring and logging | Node level | 01 | Settings applied |
| 02 | Activity log downloaded | ||
| Node User management | List updates triggered by user | 01 | List users |
| 02 | Delete user | ||
| 03 | Delete all users |
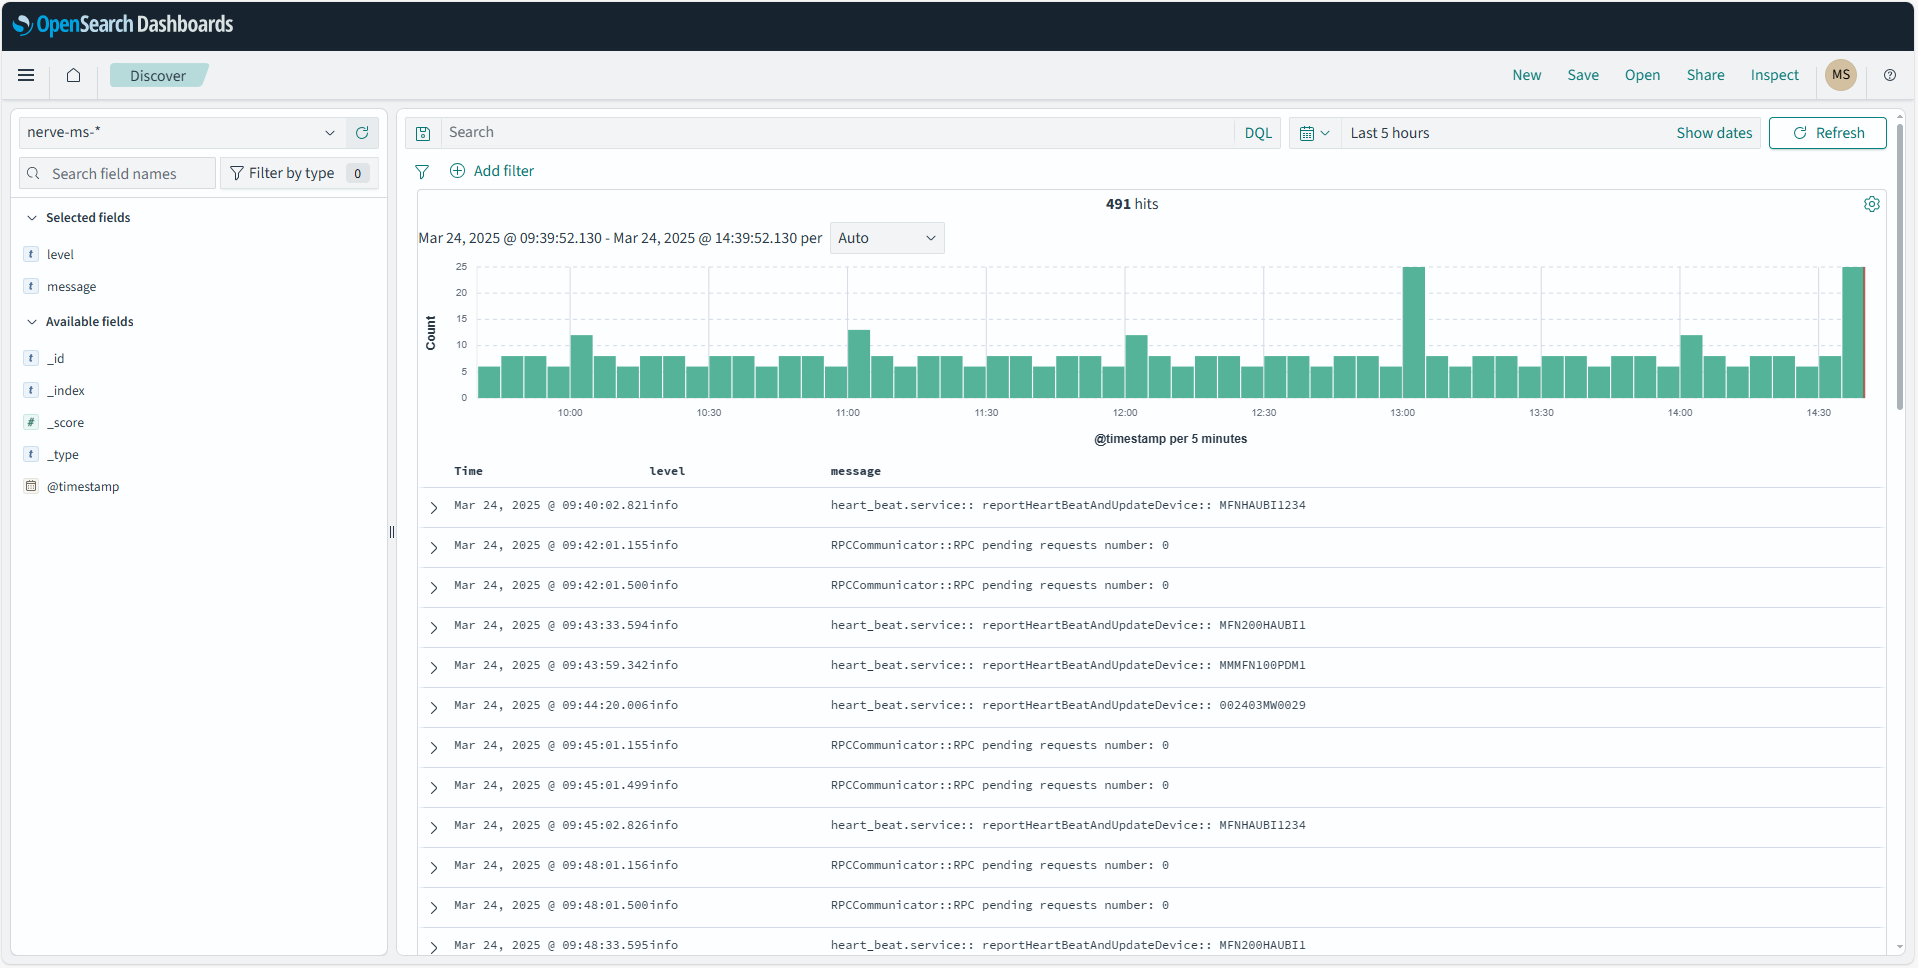
Management System logs
Management System logs can be accessed in the SYSTEM INFO section by users with the Admin role or the UI_SERVER_AUDIT:VIEW permission assigned to their role. These internal logs are aimed at Nerve service technicians in case of error and failure. Data is stored with OpenSearch and visualized with OpenSearch Dashboard.
Access the Management System logs the following way:
- Access the Management System.
-
Select SYSTEM INFO at the bottom-left.
-
Select the Logs tab.
-
Select VIEW MANAGEMENT SYSTEM LOGS.
A new tab opens, displaying the Management System logs in an OpenSearch dashboard.
Setting up alerts
Users can monitor specific events and receive alerts when critical events are detected. The instructions below explain how to create alerts and choose a notification method for specific events detected in a Docker workload. The instructions are split up the following way to make them easier to follow:
Note
This section mostly concerns how to use and configure OpenSearch in the context of the Nerve system. Therefore, refer to the OpenSearch documentation for detailed information that is not covered in the instructions below.
-
Setting up a notification channel
A notification channel is set up to use in an action. Inside the channel, sender and recipients are defined. This section is split up further into creating an SMPT sender, a recipient group and a notification channel. -
Setting up a monitor
A monitor is a job that runs on a defined schedule and queries OpenSearch indexes. The results of these queries are then used as input for one or more triggers. -
Setting trigger and action
Triggers are conditions that, if met, generate alerts, with an action that sends out information after being triggered. Actions have a destination, a message subject and a message body.
Since the instructions below cover steps performed in OpenSearch, OpenSearch needs to be accessed in the Nerve system to proceed:
- Log in to the Management System.
- Select a node from the node tree.
-
Select the Logs tab.
-
Select any of the dashboard links to access OpenSearch.
Setting up a notification channel
To send automated notifications from OpenSearch, a notification channel has to be defined. This example shows how to set up an e-mail notification channel. Before setting up a notification channel, a sender and recipient group have to be defined, which is covered in separate steps below.
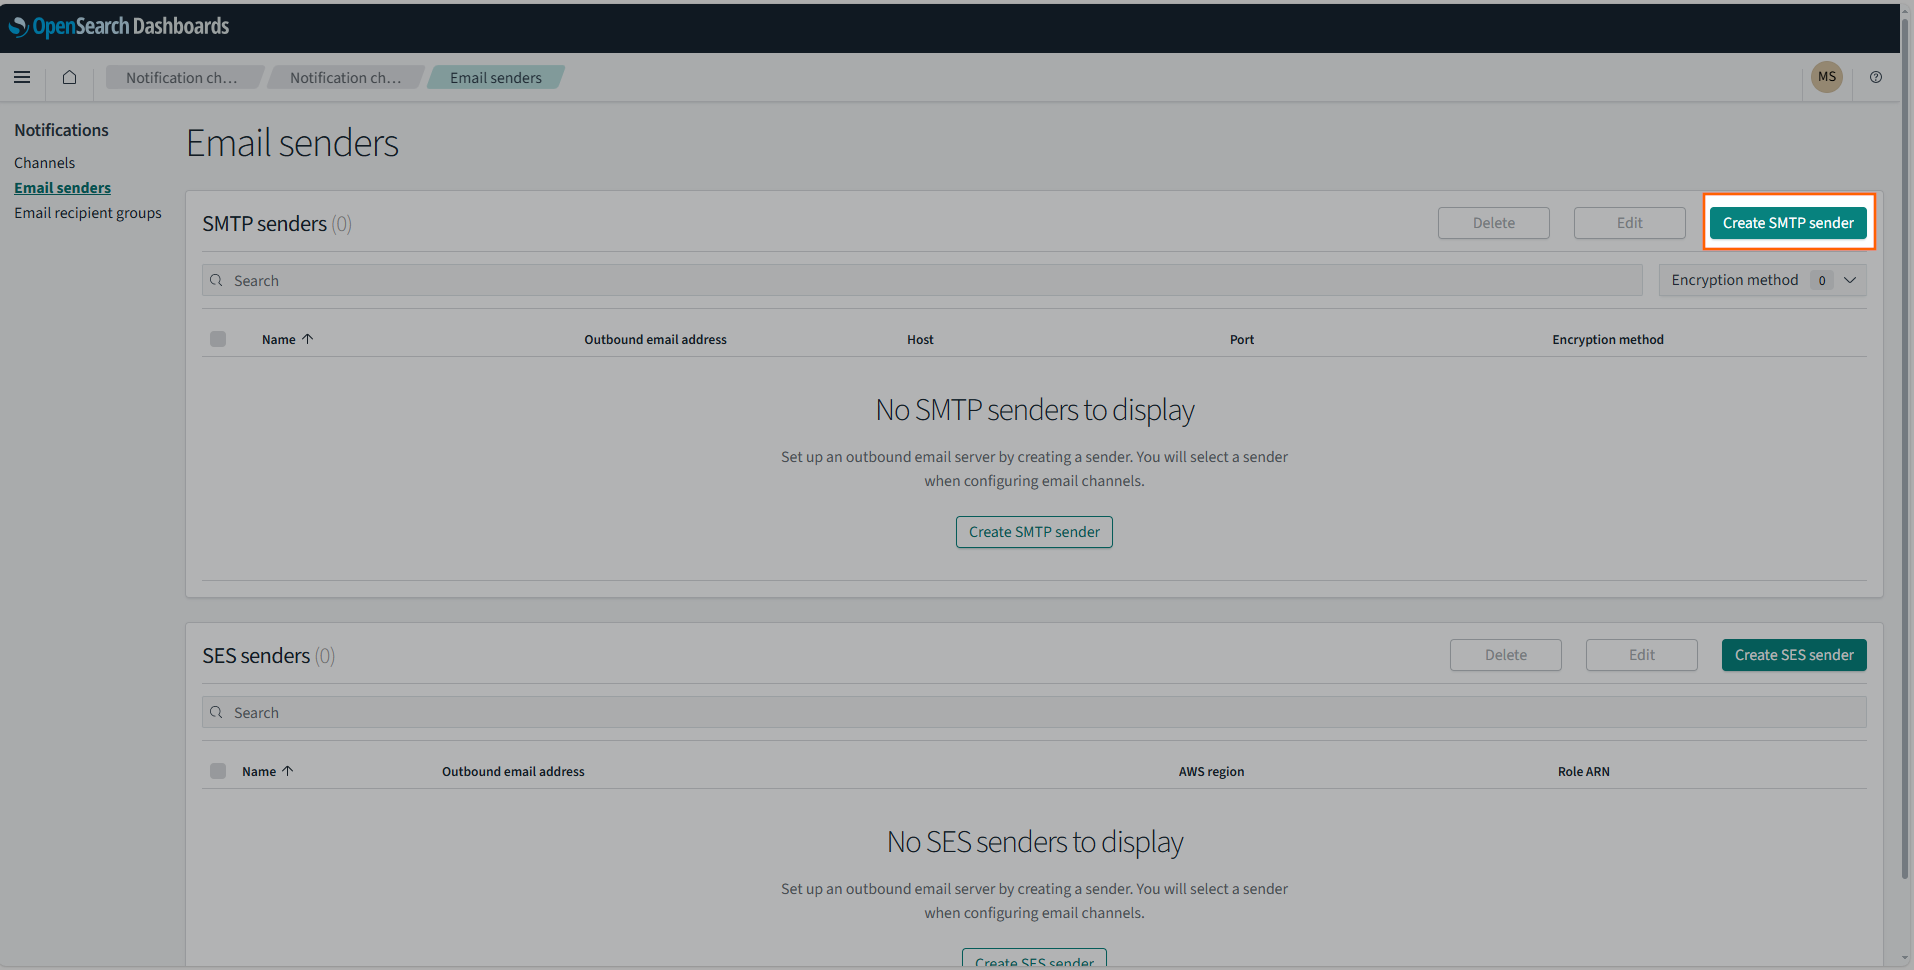
Creating an SMTP sender
SSL and OpenSearch keystore are recommended to store usernames and passwords of the sender.
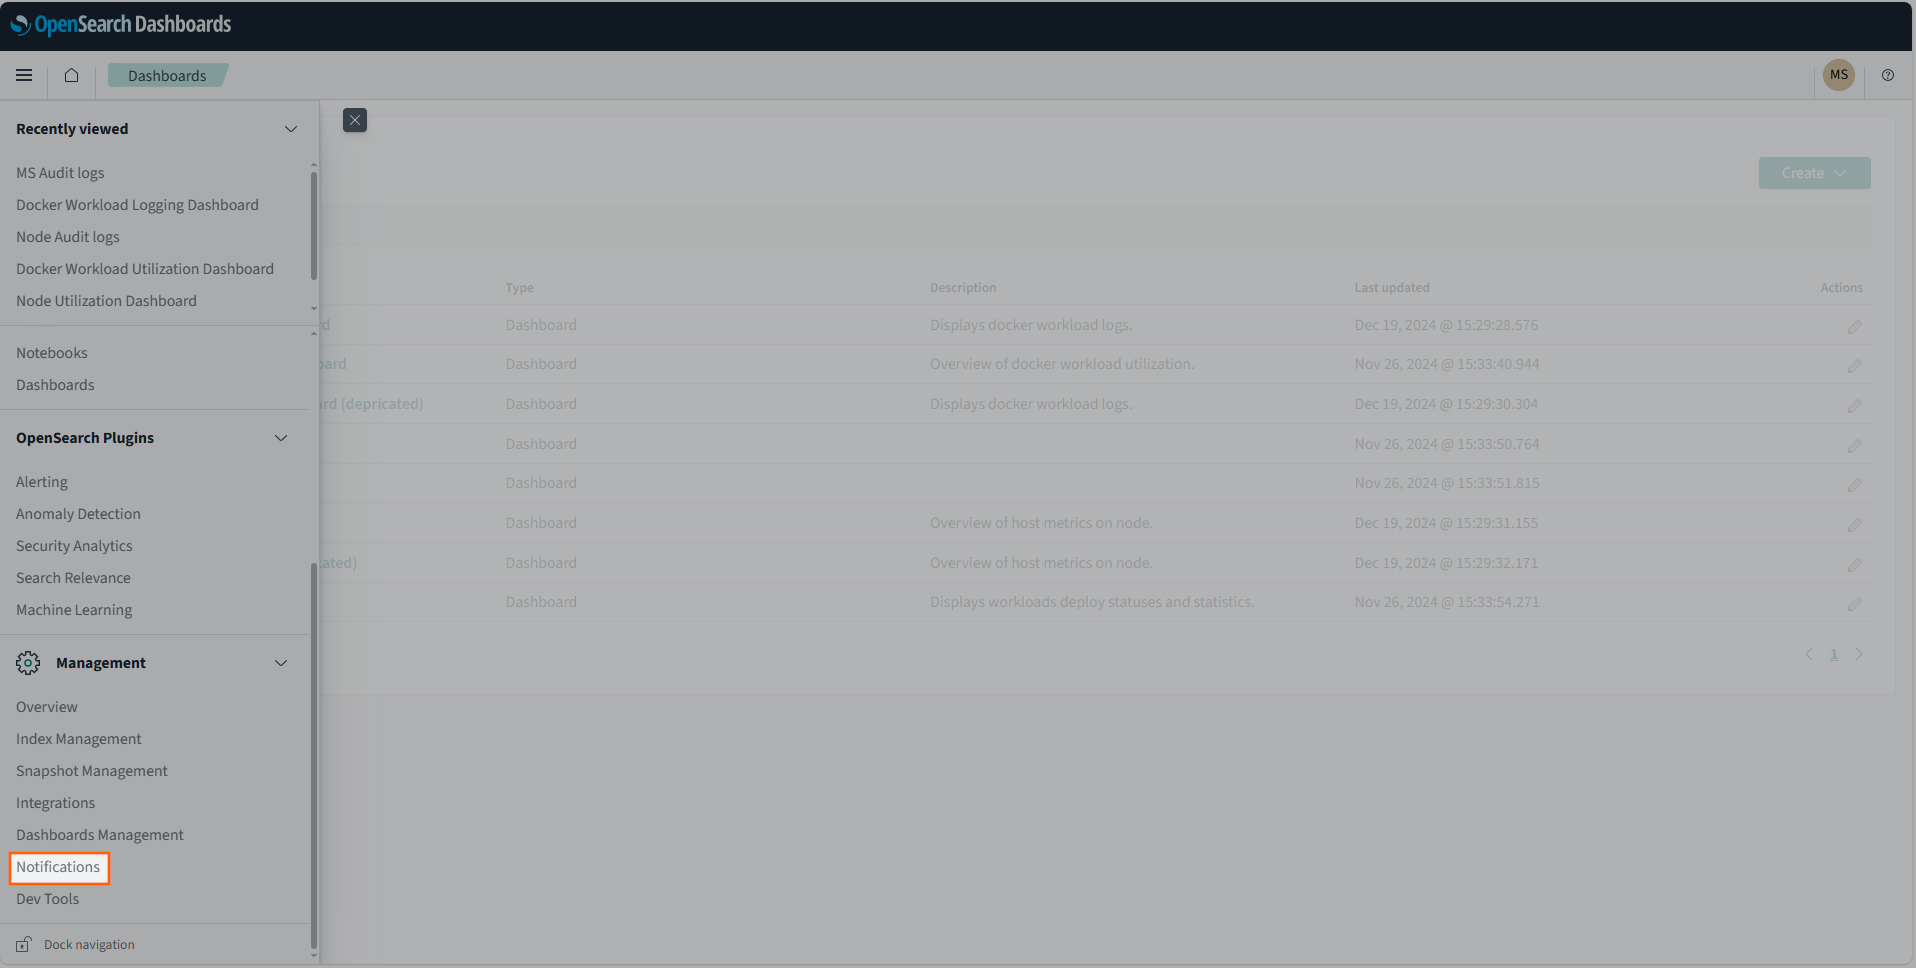
- Select the burger menu in the upper-left.
-
Select Notifications under Management.
-
Select Email senders.
-
Select Create SMTP sender on the right.
-
Enter the following information:
Setting Value Sender name nerve-alertsEmail address alerts@nerve.cloudHost mail.nerve.cloudPort 587Encryption method STARTTLS -
Select Create.
The SMTP sender is now created. However, authentication of the SMTP sender needs to be performed by Nerve Service technicians. Contact customer support through the TTTech Industrial support portal to have the SMTP sender authenticated.
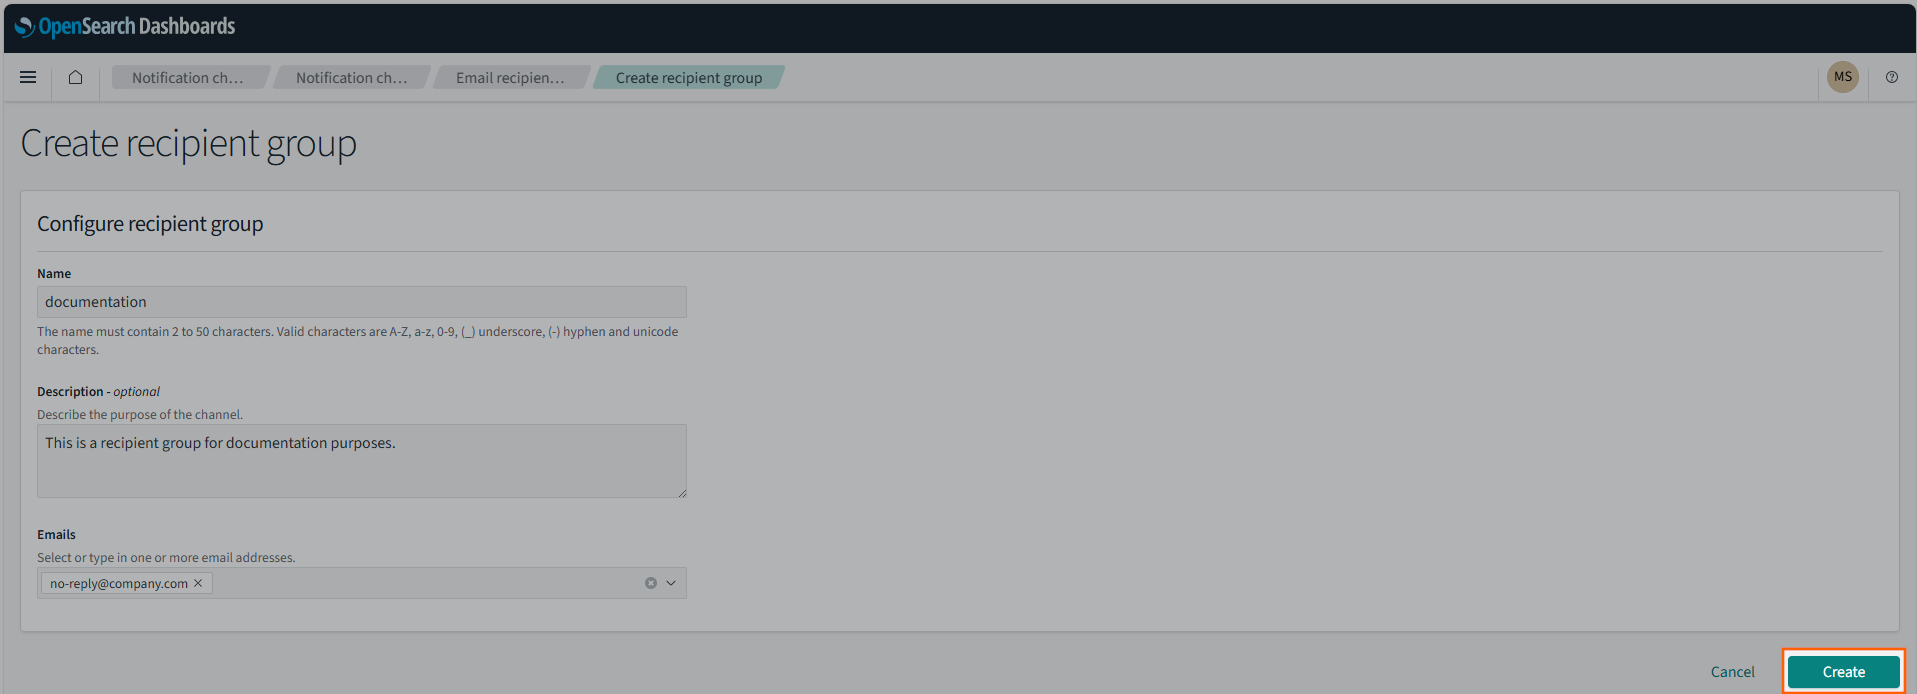
Creating a recipient group
Individuals or a group of people that should be notified about specific events are added to recipient groups.
- Select the burger menu in the upper-left.
-
Select Notifications under Management.
-
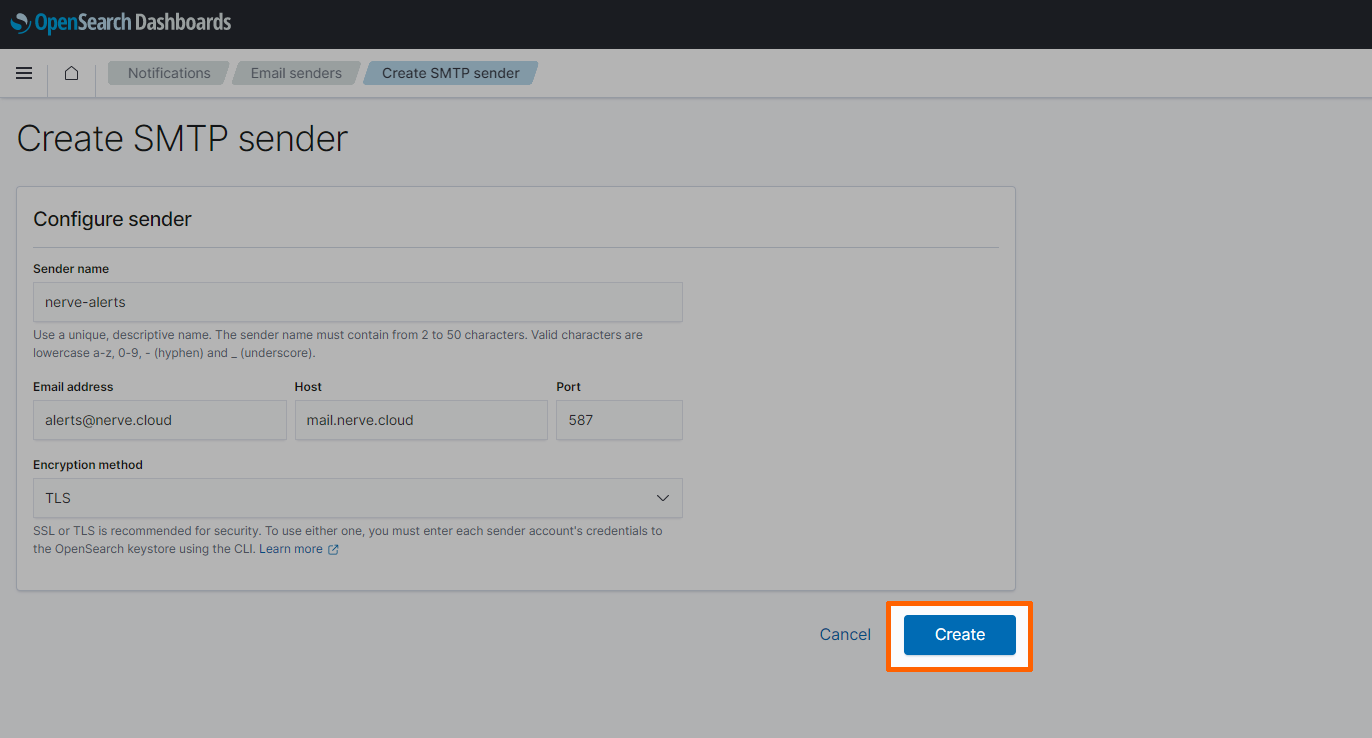
Select Email recipient groups.
-
Select Create recipient group on the right.
-
Enter the following information:
Setting Value Name Enter a name for the recipient group. This example uses documentation.Description This field is optional. Enter a description to give more information about the recipient group. Emails Add the email addresses of the recipients that should receive alerts. -
Select Create.
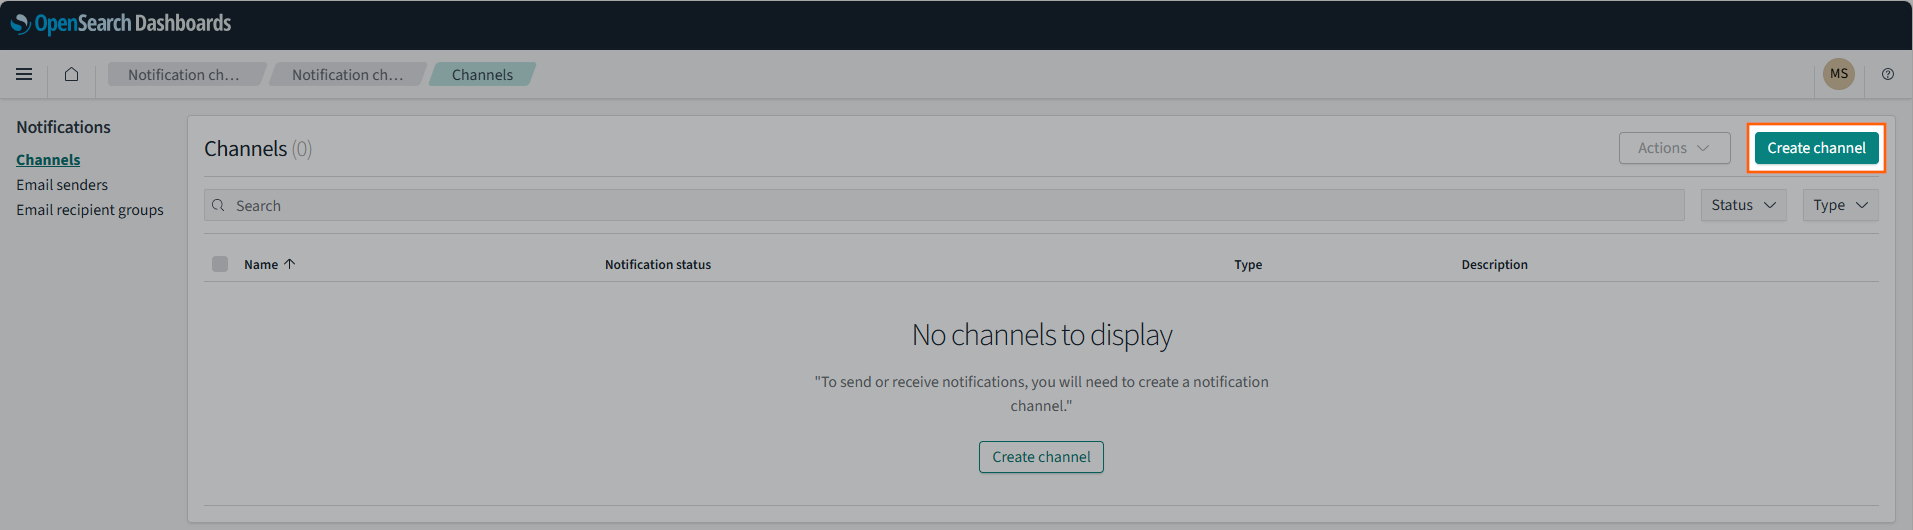
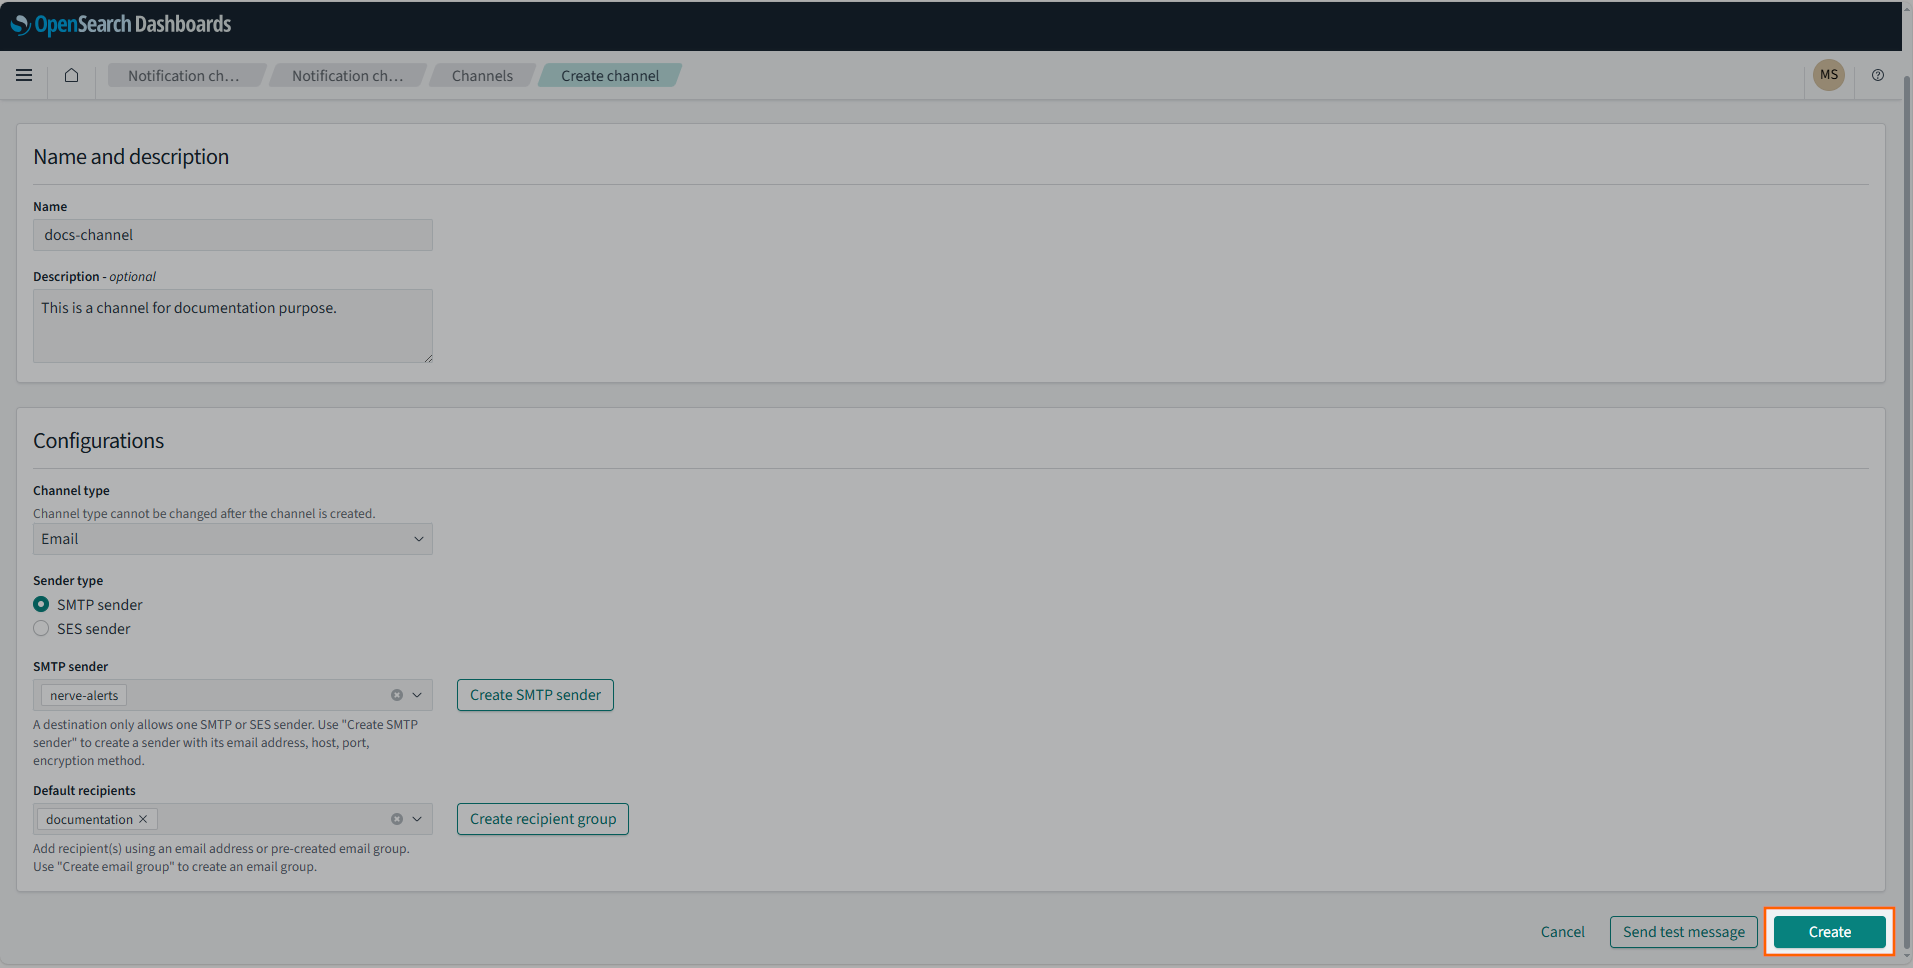
Creating a notification channel
Notification channels can be set up in multiple ways. This example sets up an e-mail notification channel using SMTP. Refer to OpenSearch documentation for more information on other types of notification channels.
- Select the burger menu in the upper-left.
-
Select Notifications under Management.
-
Select Channels.
-
Select Create channel on the right.
-
Enter the following information:
Category Settings and values Name and description Name
Enter a name for the channel. This example usesdocs-channel.
Description
This field is optional. Enter a description to give more information about the channel.Configurations Channel type
Select Email from the drop-down menu.
Sender type
Select SMTP sender.
SMTP sender
Select the sender that was created in Creating an SMTP sender above from the drop-down menu. This example usesnerve-alerts.
Default recipients
Select the recipient group that was created in Creating a recipient group above from the drop-down menu. This example usesdocumentation. -
Select Create.
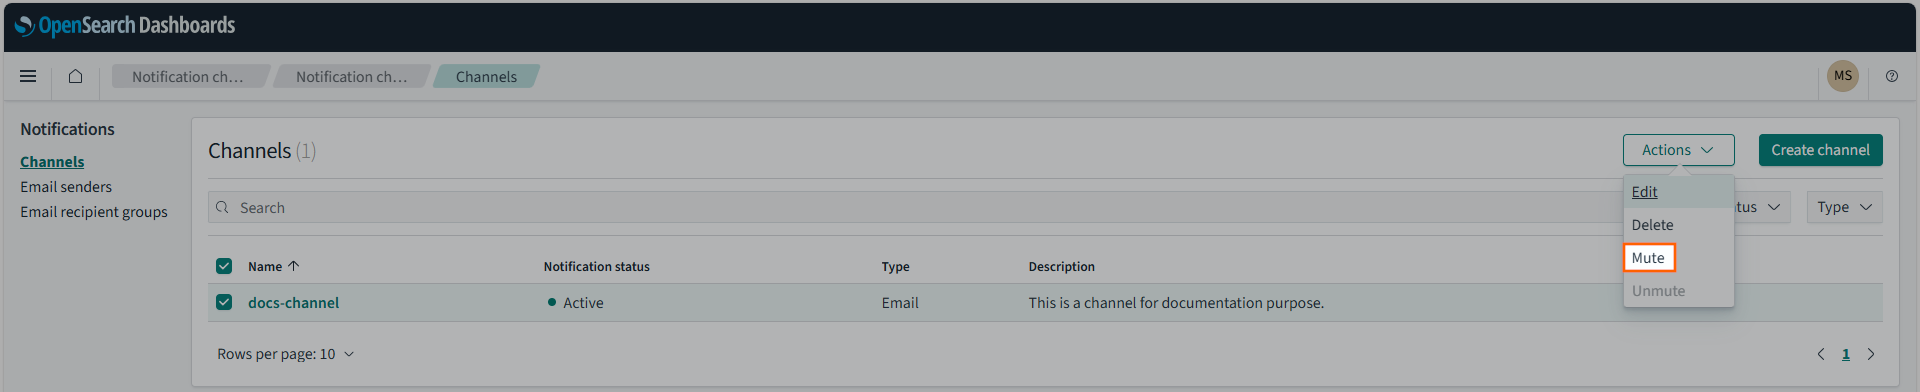
Once created, the channel is automatically activated. It is suggested to temporarily deactivate a channel in case an error has been found. If a system is being repaired, logs will likely produce further error messages that would be detected. Muting a channel helps avoiding unnecessary alarms in the meantime. Tick the checkbox next to the channel and select Mute from the Actions drop-down menu.
Setting up a monitor
Note
This example uses a query monitor to filter log messages by their contents. There are other monitor types that can be used as well. Refer to OpenSearch documentation for more information on other types of monitors.
When setting up a monitor, it is required to define a query, which is used to detect words and phrases in log messages. This query serves as the base of the alert. This query is written in a search language called query domain-specific language (DSL), which is provided by OpenSearch. Query DSL is a flexible language with a JSON interface. Refer to OpenSearch documentation for more information on how to write queries in Query DSL.
For this example, the query is set up to find specific keywords inside custom logs from a container. The query used in the instructions below looks for the phrase ERROR in all log messages, which is set by the query parameter. Replace the value with other words or phrases to search for different terms.
- Select the burger menu in the upper-left.
-
Select Alerting under OpenSearch Plugins.
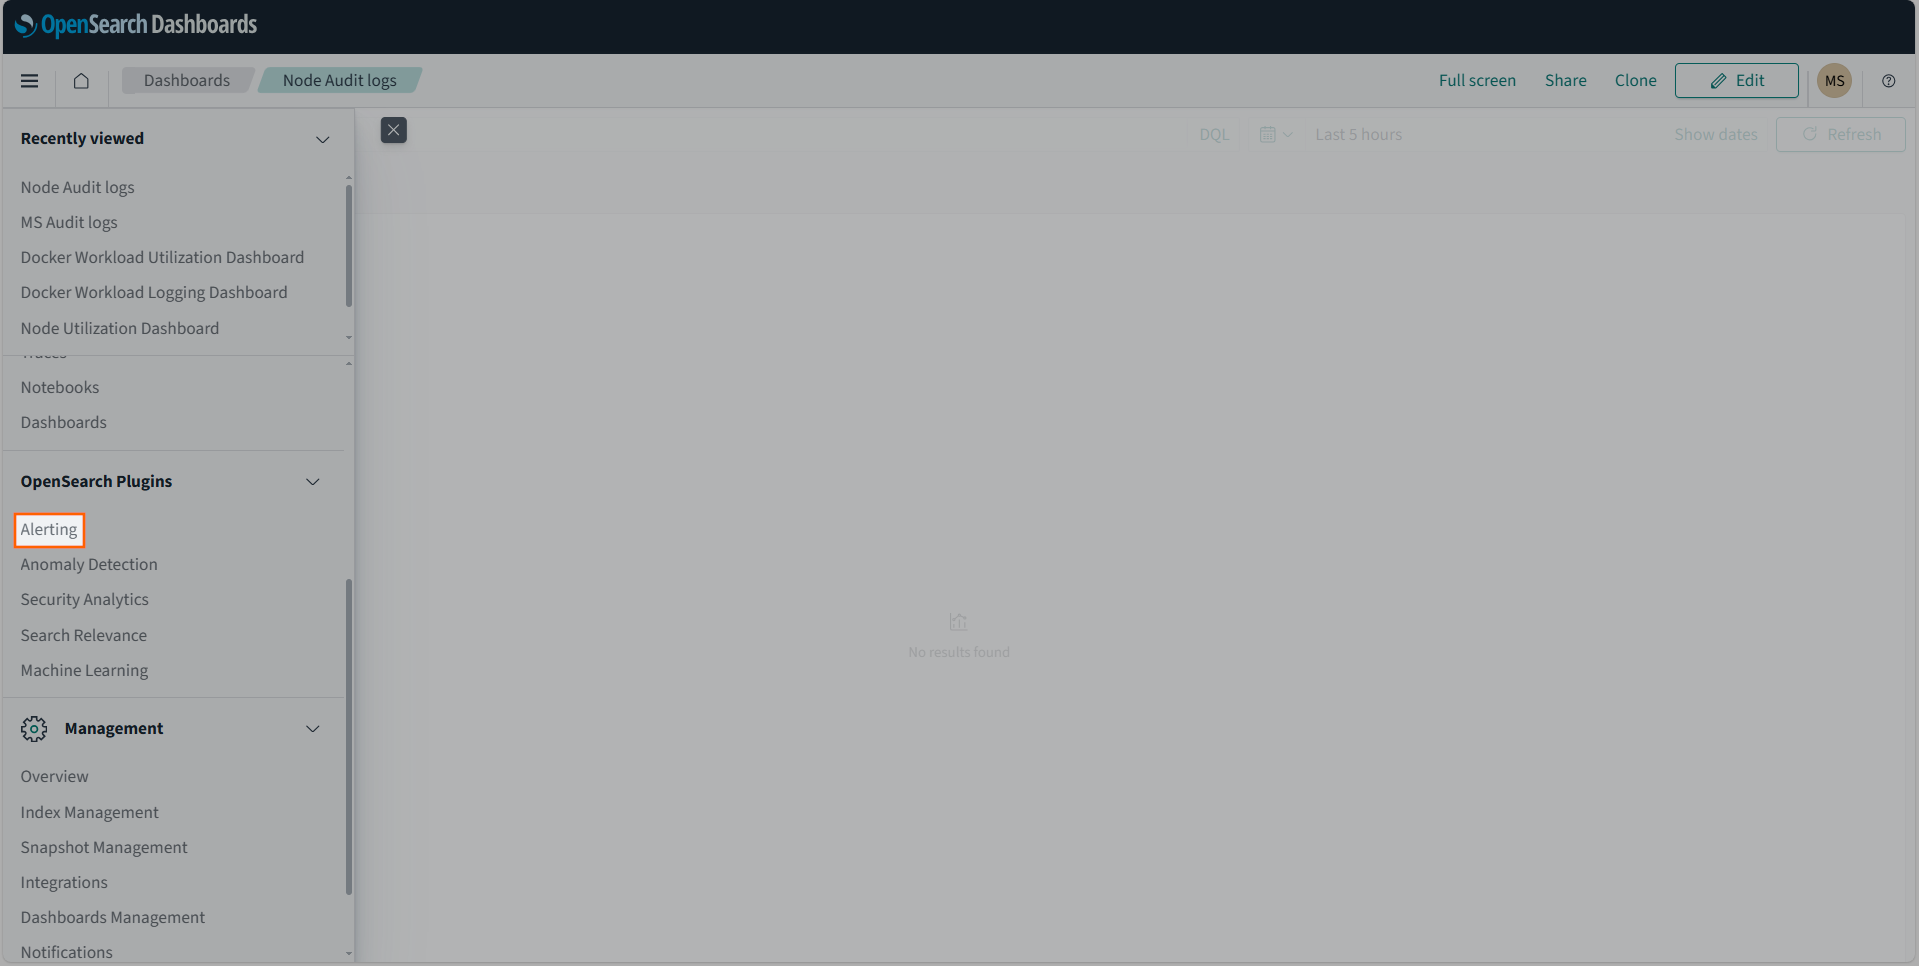
-
Select the Monitors tab.
-
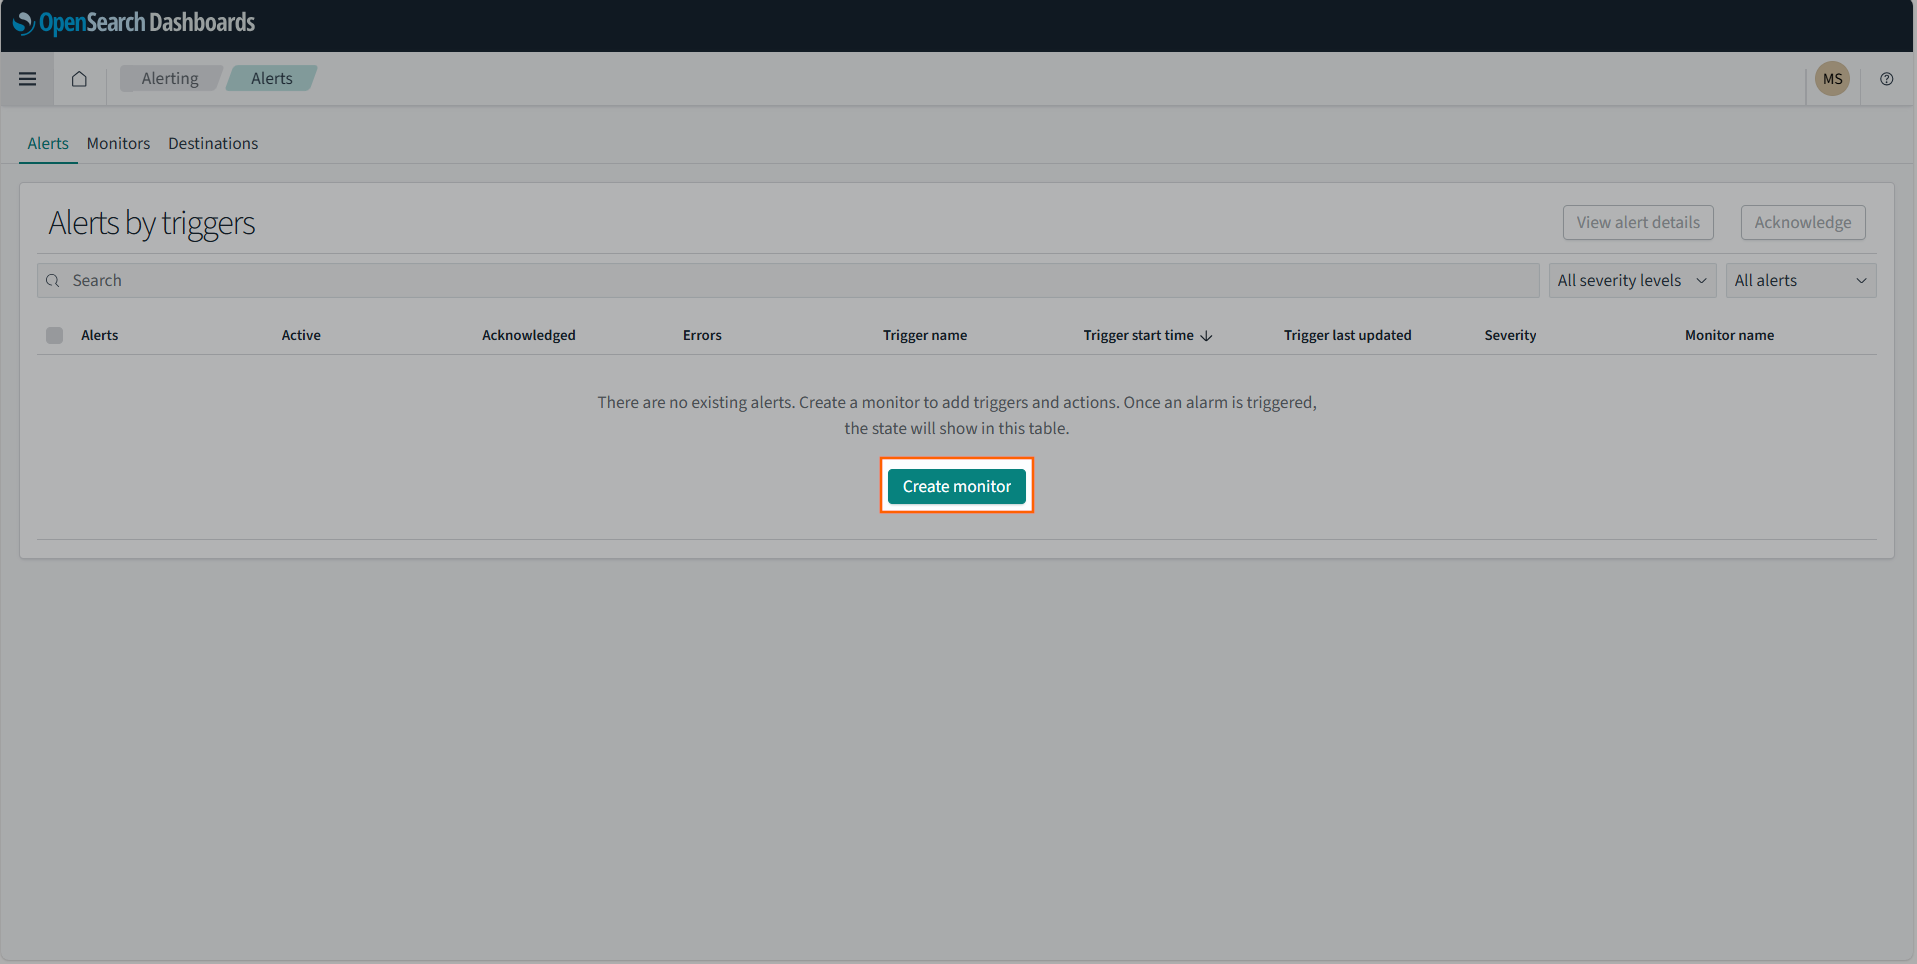
Select Create monitor.
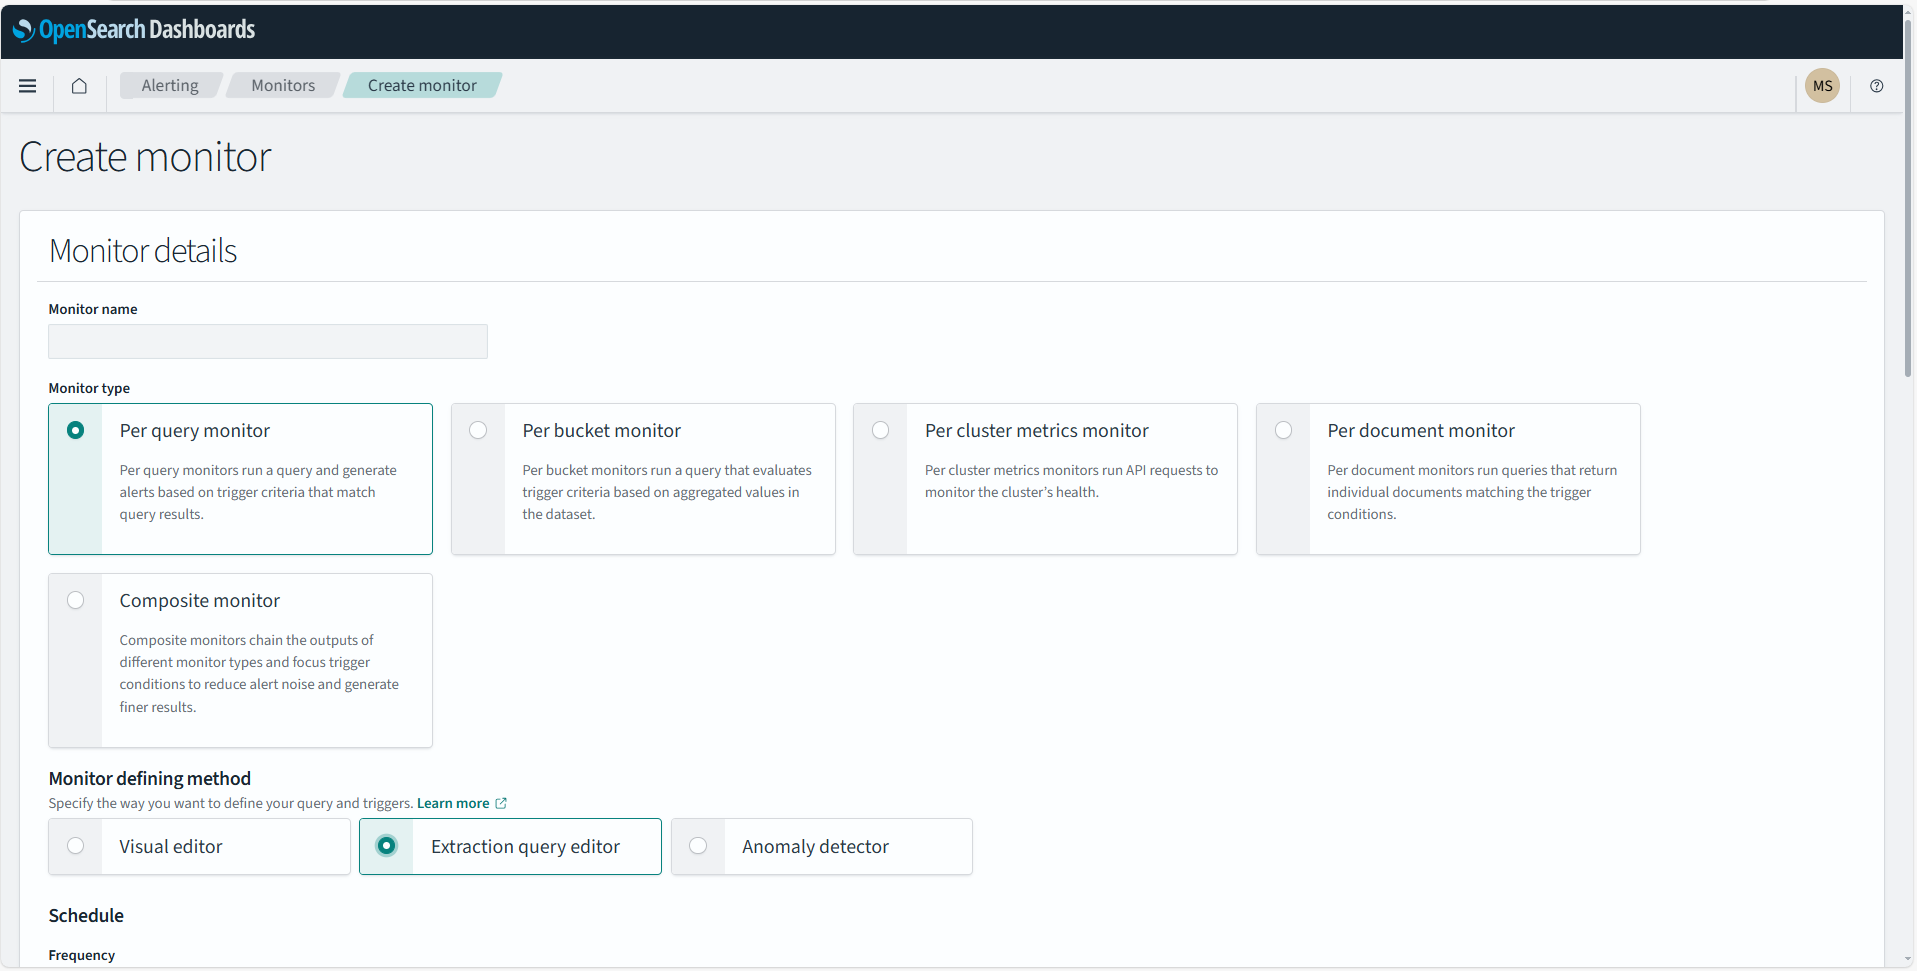
-
Enter a Monitor name. This example uses
docs-monitor. - Select Per query monitor under Monitor type.
-
Select Extraction query editor under Monitor defining method.
-
Enter the index you want to log under Select data to collect the stored data. From node side there following indexes available:
node-logs*- logs from syslog (only ones generated by OVDM)docker-logs*- logs produced by deployed workloadsnode-audit-logs*- audit logs from OVDM
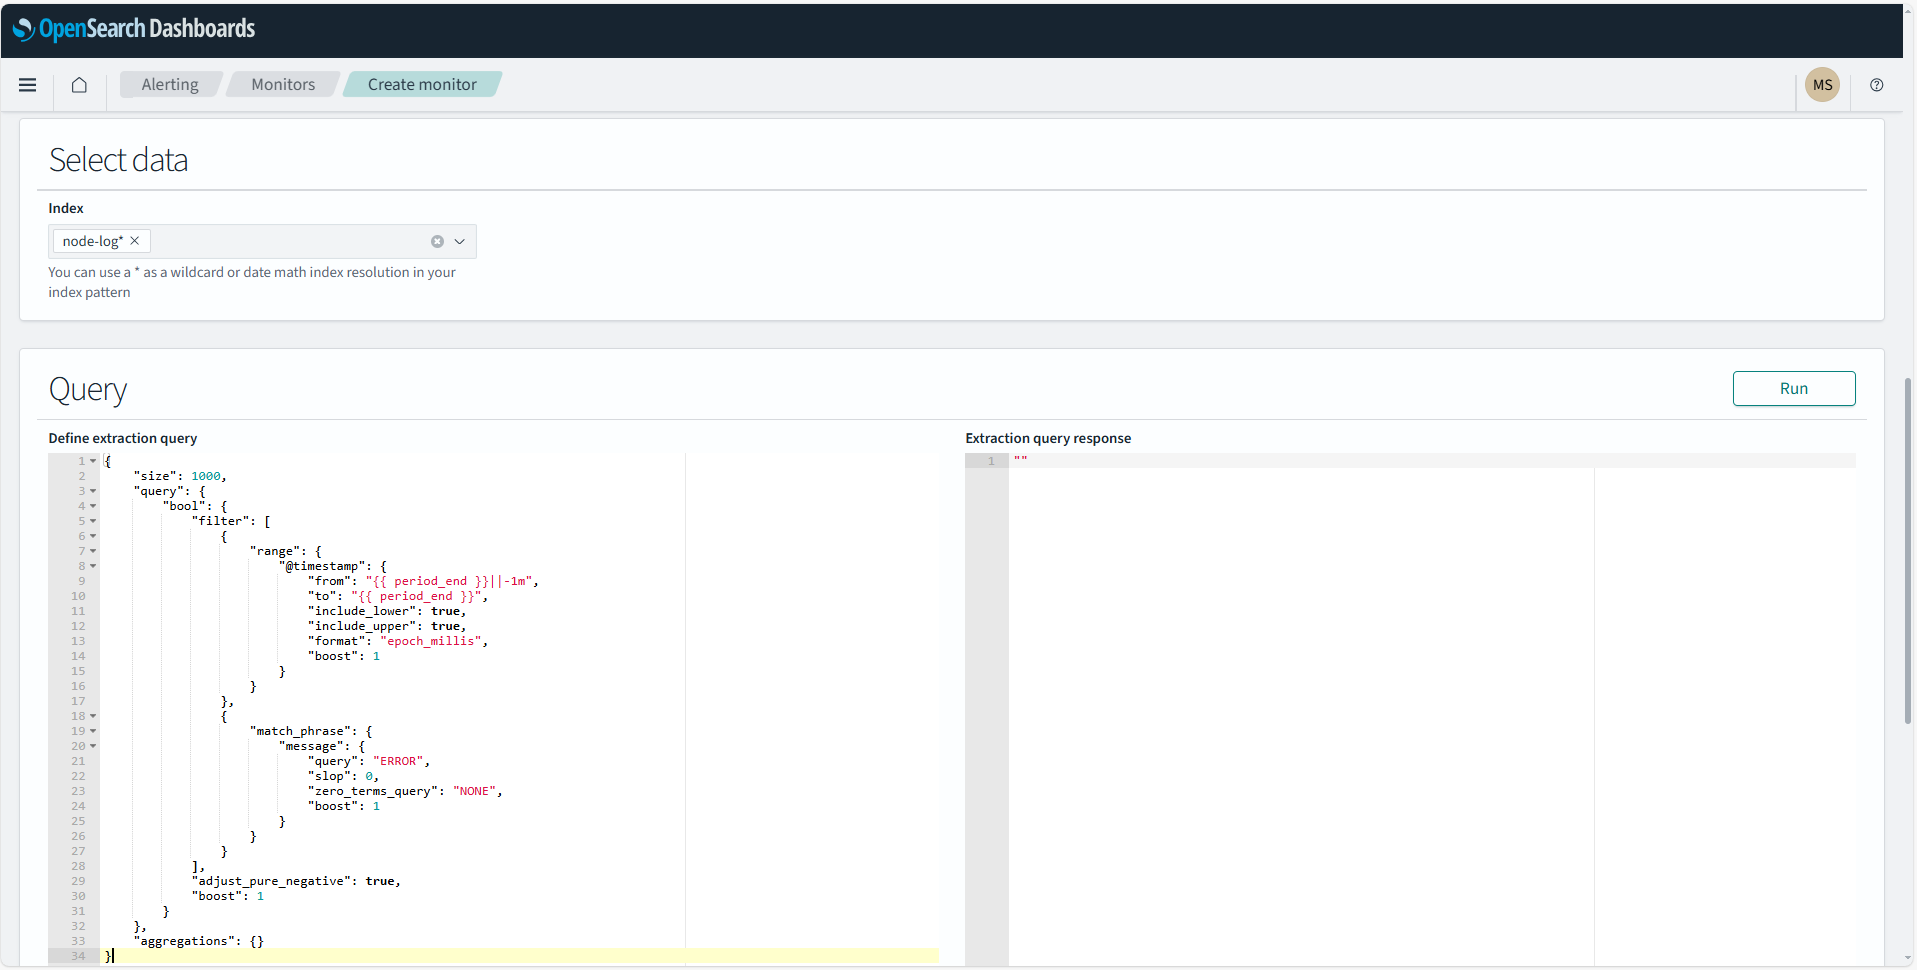
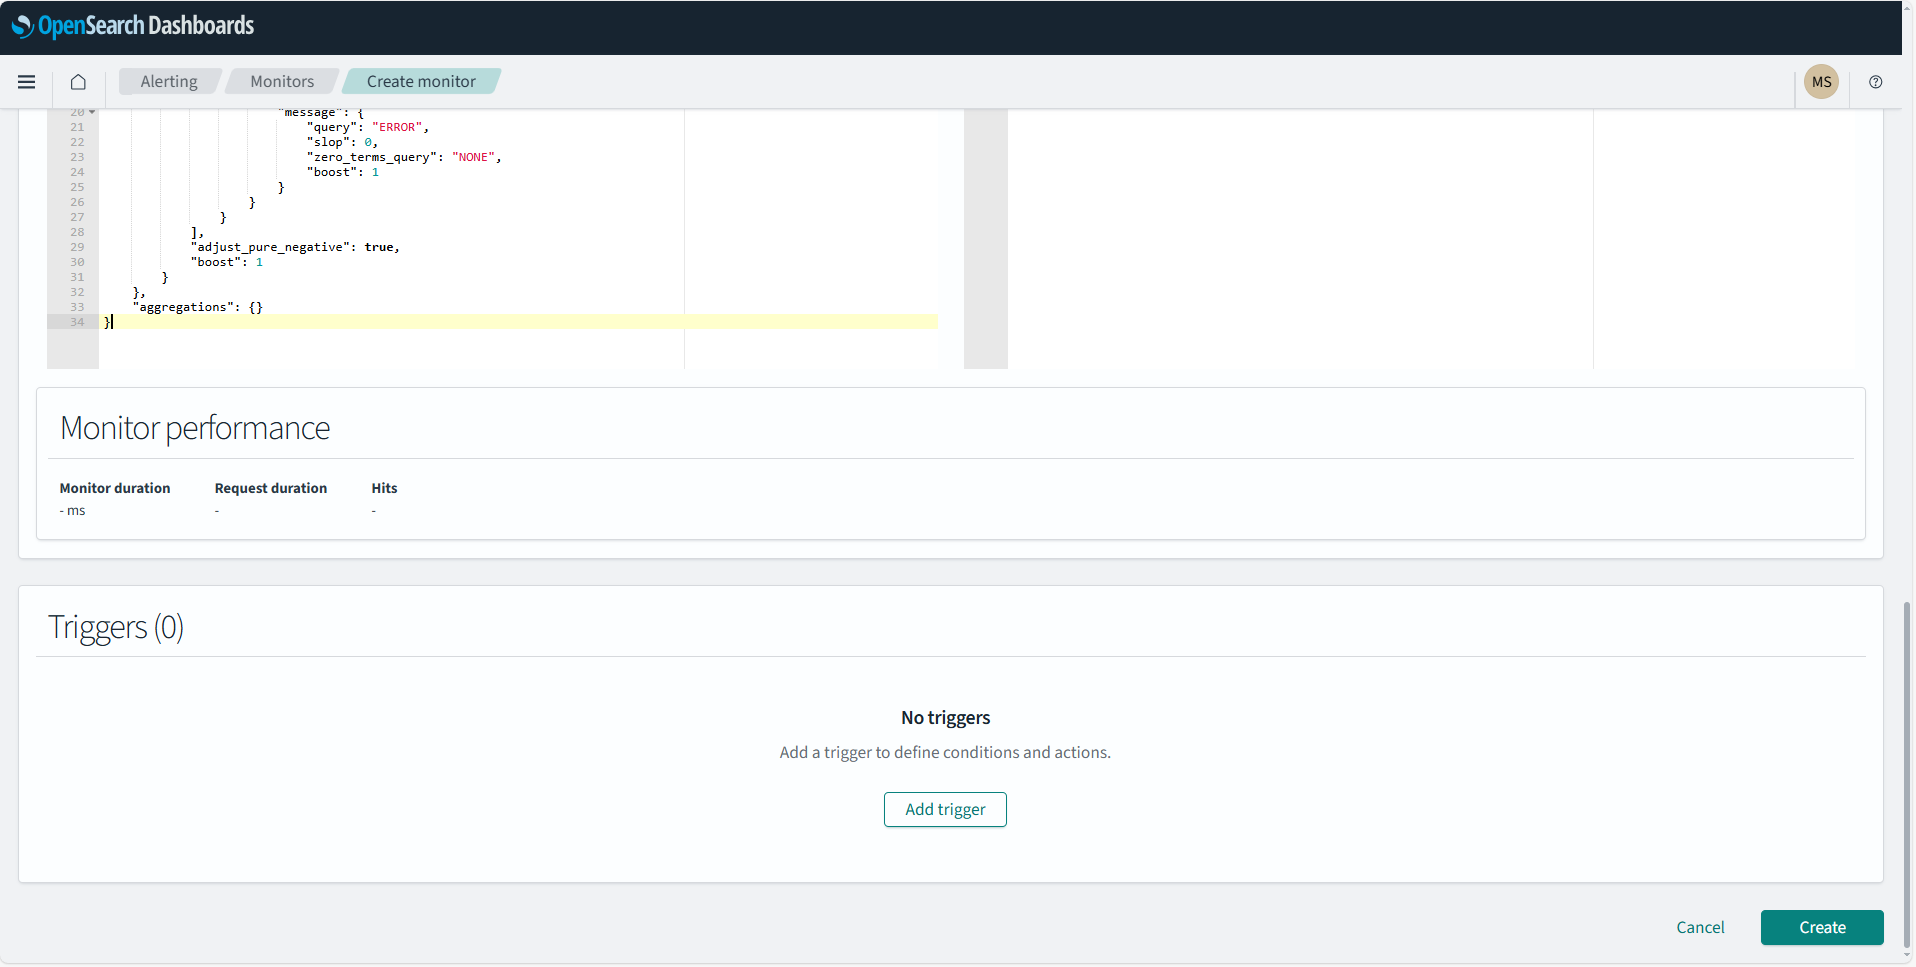
{
    "size": 1000,
    "query": {
        "bool": {
            "filter": [
                {
                    "range": {
                        "@timestamp": {
                            "from": "{{ period_end }}||-1m",
                            "to": "{{ period_end }}",
                            "include_lower": true,
                            "include_upper": true,
                            "format": "epoch_millis",
                            "boost": 1
                        }
                    }
                },
                {
                    "match_phrase": {
                        "message": {
                            "query": "ERROR",
                            "slop": 0,
                            "zero_terms_query": "NONE",
                            "boost": 1
                        }
                    }
                }
            ],
            "adjust_pure_negative": true,
            "boost": 1
        }
    },
    "aggregations": {}
}
As mentioned above, the query detects log messages that contain the phrase ERROR in the last minute. Since it is executed every minute, it will detect each error only once. Continue with the next section to configure a trigger with a corresponding action.
Setting trigger and action
The trigger condition controls when notifications are sent through the notification channel. The condition is using the results of the query which was set up in Setting up a monitor above.
When the monitored event is triggered, an action is performed as a result. In this example, an e-mail is sent to the notification channel that was created in Setting up a notification channel above.
-
Select Add trigger.
-
Enter a Trigger name. This example uses
docs-trigger. - Select the desired Severity level from the drop-down menu.
-
Define a trigger condition. For this example, the condition is set to trigger if there are more than five errors detected in the last minute:
ctx.results[0].hits.total.value > 5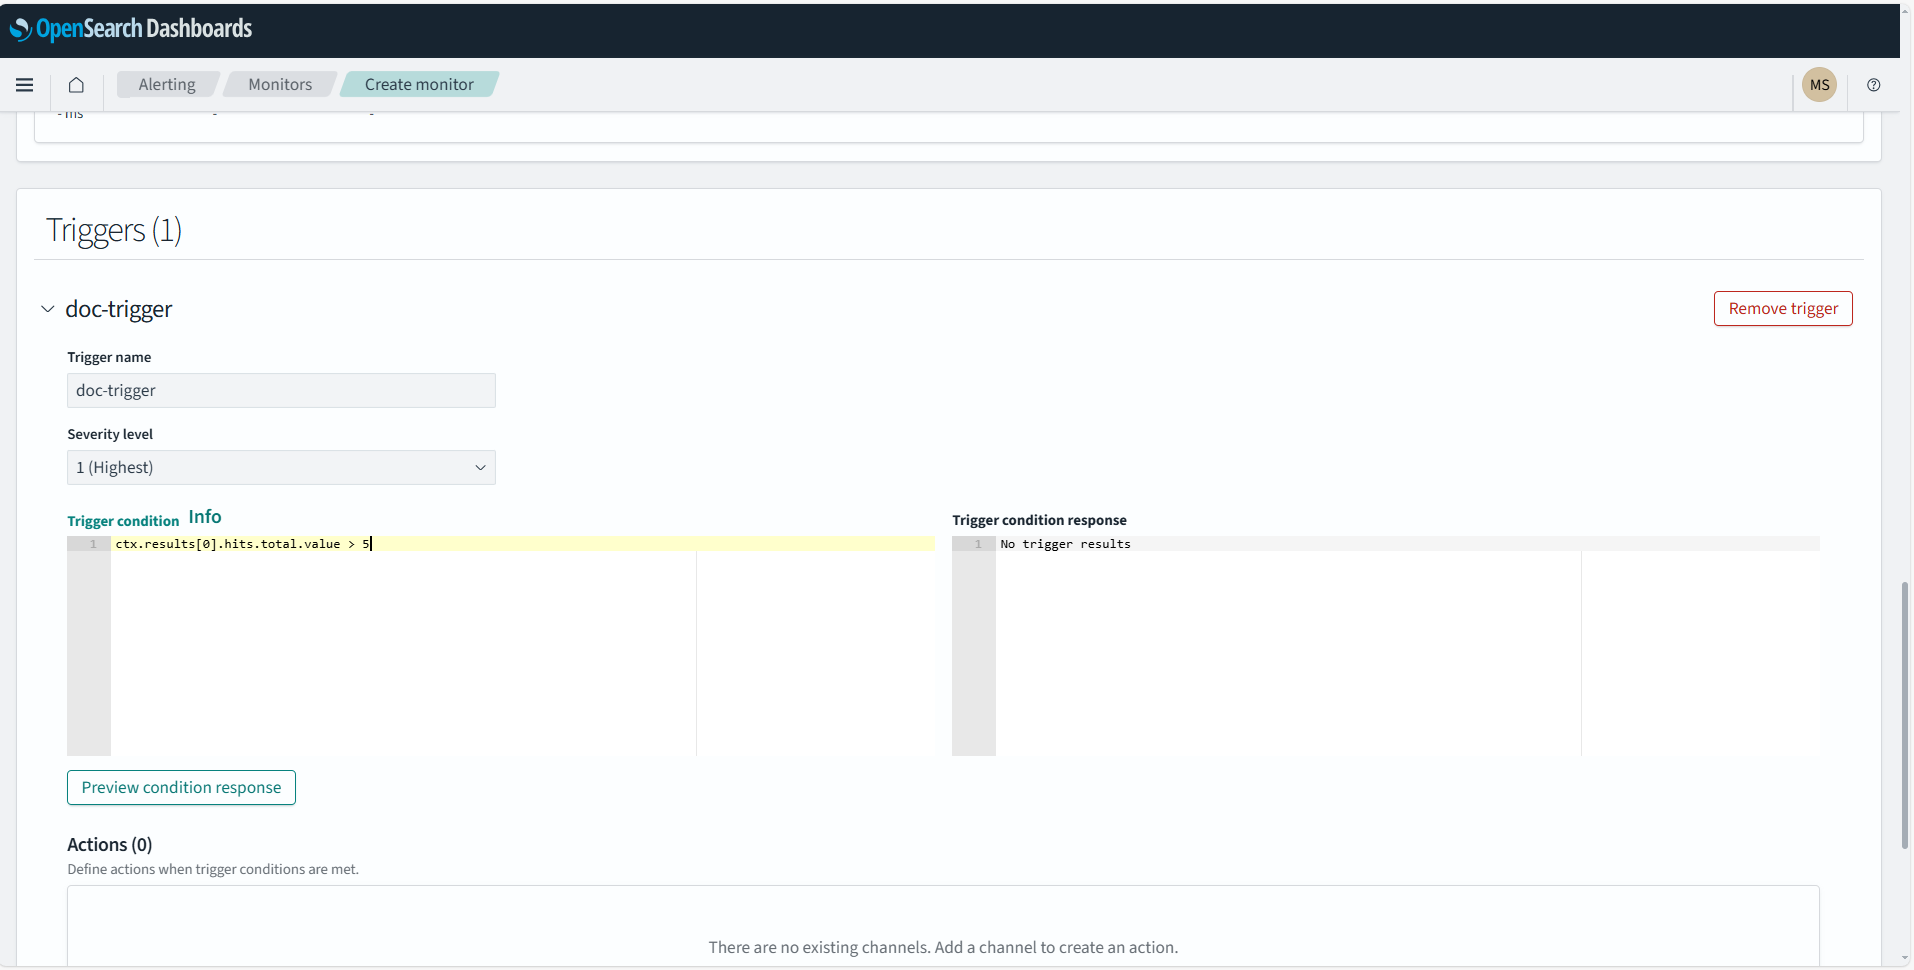
-
Scroll down to reach the Actions (1) section.
-
Enter the following information:
Setting Value and description Action name Enter a name for the action. This example uses alerting-action.Channels Select the channel that was created in Setting up a notification channel above. This example uses docs-channel.Message subject Enter a message subject that will be the subject of the e-mail notification. Message Enter a message in the Message field that will be the body of the e-mail notification. Some information using variables is already pre-filled. Refer to OpenSearch documentation for more information on how to use variables in the message. 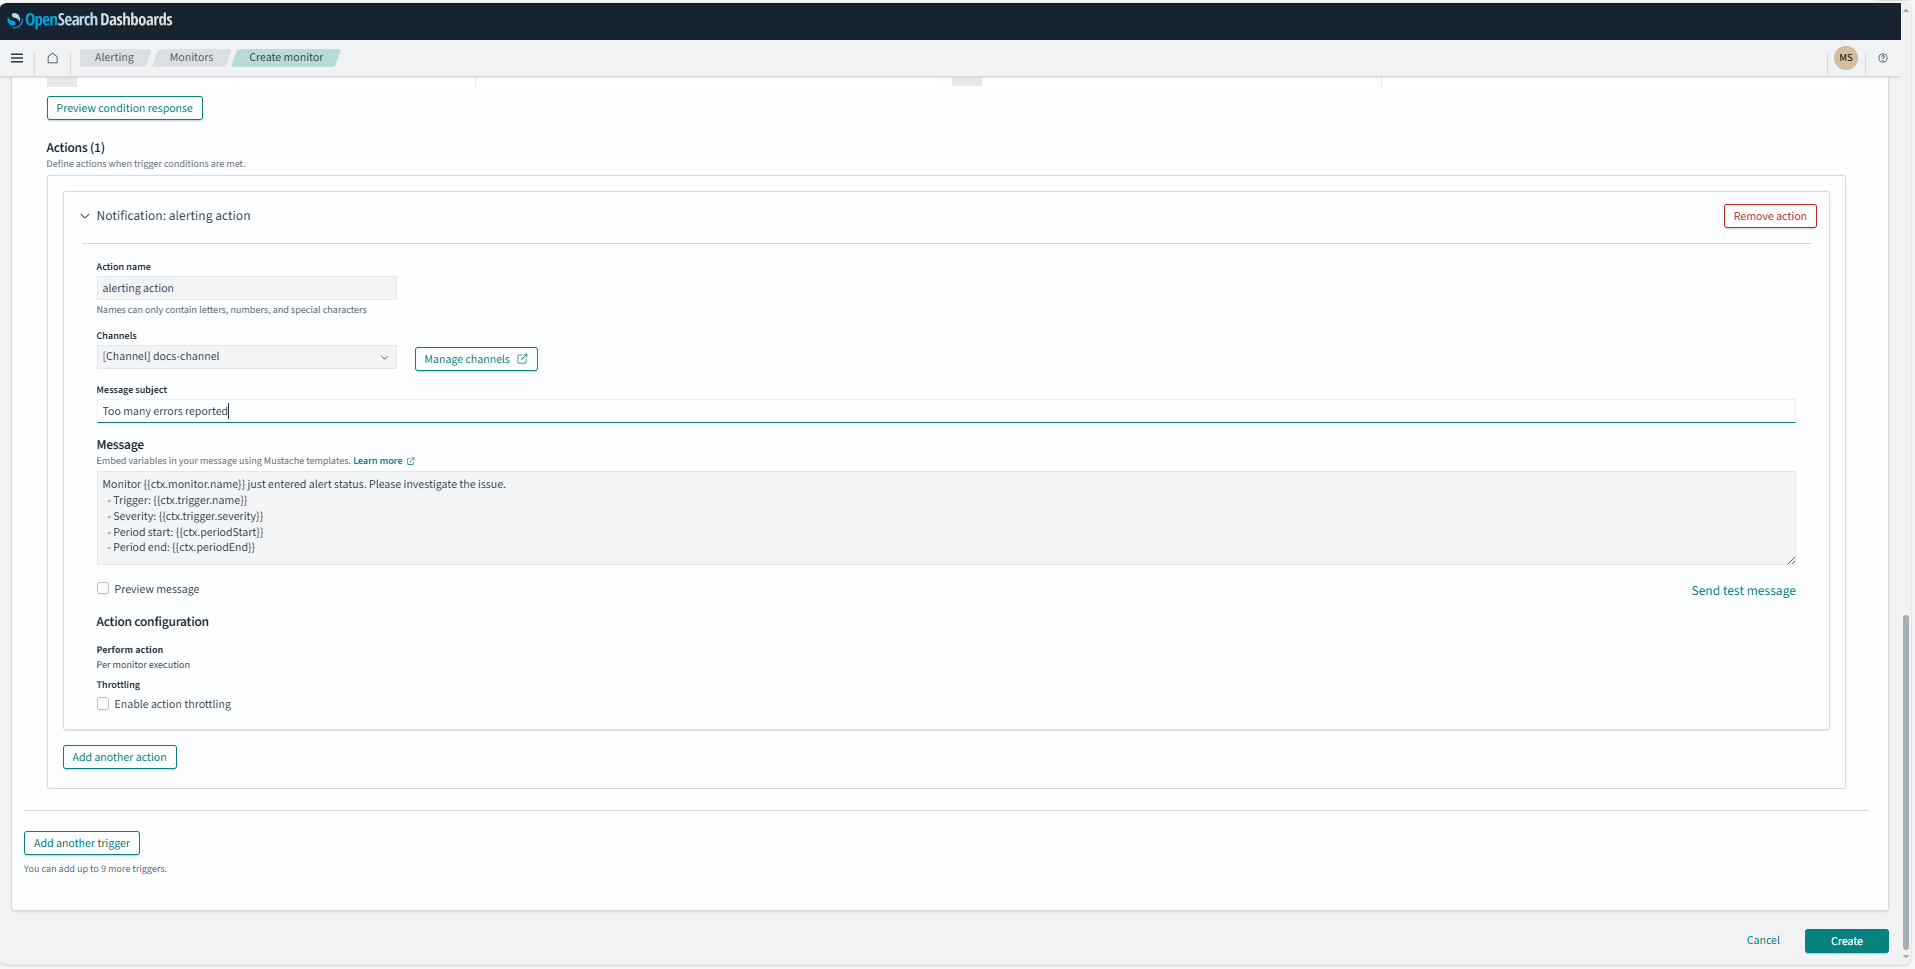
-
Select Create at the bottom of the page.
With this, a monitor based on a query is created that is executed every minute and detects all log messages containing a key word or phrase. An alarm is triggered if more than five messages per minute are detected and an e-mail with error details is sent to a recipient group.
Access Dashboards and Audit logs in OpenSearch
Once you have opened OpenSearch, you can also navigate within this application to the predefined dashboards and logs.
-
Select the burger menu icon ☰ to open the menu in OpenSearch.
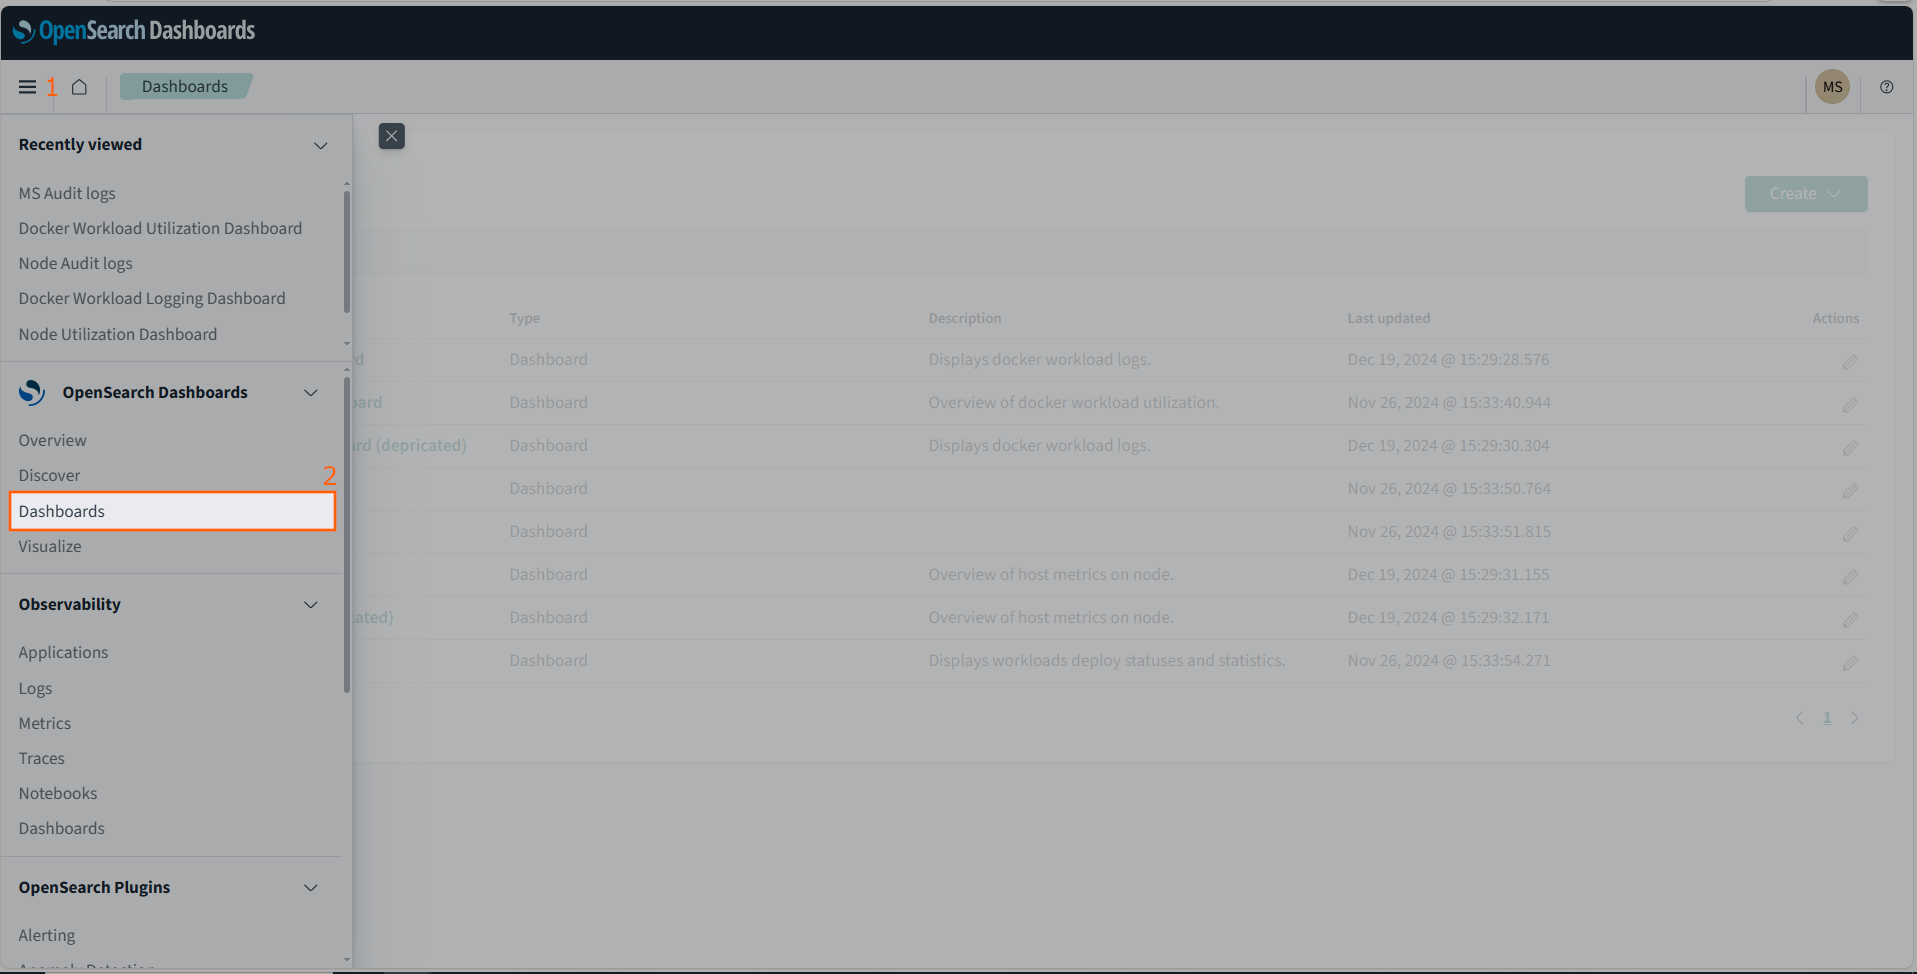
-
Select Dashboards to view all predefined dashboards and logs.
-
Choose the dashboard you want to view.
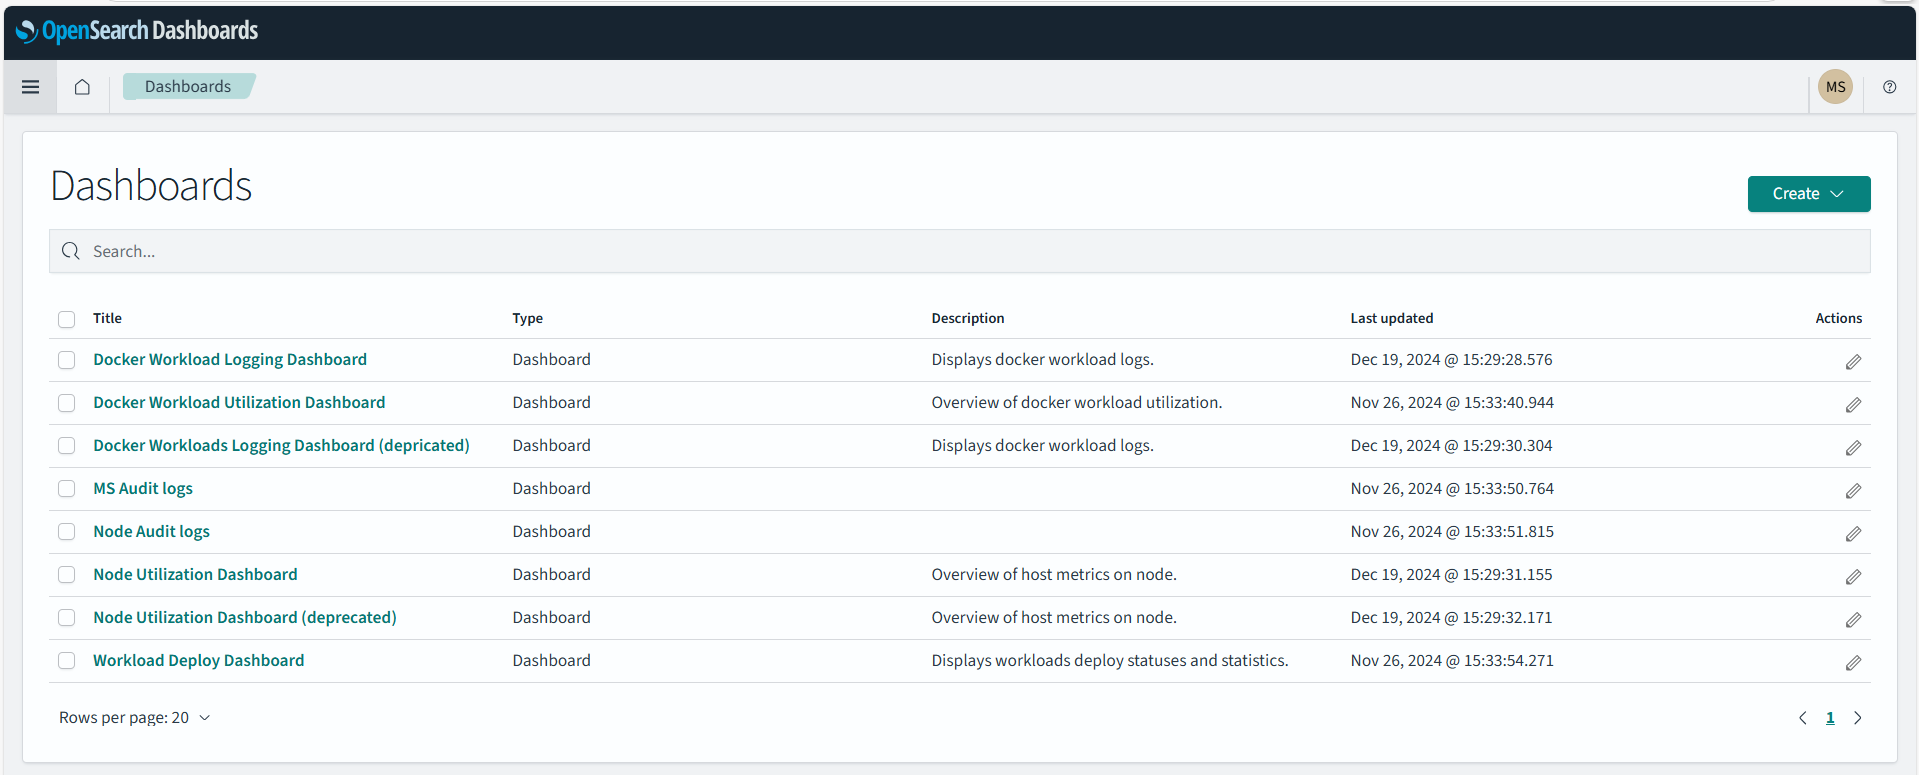
You can find the detailed description of each dashboard or log under the corresponding headline.
- Node system logs
- Node system monitoring
- Docker workload logging
- Docker workload monitoring
- Audit logs for the Management System
- Node Audit Logs
- Management System logs
Accessing workload logs in the Local UI
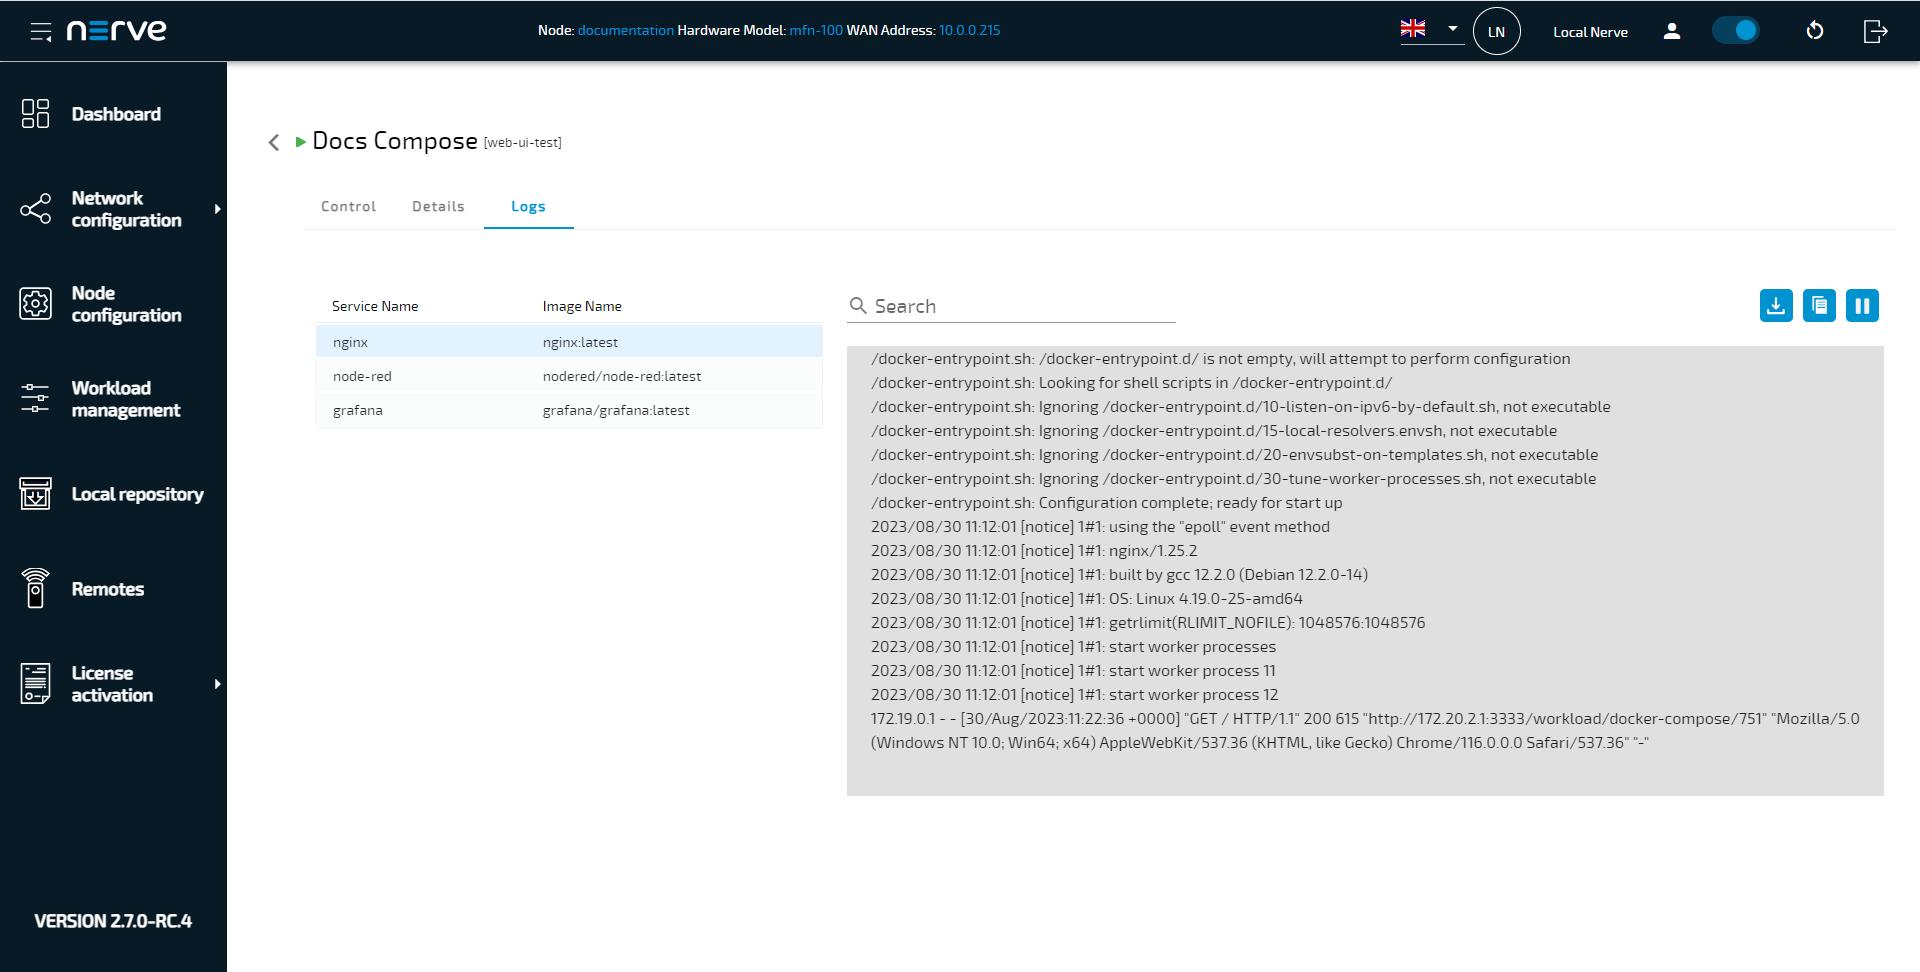
Logs can be accessed locally through the Local UI. There, logs are accessed separately for each Docker workload or Docker Compose service.
- Access the Local UI.
-
Select Workload management in the navigation on the left.
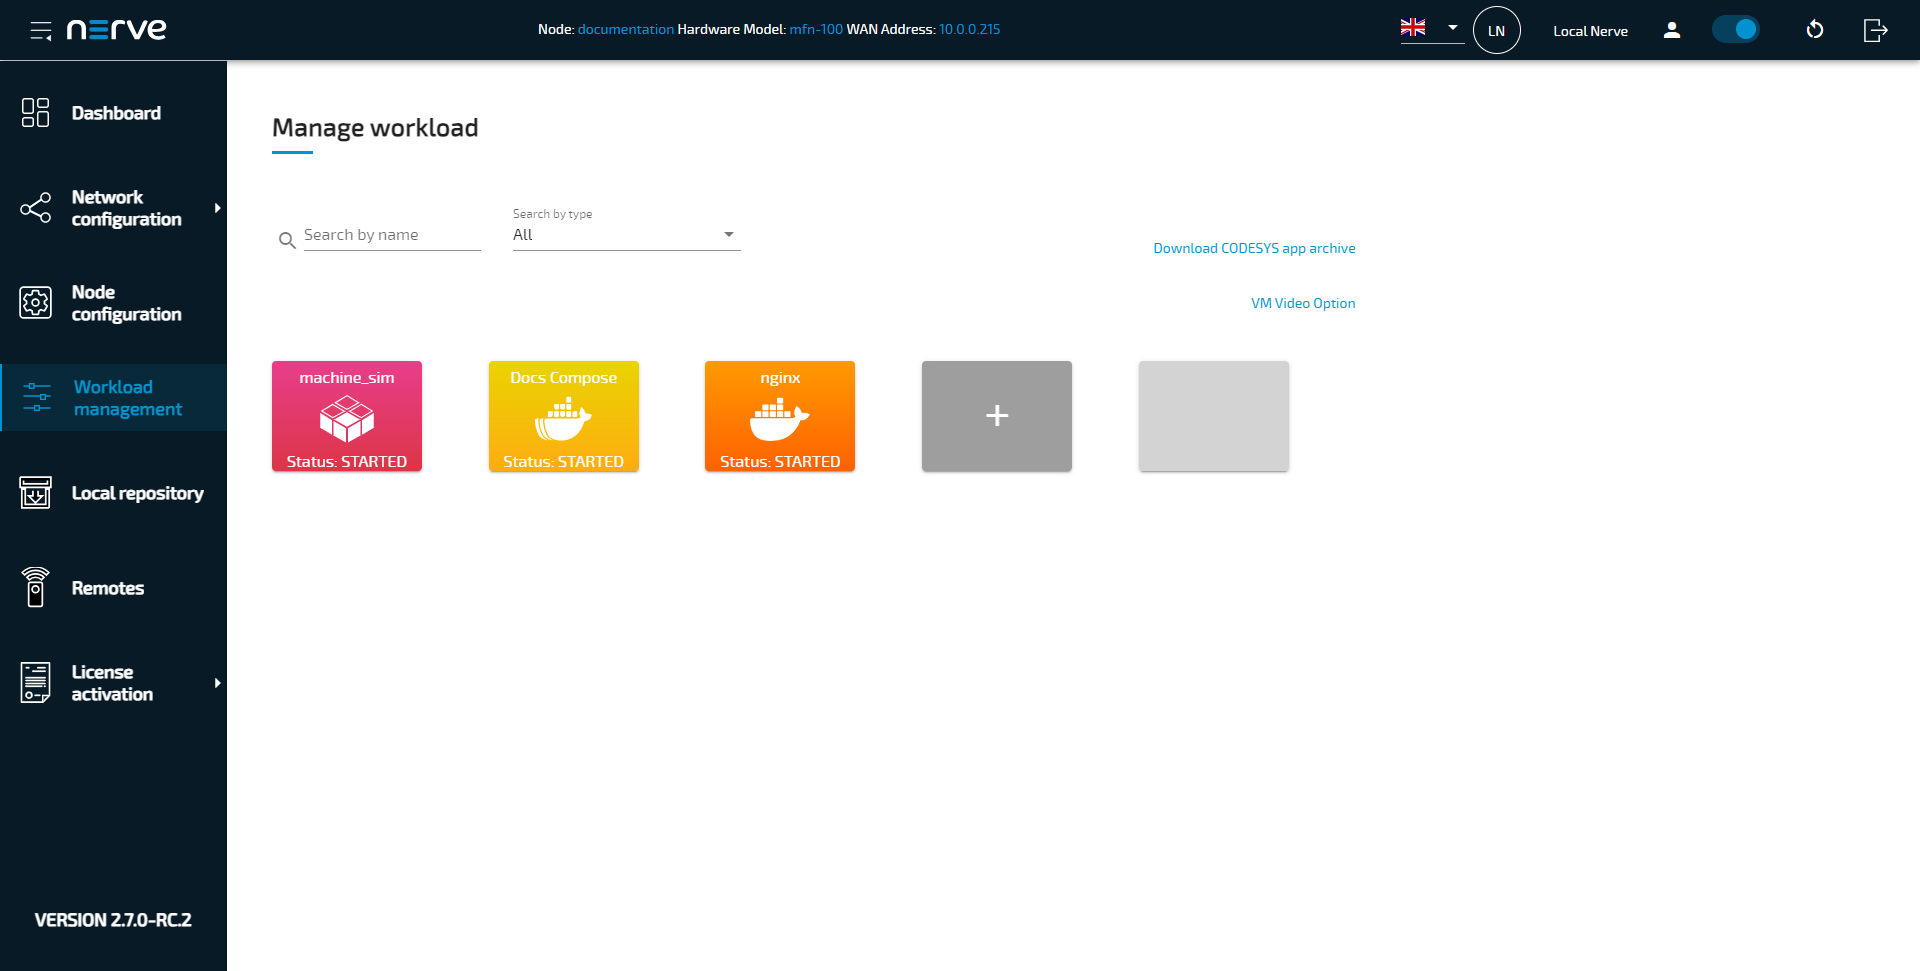
-
Select a Docker or Docker Compose workload.
-
Select the Logs tab.
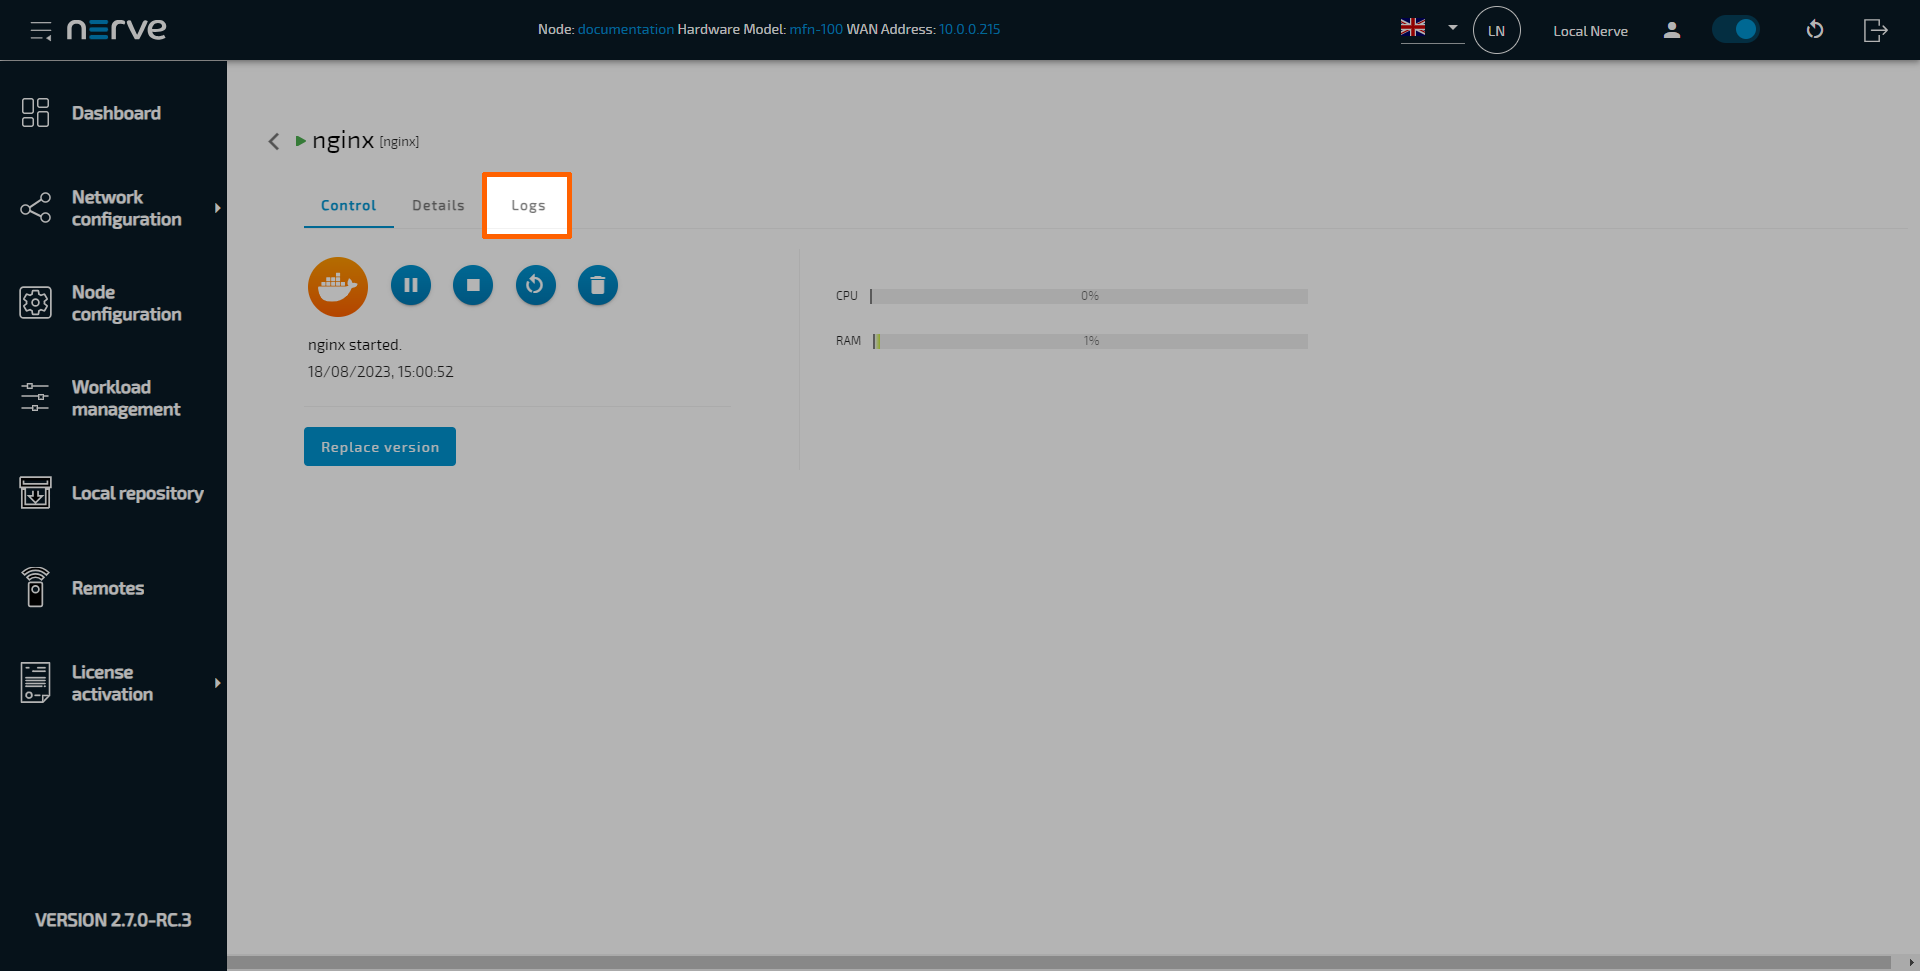
Log message are displayed in a large message window. Take note of the following functions:
| item | Description |
|---|---|
| Search bar | Enter a string here to search the log messages for the entered string. |
| Download icon | Select the Download icon to download the full logs of this container. This will download the logs as a single LOG file if the logs have not exceeded the limit for one file. Once the limit has been exceeded, the download will be a ZIP file containing multiple LOG files. |
| Copy icon | Select the Copy icon to copy the container's logs into the clipboard. Note that this copies the last 500 lines of the log. |
| Pause icon | Select Pause icon to stop new logs from coming in. Select the icon again, now a Play icon, to resume logs coming in again. |
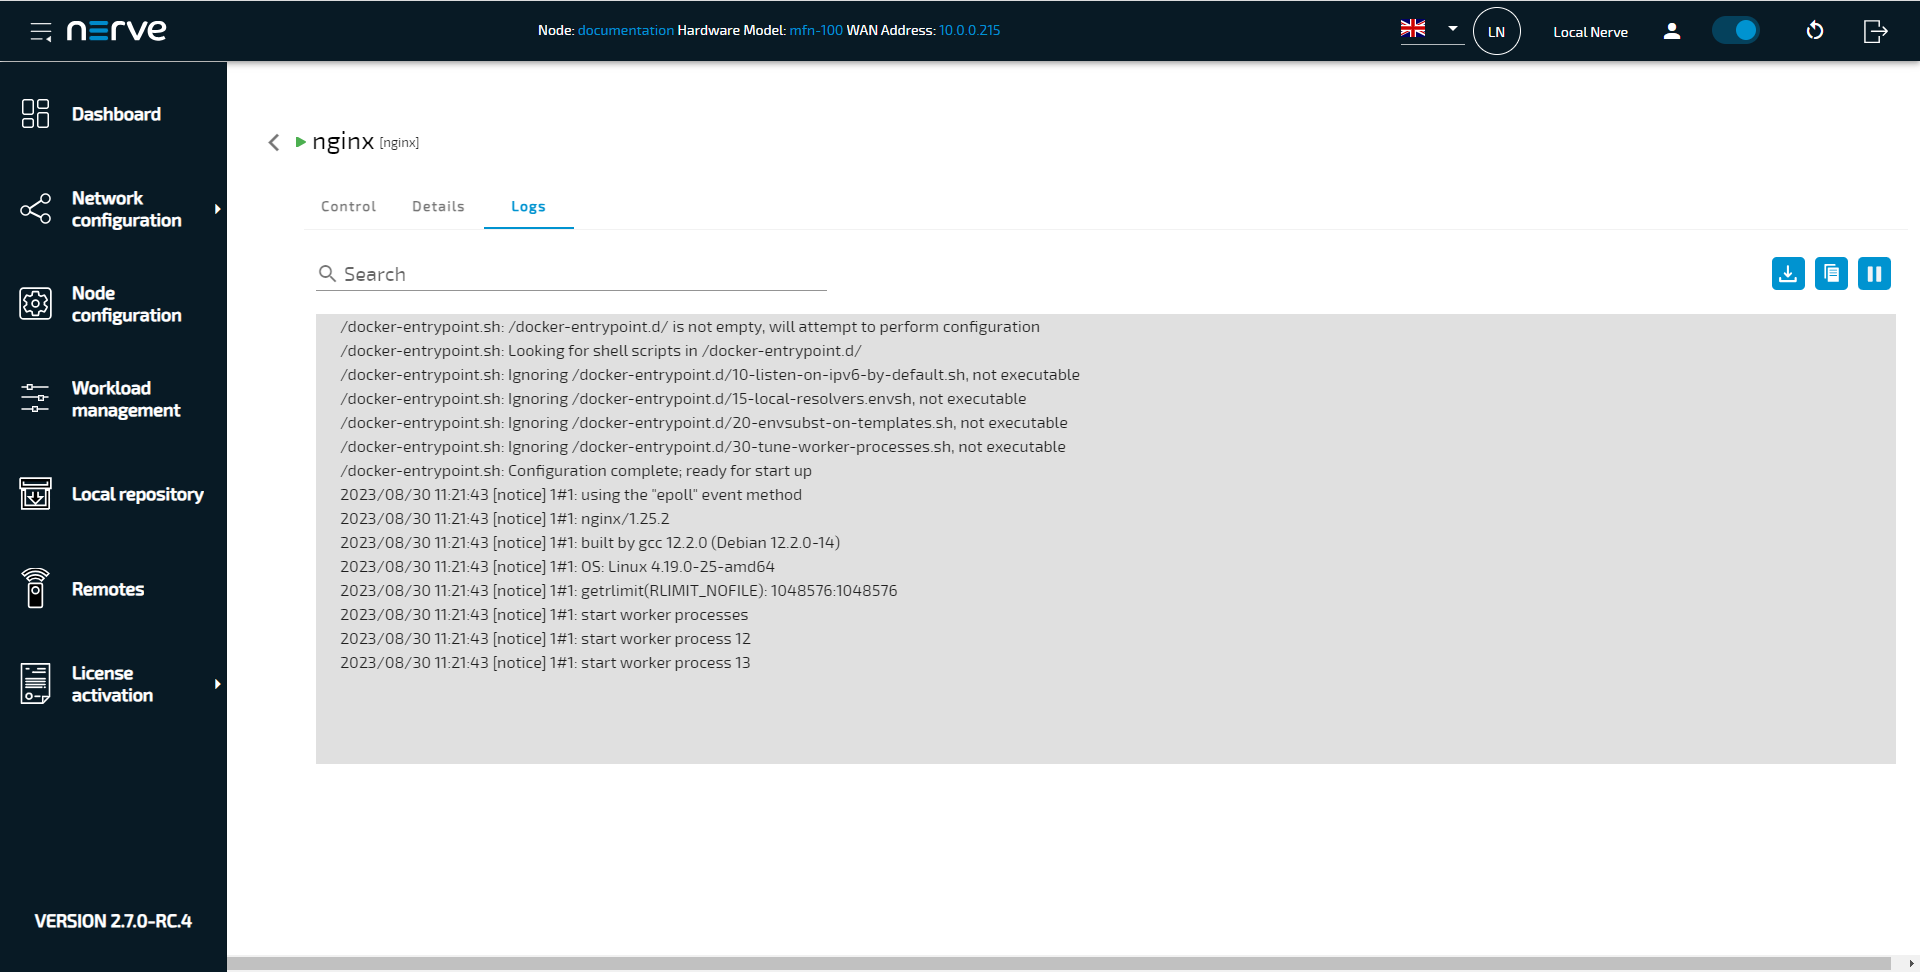
Note that for Docker Compose workloads, logs can be accessed for each service. Select a service from the list to display its logs.