What is new in version 2.4.1?
This is an overview of the features and changes added in the latest version of Nerve. For an extensive list of all changes, refer to the release notes. For more details on each feature, follow the links after the feature descriptions.
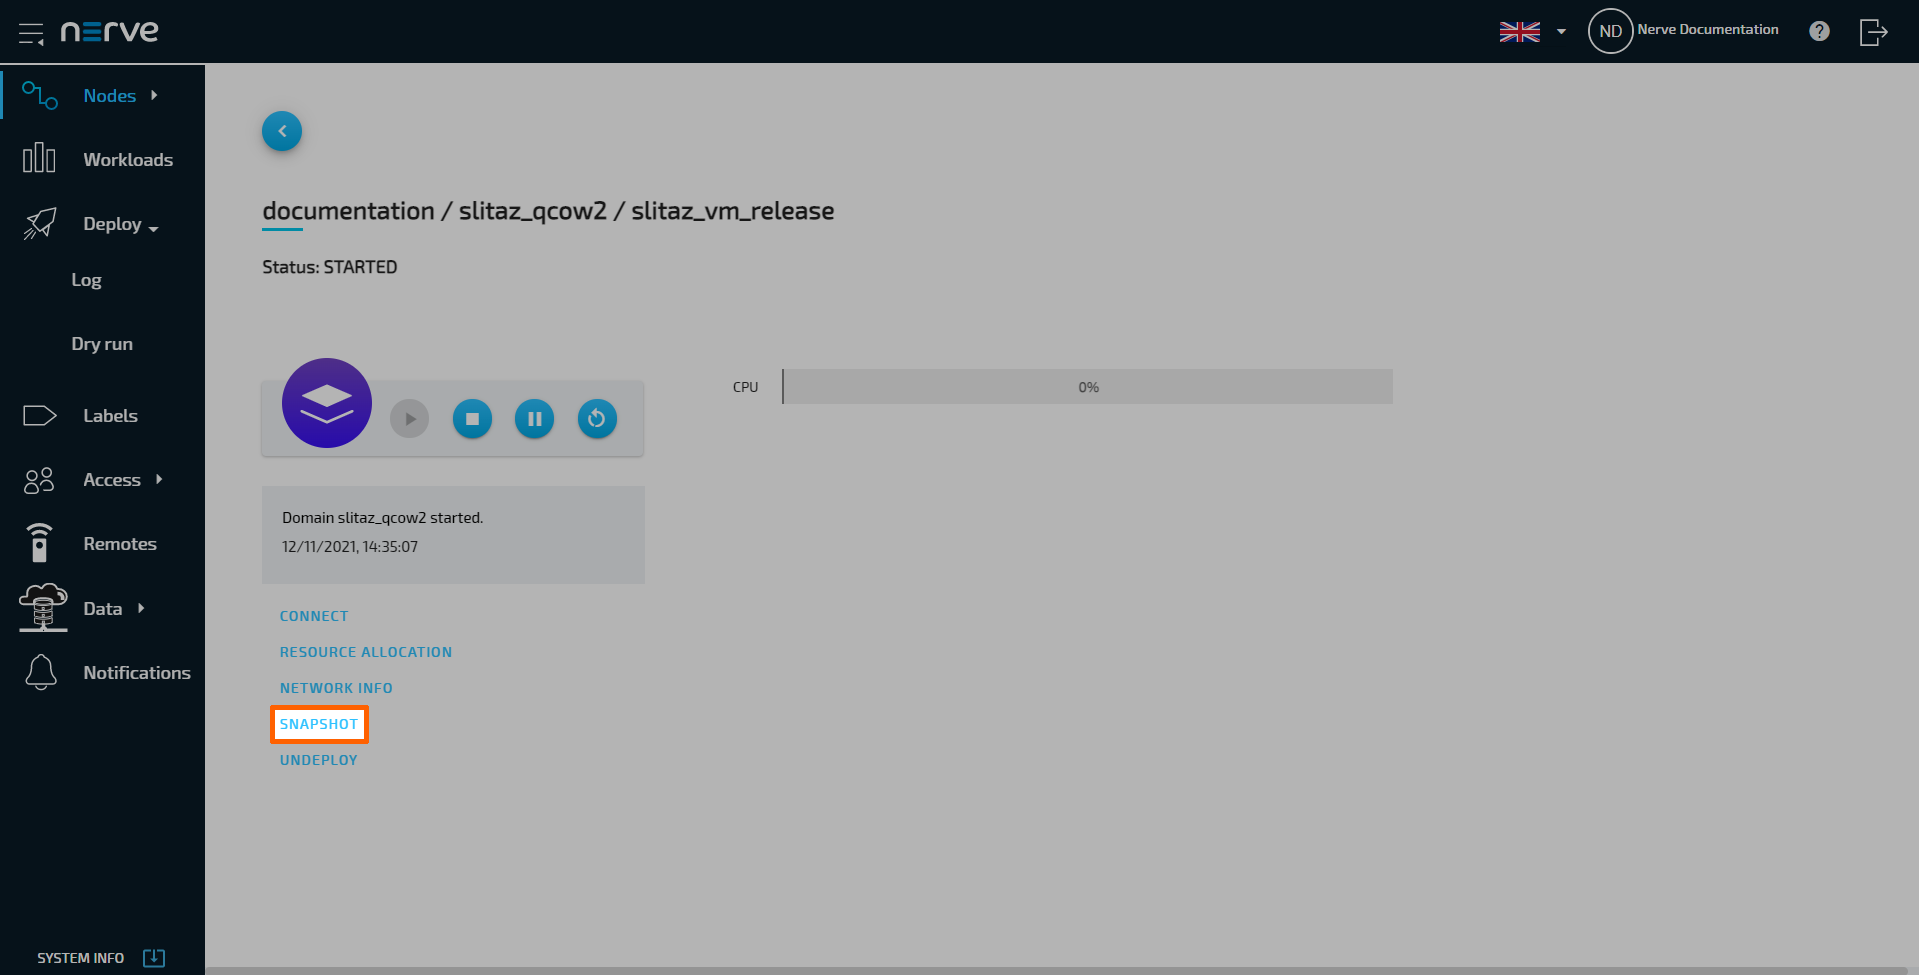
Virtual machine snapshots
Snapshots can now be taken of virtual machines running in the Nerve system. To enable this, the QCOW2 file format has been introduced as a supported format for virtual machine images. Snapshots are not supported for virtual machines using IMG or RAW image files. One snapshot can be created at a time, which can also be scheduled to be executed automatically. The process takes seconds or minutes. Snapshots are designed to be temporary save states or fallbacks of a virtual machine that are taken before configuration or updates. Snapshots are single, dynamically growing files stored on the Nerve Device.
In the Management System, select a node from the node tree that has a compatible virtual machine deployed. Select the workload to access the workload control screen. The Snapshot option is located on the left side underneath the workload icon. However, note that in addition to the QCOW2 image of the VM and snapshots being enabled in the workload settings, the active user needs to have the required permissions assigned in the Management System for the command to appear.
Note
The snapshot menu is also accessible through the Local UI.
For more detailed information, refer to Virtual machine snapshots.
Virtual machine backup
In order to save a certain virtual machine configuration, backups of virtual machines (QCOW2, RAW or IMG) can now be created. They take much longer to create compared to snapshots and cannot be scheduled, as they are not designed to be done frequently. A backup is an identical copy of the virtual machine that is stored in a separate repository. This repository needs to be an NFS server created beforehand and then defined in the Local repository menu in the Local UI. The repository for virtual machine backups can be shared between nodes, making a transfer of backups between nodes possible.
Access the workload control screen in either Local UI or the Management System and select a virtual machine workload tile. The Backup option is located on the left side underneath the workload icon.
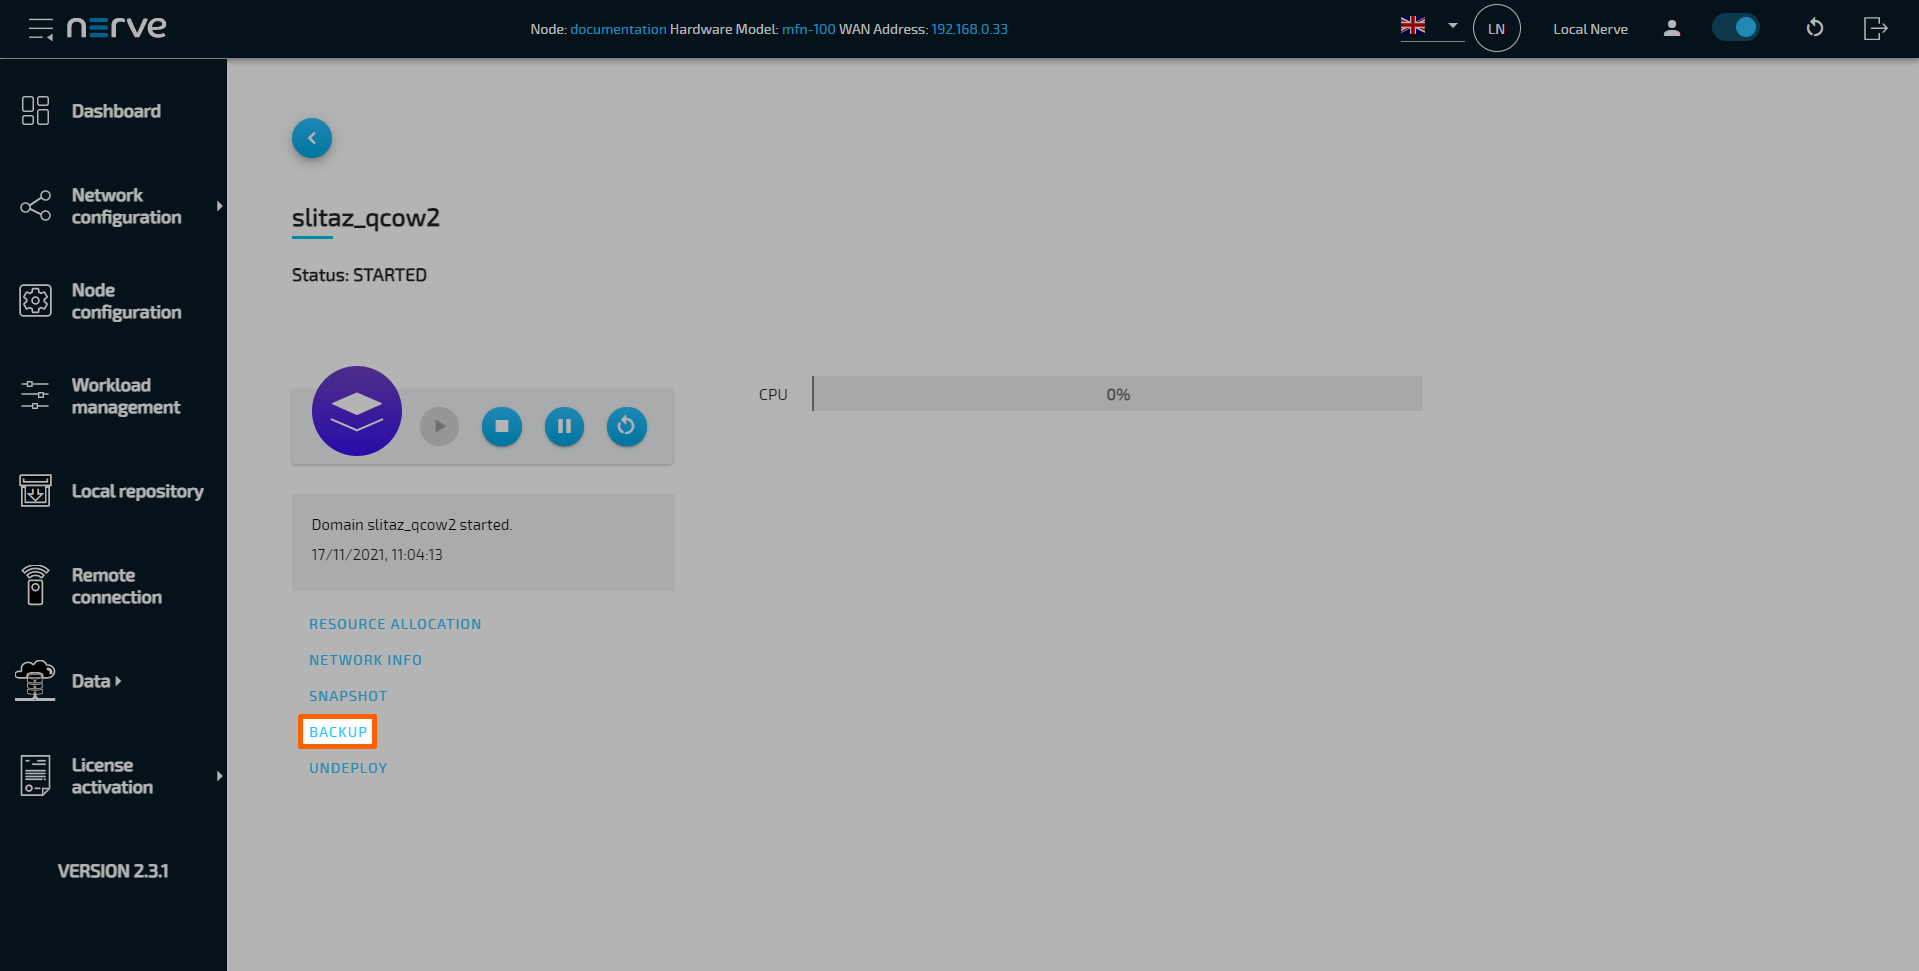
For more detailed information, refer to Virtual machine backups.
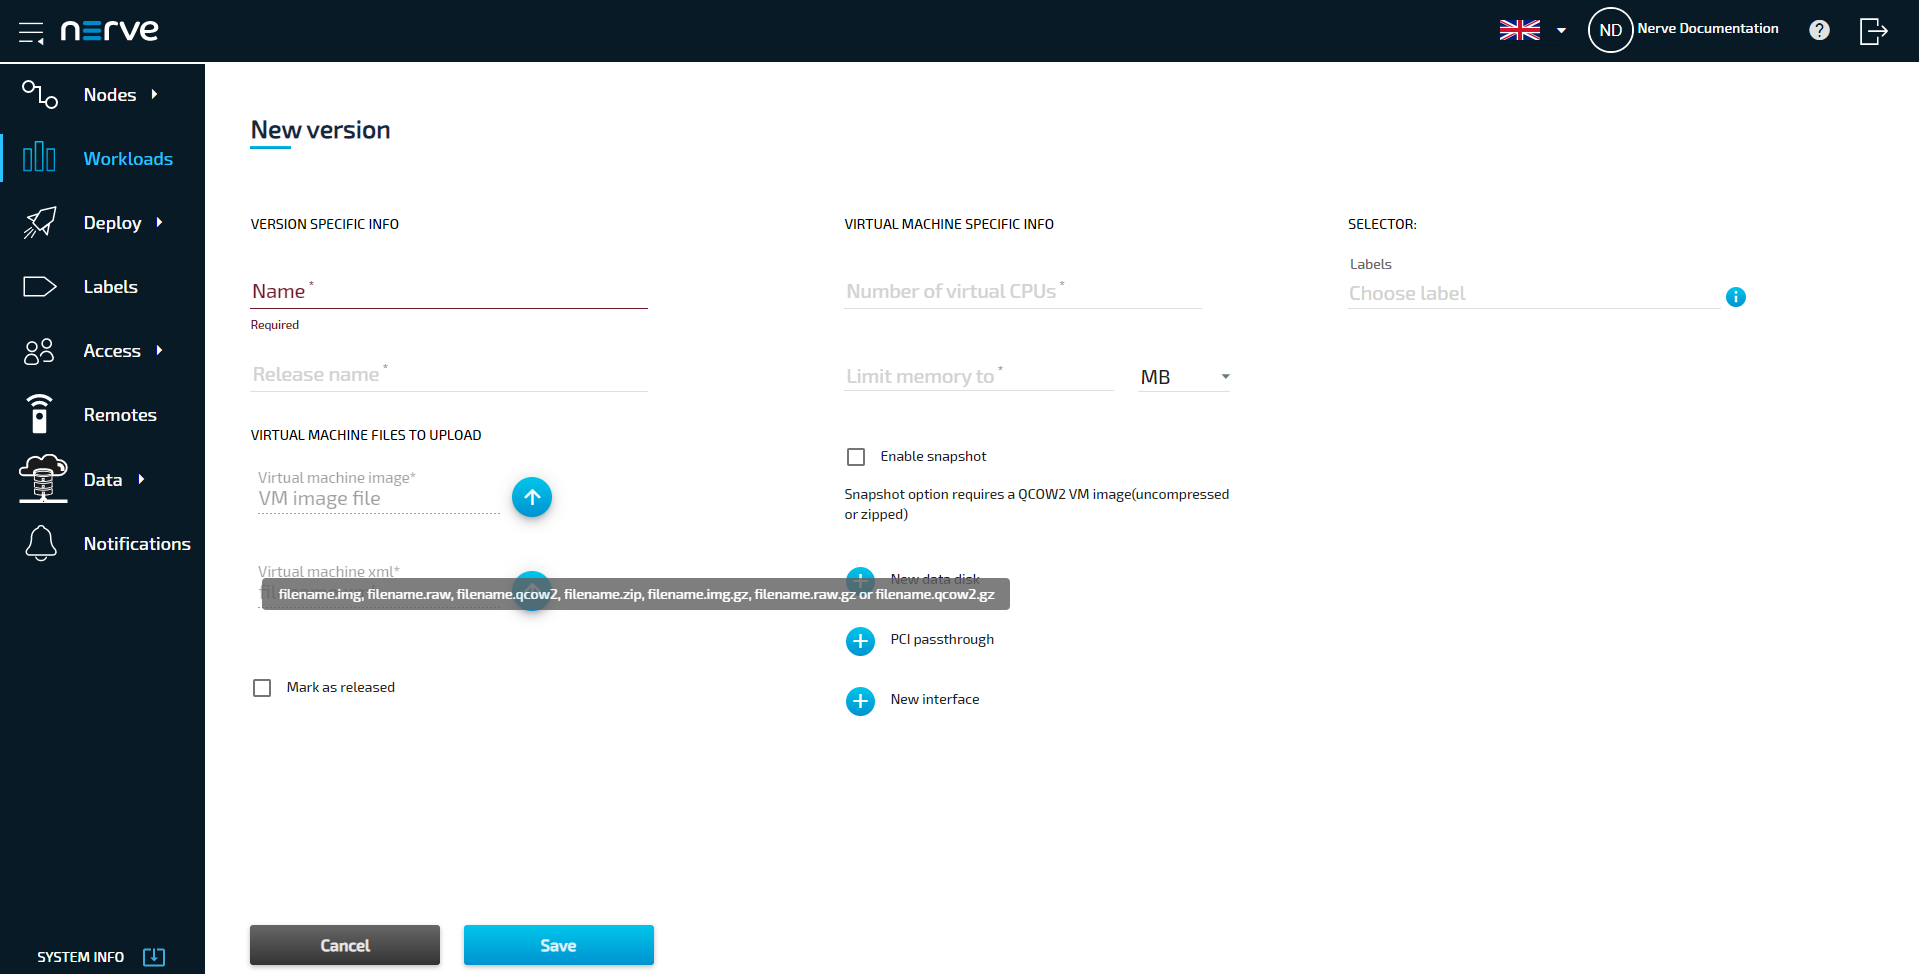
Upload of compressed virtual machine images
Virtual machine image files can now be uploaded as compressed archives. The supported image formats (IMG, RAW and QCOW2) may now be uploaded as compressed ZIP and GZIP (or GZ) files. Up until now virtual machine image files could only be uploaded uncompressed. This caused inconvenience and long upload times when provisioning. The tooltip and the field for the image upload have been updated with hints according to this change.
Display of network information for virtual machines
A new Network info command is available in the Virtual Machine workload control screen. Selecting the command opens a read only dialog. It contains the following information related to the networks of the virtual machine:
- Interface name
- Source network interface
- MAC address
- IP address
- Kbyte received
- Kbyte transmitted
If no network interfaces are defined, the dialog will display a message that no network interfaces have been defined for this workload. The NETWORK INFO option is located in the workload control screen, on the left side underneath the workload icon.
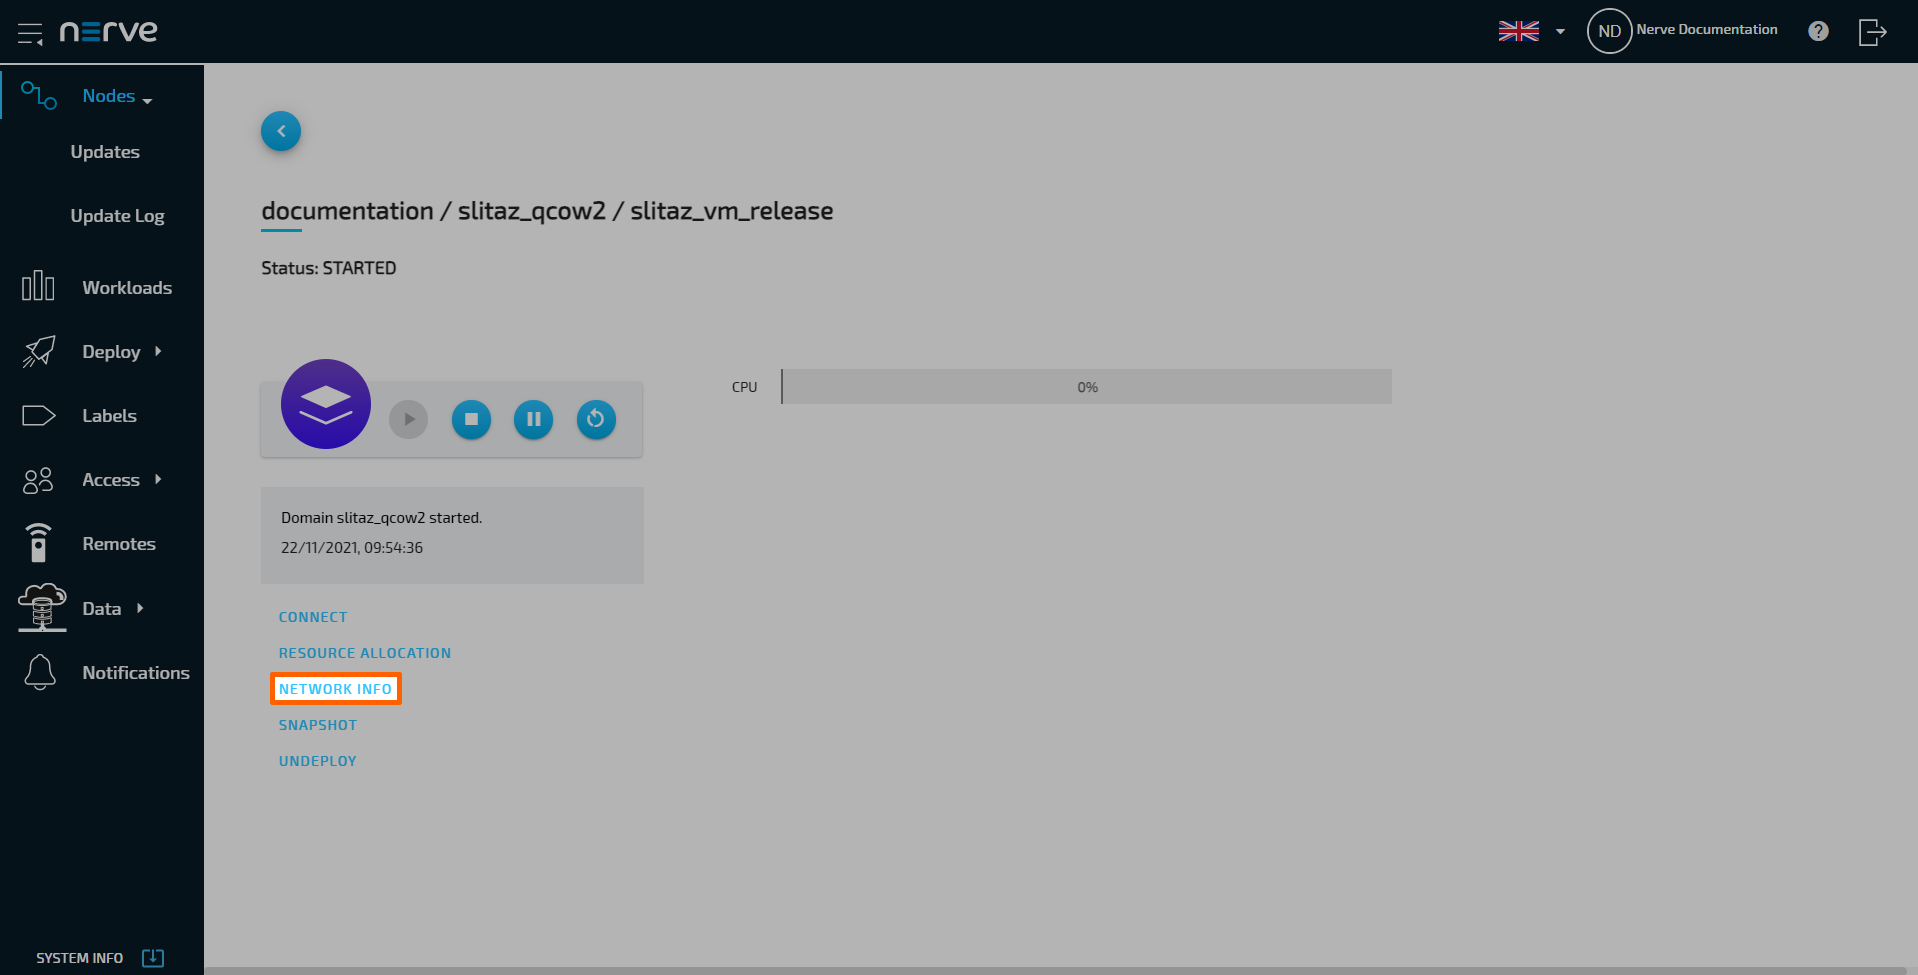
For more detailed information, refer to Virtual machine network info.
Node capabilities
An overview for the capabilities of a Nerve node is now available in the node details view. The supported capabilities are listed in a read only dialog. Select a node from the node tree and the Capabilites option is located on the left side underneath the node details.
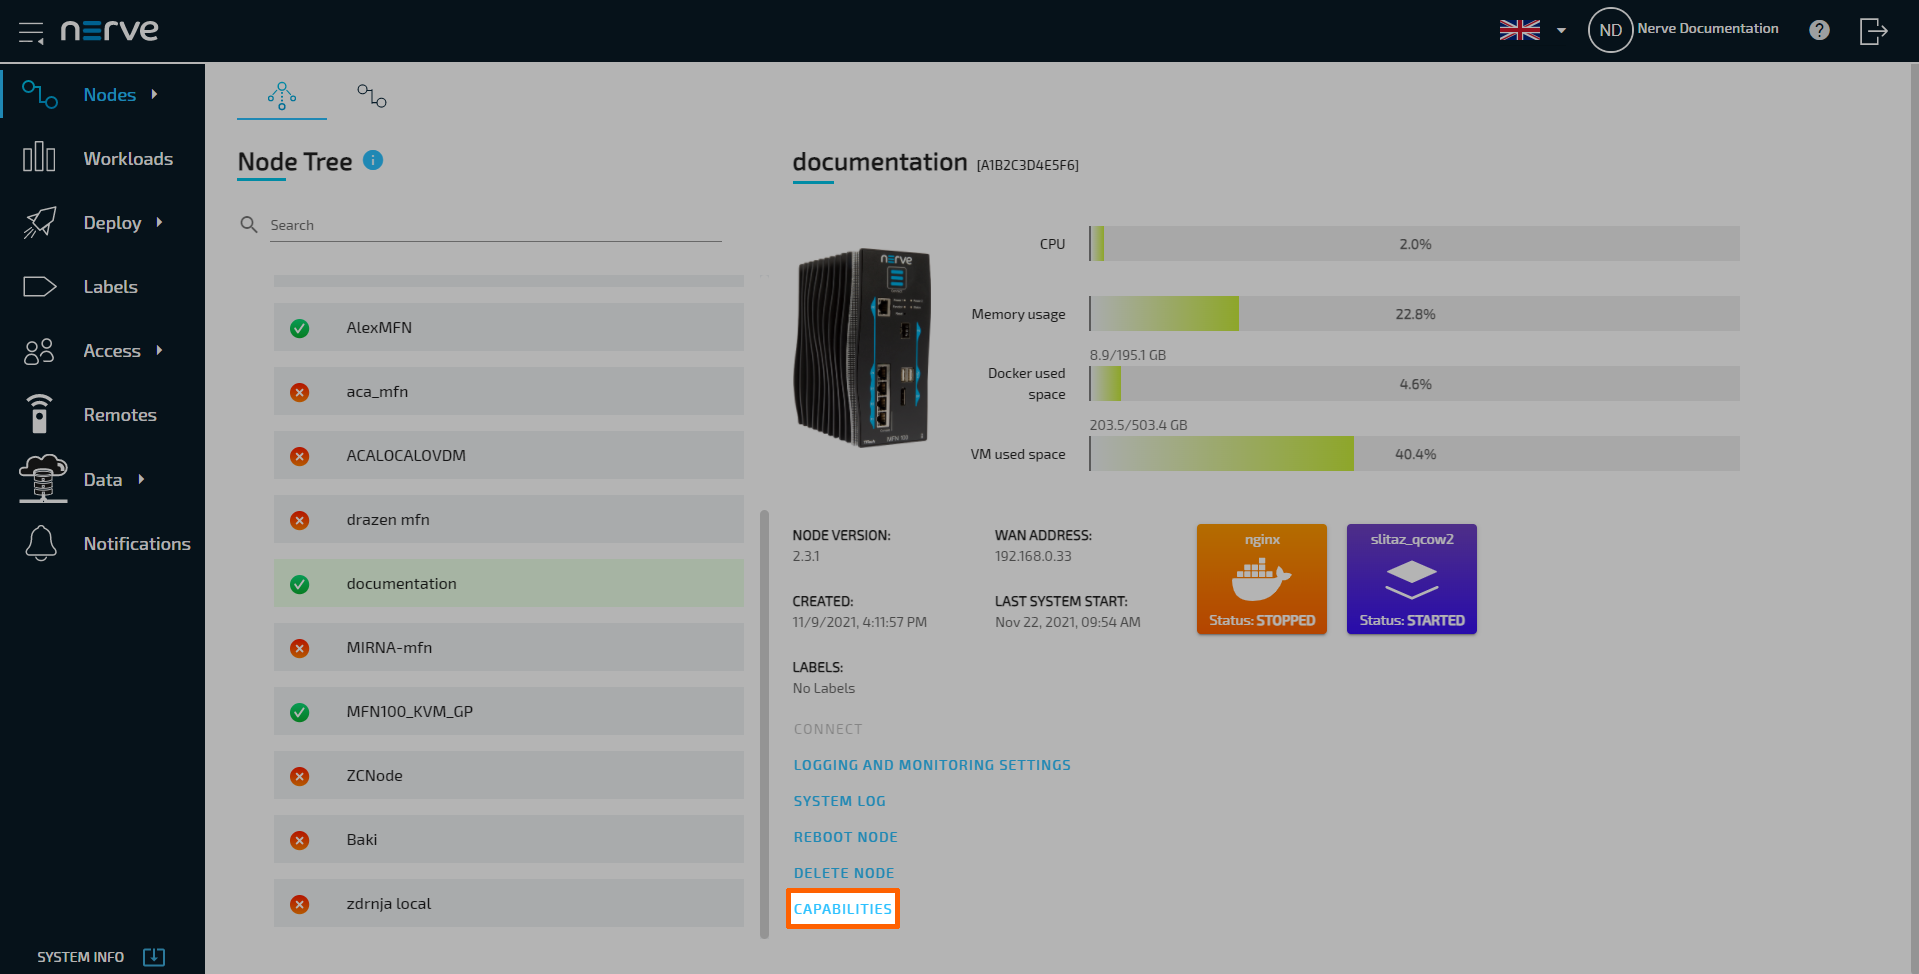
For more detailed information, refer to Node capabilites.
Changes to the Management System update procedure
Updating and reverting the Management System to new or old versions is now a service that is executed by Nerve service technicians. The are no changes to the UI apart from the fact that the update and revert process cannot be started by users.
For more detailed information, refer to Updating the Management System.
Nerve Connection Manager v1.0.4
A new Nerve Connection Manager version is available. Download v1.0.4 from the Nerve Software Center.
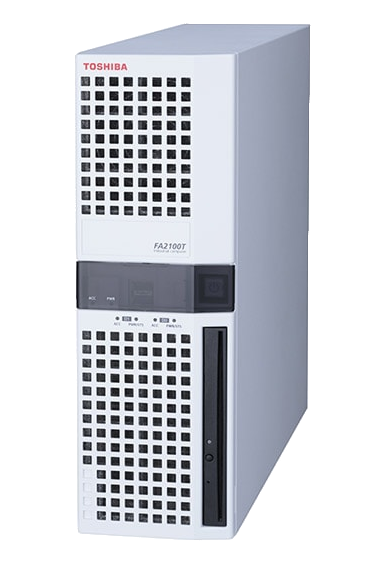
New qualified third party device Toshiba
The FA2100T-700 by Toshiba is the newest third party device that has been qualified as a Nerve Device.
For more detailed information, refer to Toshiba FA2100T-700.
Data Services
The Data Services received a few UI and UX quality of life improvements. The operation mode of the Gateway has been improved.
Smart Connection Creation Mechanism (SCCM) in the Data Services
The Data Services Gateway now uses the Smart Connection Creation Mechanism (SCCM) to avoid the necessity of restarting the Gateway every time a new configuration is applied. With the new approach a new configuration may potentially be applied without interrupting existing connections. As an example, if an existing Gateway configuration with three inputs is edited but only one input is changed, all other inputs continue operating. A warning message will inform of interruptions to connections when a new configuration is applied.
For more detailed information, refer to Notable features.
Grafana: Home dashboard settings and kiosk mode
Grafana in the Nerve Data Services received two updates:
-
Home dashboard settings
A dashboard of choice can now be set to be the home screen after selecting Data in the navigation on the left in the Local UI. Note that this is only available in the Local UI.
Access the Local UI and select the user settings symbol in the top-right corner. Select the SET GRAFANA HOME DASHBOARD tab to reach the configuration screen.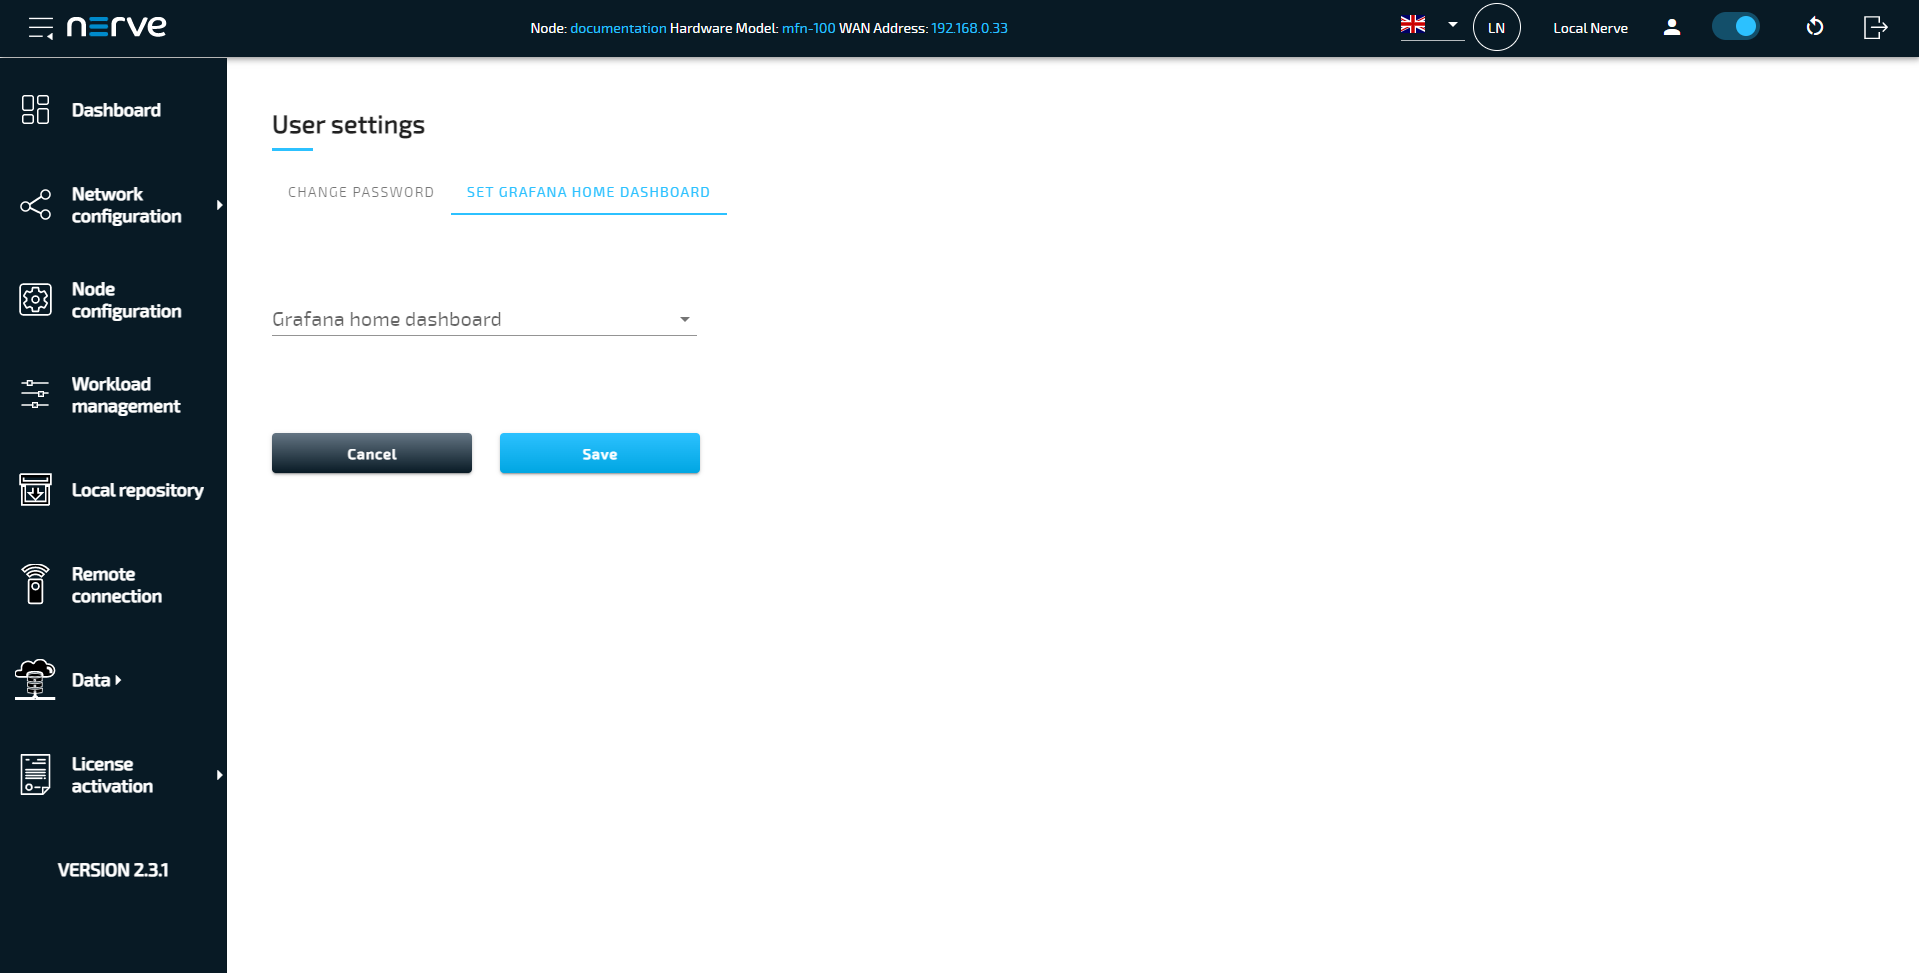
For more detailed information, refer to Setting a home dashboard.
-
Kiosk mode
It is now possible to access Grafana dashboards with viewer permissions without logging in to the Local UI. This enables viewer access and a session without timeout so that dashboards can be visualized indefinitely and show dynamic data without interacting with the Grafana window.
To access Grafana in kiosk mode, enter<localui-ipaddress>:3333/dp/visu>in a browser window. Note that this is only available in the Local UI.
The Grafana window can also be detached from the Local UI through a new command in the command bar in Grafana. Doing so will launch a detached kiosk mode with admin permissions.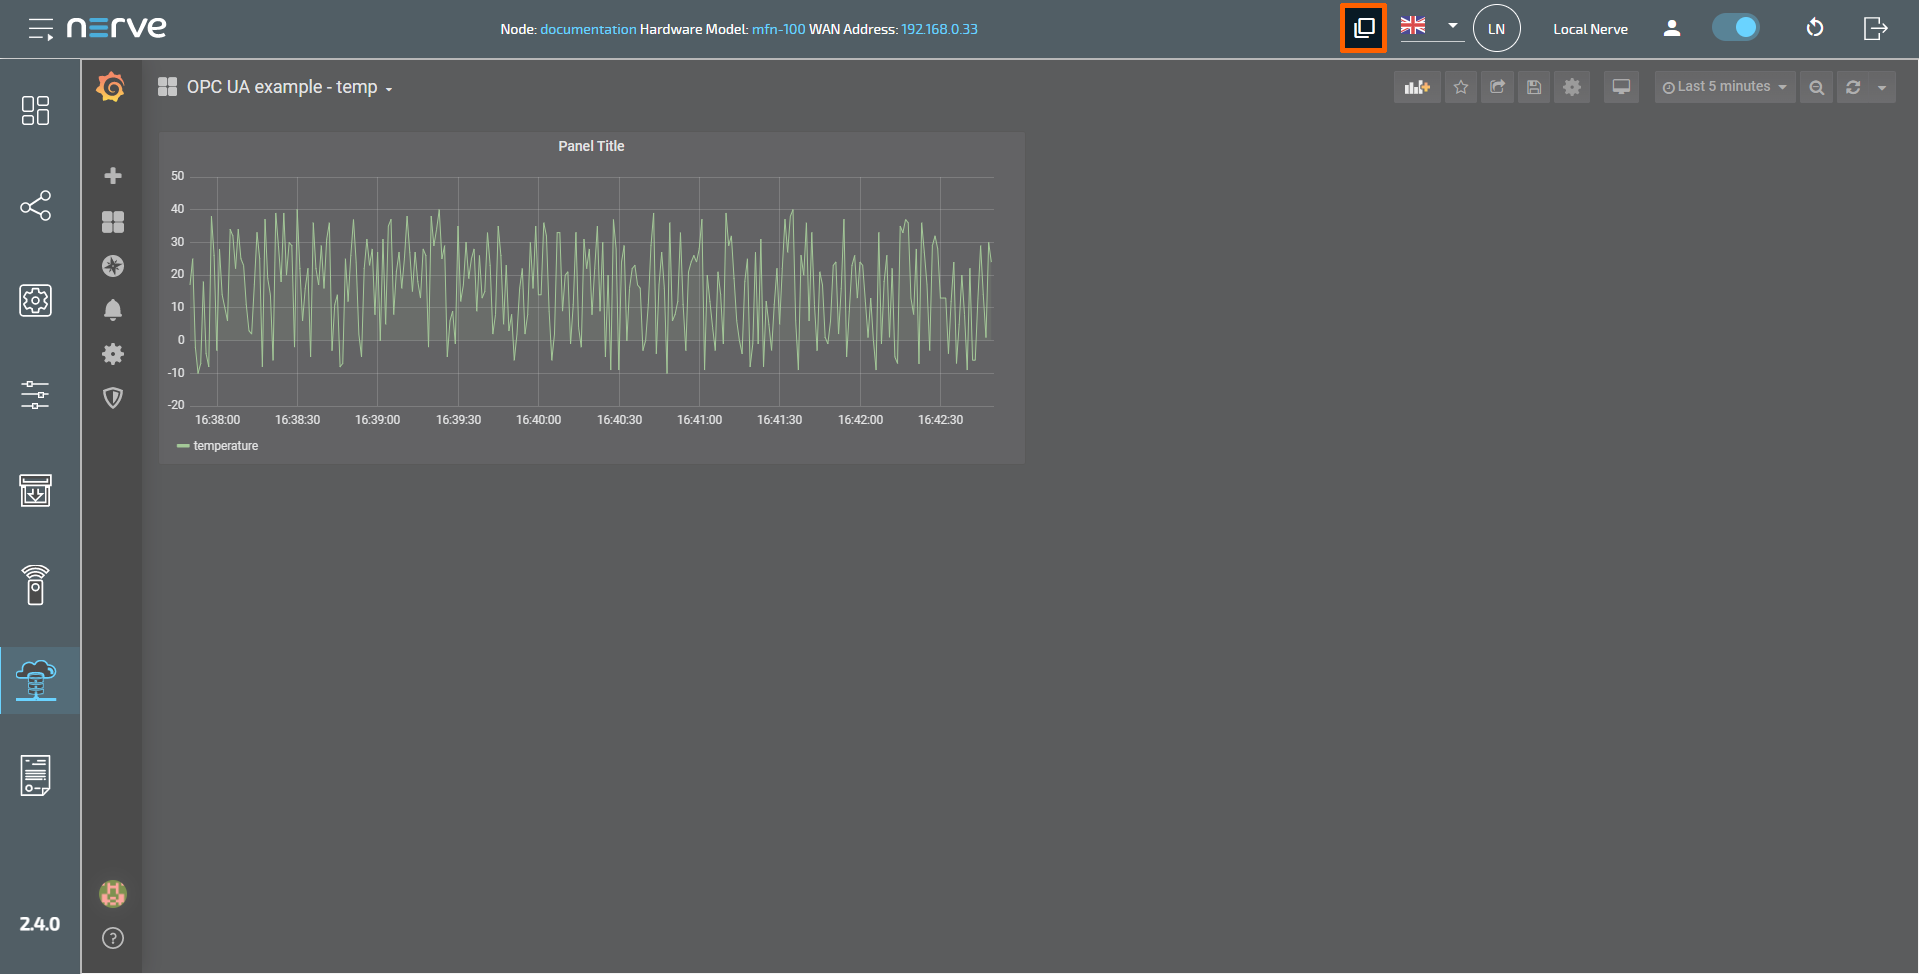
For more detailed information, refer to Detaching Grafana in kiosk mode.
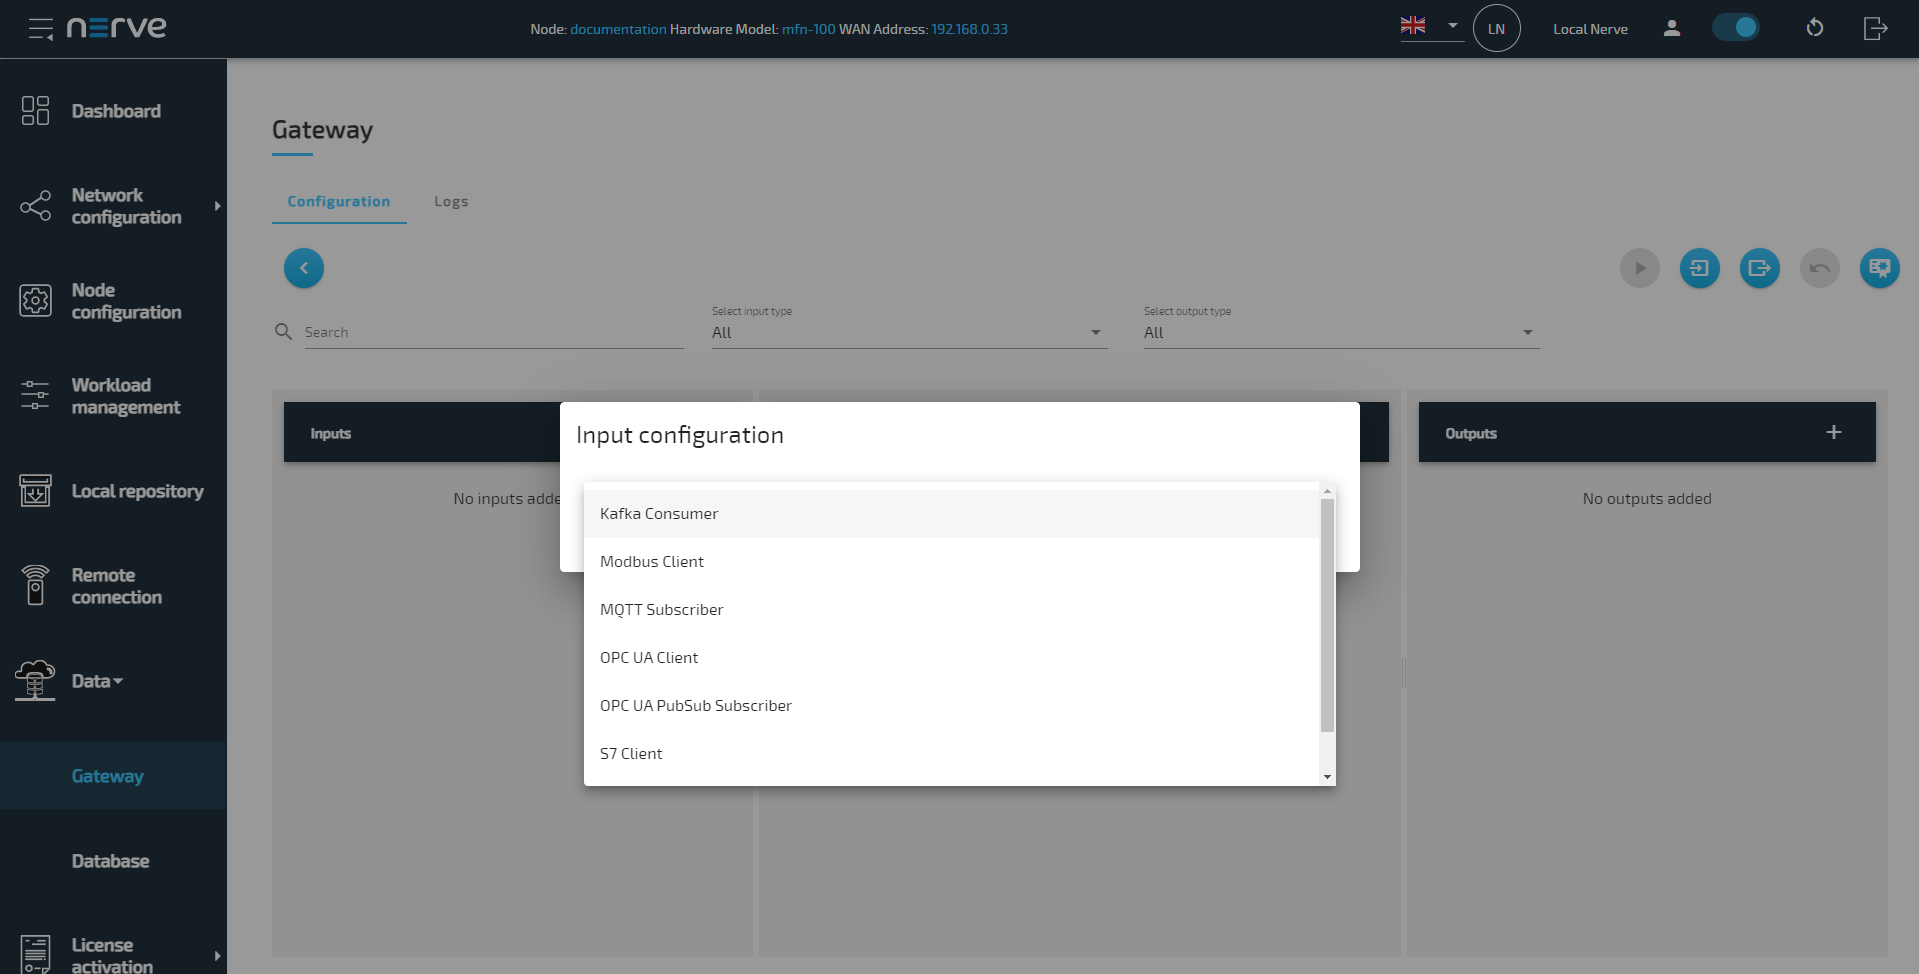
Support for Kafka Consumer input
After introducing Kafka Producer as a supported output in version 2.3.1, Kafka Consumer is introduced as an input for the Gateway. It can be selected through the GUI in the Data Services Gateway when editing a configuration.
For more detailed information, refer to Kafka Consumer.